

Key Insights
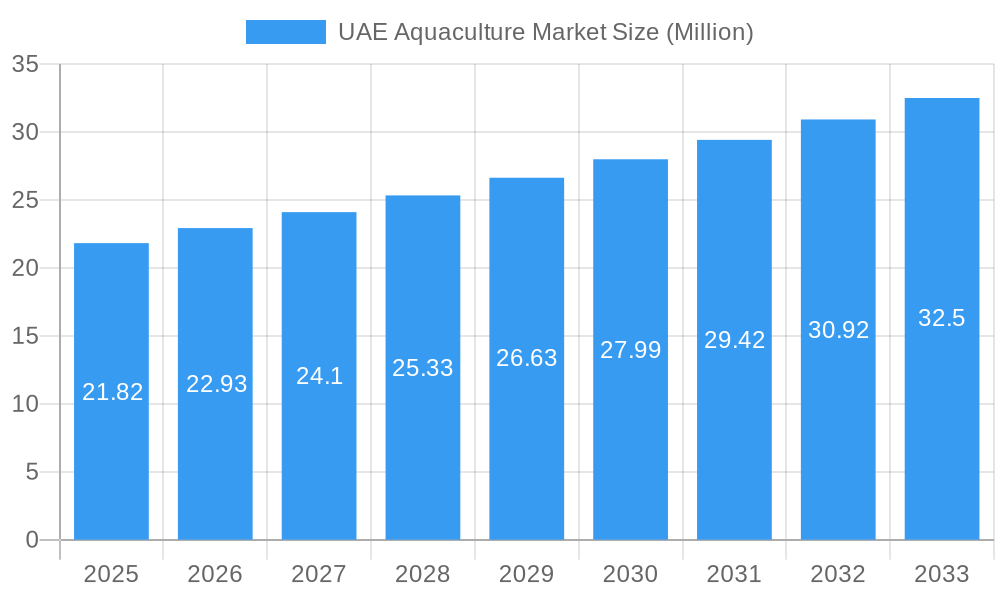
The UAE aquaculture market, valued at $21.82 million in 2025, is projected to experience robust growth, driven by increasing consumer demand for seafood, government support for sustainable aquaculture practices, and a focus on food security within the nation. The Compound Annual Growth Rate (CAGR) of 5.10% from 2025 to 2033 indicates a steady expansion, reaching an estimated market value exceeding $35 million by 2033. Key drivers include rising disposable incomes fueling higher seafood consumption, coupled with the UAE's strategic initiatives to diversify its food sources and reduce reliance on imports. While challenges such as water scarcity and the need for technological advancements in aquaculture techniques persist, the market is expected to overcome these hurdles due to ongoing investments in research and development, as well as the adoption of innovative farming methods. The market segmentation reveals strong performance across various species, including tilapia, shrimp, and salmon, with pelagic and demersal fish segments also contributing significantly. The presence of established players like Prime Aquaculture FZE, Marine Farm Ltd., and Emirates National Aquaculture LLC indicates a competitive yet growing market landscape. Growth in specific segments will likely be influenced by consumer preferences, import/export dynamics, and government policies promoting sustainable aquaculture.
UAE Aquaculture Market Market Size (In Million)
The forecast period of 2025-2033 presents significant opportunities for market participants. Further analysis of consumption patterns, import/export data, and price trends for each fish type (Tilapia, Scallop, Shrimp, Lobsters, Caviar, Salmon, Pelagic Fish, Barracuda, Pomfret, and Freshwater Fish) will be crucial for strategic decision-making. The ongoing focus on sustainable practices and technological advancements will continue shaping the market, driving efficiency and enhancing the quality and sustainability of aquaculture products. Companies specializing in innovative aquaculture techniques and value-added seafood products are poised to benefit most from this growing market. Analyzing the regional distribution within the UAE and exploring potential expansion into neighboring markets could further unlock significant growth potential.
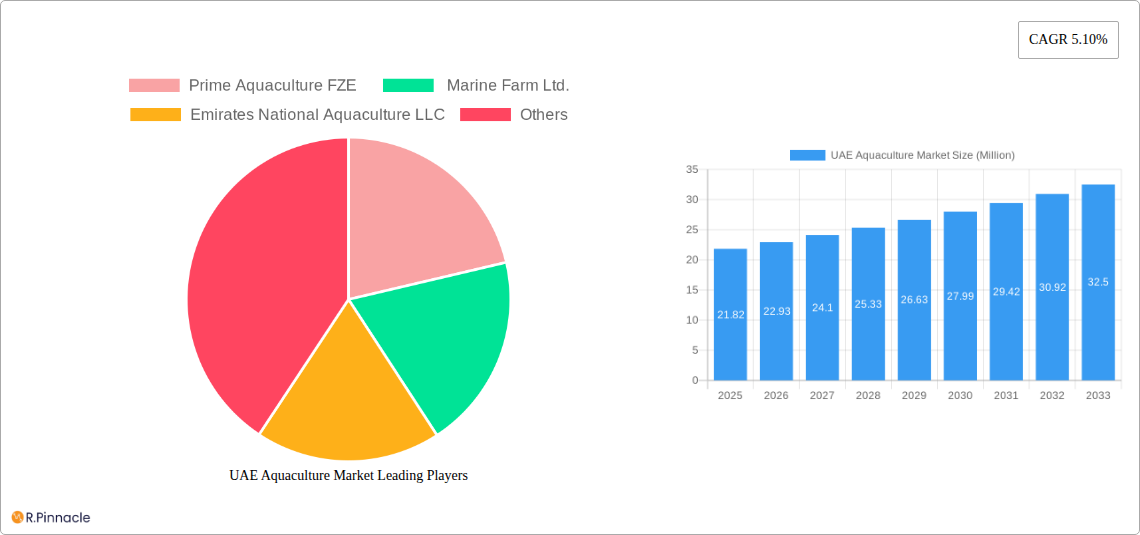
UAE Aquaculture Market Company Market Share
UAE Aquaculture Market Report: 2019-2033 Forecast
This comprehensive report provides a detailed analysis of the UAE aquaculture market, offering invaluable insights for industry professionals, investors, and stakeholders. Covering the period from 2019 to 2033, with a focus on 2025, this report examines market dynamics, key players, emerging trends, and future growth potential. The report leverages extensive data analysis to provide a robust understanding of the UAE's aquaculture landscape, encompassing production, consumption, import/export trends, and price fluctuations across various segments.
UAE Aquaculture Market Structure & Innovation Trends
The UAE aquaculture market exhibits a moderately concentrated structure, with key players like Prime Aquaculture FZE, Marine Farm Ltd., and Emirates National Aquaculture LLC holding significant market share. However, the market also features several smaller, specialized producers. Innovation is driven by government initiatives promoting food security, technological advancements in RAS (Recirculating Aquaculture Systems), and increasing consumer demand for sustainably sourced seafood. The regulatory framework, while supportive, faces ongoing challenges in streamlining licensing and permitting processes. Product substitutes, primarily imported seafood, pose a competitive threat. Market consolidation through M&A activities is anticipated, driven by the desire for economies of scale and enhanced technological capabilities. While precise M&A deal values are not publicly available for all transactions, anecdotal evidence suggests deals in the xx Million range are common for significant acquisitions within the sector.
- Market Concentration: Moderately concentrated, with a few dominant players and several smaller businesses.
- Innovation Drivers: Government food security initiatives, RAS technology adoption, rising consumer demand for sustainable seafood.
- Regulatory Framework: Supportive but with areas requiring improvement in licensing and permitting processes.
- Product Substitutes: Primarily imported seafood products.
- End-User Demographics: Growing population with increasing disposable income and changing dietary preferences towards healthier and sustainable seafood options.
- M&A Activities: Expected to increase, driving market consolidation and technological advancement.
UAE Aquaculture Market Dynamics & Trends
The UAE aquaculture market demonstrates robust growth, driven by factors such as rising population, increasing disposable incomes, and government support for the sector. The CAGR (Compound Annual Growth Rate) for the period 2025-2033 is projected at xx%, fueled by the expanding demand for high-quality seafood and increasing adoption of sustainable aquaculture practices. Market penetration of domestically produced seafood is currently at xx%, with significant potential for growth. Technological disruptions, such as advancements in RAS and precision aquaculture, are revolutionizing production efficiency and sustainability. Consumer preferences are shifting towards locally sourced, sustainably farmed seafood, creating opportunities for businesses adopting responsible aquaculture practices. The competitive landscape is dynamic, with both established players and new entrants vying for market share.
Dominant Regions & Segments in UAE Aquaculture Market
The UAE's aquaculture industry is geographically concentrated, with Abu Dhabi and Dubai serving as primary production hubs, driven by favorable environmental conditions and government infrastructure investments. Among the segments, shrimp, tilapia, and salmon are currently the most dominant, showing robust growth trajectories. Other segments, such as scallops, lobsters, caviar, and other types of fish, hold significant potential but are comparatively less developed.
Key Drivers for Dominant Segments:
- Shrimp: High consumer demand, successful RAS implementation, and government support.
- Tilapia: Relatively low production costs, high adaptability, and strong local demand.
- Salmon: Growing consumer preference for high-quality, sustainably produced salmon, coupled with successful RAS projects aiming to reduce reliance on imports.
Dominance Analysis: The dominance of these segments is attributed to factors like consumer preference, suitability to RAS technology, government support, and established supply chains.
Production Analysis: Shrimp currently leads in production volume, followed by tilapia and other types of fish.
Consumption Analysis: Consumption of shrimp, tilapia, and salmon is highest among all seafood types, showing a preference for these varieties based on taste, availability, and perceived health benefits.
Import/Export Analysis: Import volumes are significant for certain species currently not being produced locally in sufficient quantities. Export volumes are still developing, but there's potential for growth as local production increases and quality improves.
Price Trend Analysis: Prices reflect fluctuations in production costs, global market trends and consumer preferences. The market displays a price elasticity pattern; increased domestic production can impact prices favorably.
UAE Aquaculture Market Product Innovations
The UAE aquaculture market is witnessing significant product innovation, primarily driven by technological advancements in RAS. These systems allow for efficient water reuse, minimizing environmental impact and increasing production yield. Companies are developing innovative feed formulations to enhance fish health, growth rate, and nutritional value. The focus is on producing high-quality, sustainably raised seafood that meets the growing demands of health-conscious consumers. This focus on quality and sustainability gives domestically produced seafood a competitive advantage over imported products.
Report Scope & Segmentation Analysis
This report comprehensively segments the UAE aquaculture market based on species (Tilapia, Scallop, Shrimp, Lobsters, Caviar, Salmon, Other Types), type (Pelagic Fish, Barracuda, Pomfret, Freshwater Fish), and production and consumption analysis (Value and Volume, Import/Export analysis (Value and Volume), and Price Trend Analysis). Each segment’s growth projections, market sizes, and competitive dynamics are thoroughly analyzed, providing a granular view of the market’s structure and potential. Growth projections vary significantly among segments, with shrimp, tilapia and salmon showcasing the highest growth potential, while others, such as caviar, remain niche markets.
Key Drivers of UAE Aquaculture Market Growth
The UAE aquaculture market's growth is propelled by several key factors: government initiatives promoting food security and investment in the sector; rising consumer demand for high-quality, sustainably sourced seafood; technological advancements, such as RAS, improving production efficiency; and increasing consumer awareness of the health benefits of fish consumption. The National Food Security Strategy 2051 is a significant driver, prompting investments in aquaculture to reduce reliance on imports.
Challenges in the UAE Aquaculture Market Sector
Challenges facing the UAE aquaculture sector include high initial investment costs for RAS technology, limited access to skilled labor, competition from imported seafood, and dependence on imported feed ingredients. Water scarcity, though addressed by technological solutions, remains a factor to consider. Regulatory hurdles can also delay project implementation and increase operational costs. These factors contribute to increased production costs and affect profitability.
Emerging Opportunities in UAE Aquaculture Market
Significant opportunities lie in expanding production capacity through increased adoption of RAS technology, targeting niche markets with high-value species, developing value-added seafood products, and enhancing export capabilities. Exploring new species suitable for the UAE's environment and promoting sustainable practices can further boost the sector's growth. Moreover, utilizing technological innovations for effective disease management and environmental monitoring are key to mitigating the risks inherent in the business.
Leading Players in the UAE Aquaculture Market Market
- Prime Aquaculture FZE
- Marine Farm Ltd.
- Emirates National Aquaculture LLC
Key Developments in UAE Aquaculture Market Industry
- February 2022: Prime Aquaculture FZE, an Emirates National Aquaculture LLC subsidiary, initiates construction of the region's first shrimp RAS in Jafza, aiming to meet increasing regional demand and contribute to the National Food Security Strategy 2051. Completion is expected in Q1 2023.
- March 2022: A project commences in Abu Dhabi to build a new RAS facility, targeting the production of 2,000 metric tons of premium Atlantic salmon annually. This project showcases the potential of technology to reduce resource wastage by reusing over 99.5% of process water.
- July 2022: The UAE Ministry of Climate Change and Environment collaborates with Abu Dhabi National Oil Company and Emirates National Oil Company to provide subsidies to fishermen, mitigating rising costs and boosting the fisheries sector. This collaborative initiative is crucial for maintaining the long-term sustainability of the fishing and aquaculture sectors.
Future Outlook for UAE Aquaculture Market Market
The UAE aquaculture market is poised for significant growth driven by government support, technological advancements, and increasing consumer demand. Strategic investments in RAS technology, the exploration of new species, and the development of value-added products will be key to realizing the market's full potential. The sector's future success hinges on balancing sustainable practices with economic viability, ensuring a strong, secure, and profitable local seafood industry for the UAE.
UAE Aquaculture Market Segmentation
-
1. Type (Pr
-
1.1. Pelagic Fish
- 1.1.1. Sardines
- 1.1.2. Mackerel
- 1.1.3. Tuna
- 1.1.4. Barracuda
-
1.2. Demersal Fish
- 1.2.1. Grouper
- 1.2.2. Trevally
- 1.2.3. Emperor
- 1.2.4. Pomfret
-
1.3. Freshwater Fish
- 1.3.1. Tilapia
- 1.4. Scallop
- 1.5. Shrimp
- 1.6. Lobsters
- 1.7. Caviar
- 1.8. Salmon
- 1.9. Other Types
-
1.1. Pelagic Fish
-
2. Type (Pr
-
2.1. Pelagic Fish
- 2.1.1. Sardines
- 2.1.2. Mackerel
- 2.1.3. Tuna
- 2.1.4. Barracuda
-
2.2. Demersal Fish
- 2.2.1. Grouper
- 2.2.2. Trevally
- 2.2.3. Emperor
- 2.2.4. Pomfret
-
2.3. Freshwater Fish
- 2.3.1. Tilapia
- 2.4. Scallop
- 2.5. Shrimp
- 2.6. Lobsters
- 2.7. Caviar
- 2.8. Salmon
- 2.9. Other Types
-
2.1. Pelagic Fish
UAE Aquaculture Market Segmentation By Geography
-
1. North America
- 1.1. United States
- 1.2. Canada
- 1.3. Mexico
-
2. South America
- 2.1. Brazil
- 2.2. Argentina
- 2.3. Rest of South America
-
3. Europe
- 3.1. United Kingdom
- 3.2. Germany
- 3.3. France
- 3.4. Italy
- 3.5. Spain
- 3.6. Russia
- 3.7. Benelux
- 3.8. Nordics
- 3.9. Rest of Europe
-
4. Middle East & Africa
- 4.1. Turkey
- 4.2. Israel
- 4.3. GCC
- 4.4. North Africa
- 4.5. South Africa
- 4.6. Rest of Middle East & Africa
-
5. Asia Pacific
- 5.1. China
- 5.2. India
- 5.3. Japan
- 5.4. South Korea
- 5.5. ASEAN
- 5.6. Oceania
- 5.7. Rest of Asia Pacific

UAE Aquaculture Market Regional Market Share
Geographic Coverage of UAE Aquaculture Market
UAE Aquaculture Market REPORT HIGHLIGHTS
| Aspects | Details |
|---|---|
| Study Period | 2020-2034 |
| Base Year | 2025 |
| Estimated Year | 2026 |
| Forecast Period | 2026-2034 |
| Historical Period | 2020-2025 |
| Growth Rate | CAGR of 5.10% from 2020-2034 |
| Segmentation |
|
Table of Contents
- 1. Introduction
- 1.1. Research Scope
- 1.2. Market Segmentation
- 1.3. Research Objective
- 1.4. Definitions and Assumptions
- 2. Executive Summary
- 2.1. Market Snapshot
- 3. Market Dynamics
- 3.1. Market Drivers
- 3.2. Market Restrains
- 3.3. Market Trends
- 3.4. Market Opportunities
- 4. Market Factor Analysis
- 4.1. Porters Five Forces
- 4.1.1. Bargaining Power of Suppliers
- 4.1.2. Bargaining Power of Buyers
- 4.1.3. Threat of New Entrants
- 4.1.4. Threat of Substitutes
- 4.1.5. Competitive Rivalry
- 4.2. PESTEL analysis
- 4.3. BCG Analysis
- 4.3.1. Stars (High Growth, High Market Share)
- 4.3.2. Cash Cows (Low Growth, High Market Share)
- 4.3.3. Question Mark (High Growth, Low Market Share)
- 4.3.4. Dogs (Low Growth, Low Market Share)
- 4.4. Ansoff Matrix Analysis
- 4.5. Supply Chain Analysis
- 4.6. Regulatory Landscape
- 4.7. Current Market Potential and Opportunity Assessment (TAM–SAM–SOM Framework)
- 4.8. PRI Analyst Note
- 4.1. Porters Five Forces
- 5. Market Analysis, Insights and Forecast 2021-2033
- 5.1. Market Analysis, Insights and Forecast - by Type (Pr
- 5.1.1. Pelagic Fish
- 5.1.1.1. Sardines
- 5.1.1.2. Mackerel
- 5.1.1.3. Tuna
- 5.1.1.4. Barracuda
- 5.1.2. Demersal Fish
- 5.1.2.1. Grouper
- 5.1.2.2. Trevally
- 5.1.2.3. Emperor
- 5.1.2.4. Pomfret
- 5.1.3. Freshwater Fish
- 5.1.3.1. Tilapia
- 5.1.4. Scallop
- 5.1.5. Shrimp
- 5.1.6. Lobsters
- 5.1.7. Caviar
- 5.1.8. Salmon
- 5.1.9. Other Types
- 5.1.1. Pelagic Fish
- 5.2. Market Analysis, Insights and Forecast - by Type (Pr
- 5.2.1. Pelagic Fish
- 5.2.1.1. Sardines
- 5.2.1.2. Mackerel
- 5.2.1.3. Tuna
- 5.2.1.4. Barracuda
- 5.2.2. Demersal Fish
- 5.2.2.1. Grouper
- 5.2.2.2. Trevally
- 5.2.2.3. Emperor
- 5.2.2.4. Pomfret
- 5.2.3. Freshwater Fish
- 5.2.3.1. Tilapia
- 5.2.4. Scallop
- 5.2.5. Shrimp
- 5.2.6. Lobsters
- 5.2.7. Caviar
- 5.2.8. Salmon
- 5.2.9. Other Types
- 5.2.1. Pelagic Fish
- 5.3. Market Analysis, Insights and Forecast - by Region
- 5.3.1. North America
- 5.3.2. South America
- 5.3.3. Europe
- 5.3.4. Middle East & Africa
- 5.3.5. Asia Pacific
- 5.1. Market Analysis, Insights and Forecast - by Type (Pr
- 6. Global UAE Aquaculture Market Analysis, Insights and Forecast, 2021-2033
- 6.1. Market Analysis, Insights and Forecast - by Type (Pr
- 6.1.1. Pelagic Fish
- 6.1.1.1. Sardines
- 6.1.1.2. Mackerel
- 6.1.1.3. Tuna
- 6.1.1.4. Barracuda
- 6.1.2. Demersal Fish
- 6.1.2.1. Grouper
- 6.1.2.2. Trevally
- 6.1.2.3. Emperor
- 6.1.2.4. Pomfret
- 6.1.3. Freshwater Fish
- 6.1.3.1. Tilapia
- 6.1.4. Scallop
- 6.1.5. Shrimp
- 6.1.6. Lobsters
- 6.1.7. Caviar
- 6.1.8. Salmon
- 6.1.9. Other Types
- 6.1.1. Pelagic Fish
- 6.2. Market Analysis, Insights and Forecast - by Type (Pr
- 6.2.1. Pelagic Fish
- 6.2.1.1. Sardines
- 6.2.1.2. Mackerel
- 6.2.1.3. Tuna
- 6.2.1.4. Barracuda
- 6.2.2. Demersal Fish
- 6.2.2.1. Grouper
- 6.2.2.2. Trevally
- 6.2.2.3. Emperor
- 6.2.2.4. Pomfret
- 6.2.3. Freshwater Fish
- 6.2.3.1. Tilapia
- 6.2.4. Scallop
- 6.2.5. Shrimp
- 6.2.6. Lobsters
- 6.2.7. Caviar
- 6.2.8. Salmon
- 6.2.9. Other Types
- 6.2.1. Pelagic Fish
- 6.1. Market Analysis, Insights and Forecast - by Type (Pr
- 7. North America UAE Aquaculture Market Analysis, Insights and Forecast, 2020-2032
- 7.1. Market Analysis, Insights and Forecast - by Type (Pr
- 7.1.1. Pelagic Fish
- 7.1.1.1. Sardines
- 7.1.1.2. Mackerel
- 7.1.1.3. Tuna
- 7.1.1.4. Barracuda
- 7.1.2. Demersal Fish
- 7.1.2.1. Grouper
- 7.1.2.2. Trevally
- 7.1.2.3. Emperor
- 7.1.2.4. Pomfret
- 7.1.3. Freshwater Fish
- 7.1.3.1. Tilapia
- 7.1.4. Scallop
- 7.1.5. Shrimp
- 7.1.6. Lobsters
- 7.1.7. Caviar
- 7.1.8. Salmon
- 7.1.9. Other Types
- 7.1.1. Pelagic Fish
- 7.2. Market Analysis, Insights and Forecast - by Type (Pr
- 7.2.1. Pelagic Fish
- 7.2.1.1. Sardines
- 7.2.1.2. Mackerel
- 7.2.1.3. Tuna
- 7.2.1.4. Barracuda
- 7.2.2. Demersal Fish
- 7.2.2.1. Grouper
- 7.2.2.2. Trevally
- 7.2.2.3. Emperor
- 7.2.2.4. Pomfret
- 7.2.3. Freshwater Fish
- 7.2.3.1. Tilapia
- 7.2.4. Scallop
- 7.2.5. Shrimp
- 7.2.6. Lobsters
- 7.2.7. Caviar
- 7.2.8. Salmon
- 7.2.9. Other Types
- 7.2.1. Pelagic Fish
- 7.1. Market Analysis, Insights and Forecast - by Type (Pr
- 8. South America UAE Aquaculture Market Analysis, Insights and Forecast, 2020-2032
- 8.1. Market Analysis, Insights and Forecast - by Type (Pr
- 8.1.1. Pelagic Fish
- 8.1.1.1. Sardines
- 8.1.1.2. Mackerel
- 8.1.1.3. Tuna
- 8.1.1.4. Barracuda
- 8.1.2. Demersal Fish
- 8.1.2.1. Grouper
- 8.1.2.2. Trevally
- 8.1.2.3. Emperor
- 8.1.2.4. Pomfret
- 8.1.3. Freshwater Fish
- 8.1.3.1. Tilapia
- 8.1.4. Scallop
- 8.1.5. Shrimp
- 8.1.6. Lobsters
- 8.1.7. Caviar
- 8.1.8. Salmon
- 8.1.9. Other Types
- 8.1.1. Pelagic Fish
- 8.2. Market Analysis, Insights and Forecast - by Type (Pr
- 8.2.1. Pelagic Fish
- 8.2.1.1. Sardines
- 8.2.1.2. Mackerel
- 8.2.1.3. Tuna
- 8.2.1.4. Barracuda
- 8.2.2. Demersal Fish
- 8.2.2.1. Grouper
- 8.2.2.2. Trevally
- 8.2.2.3. Emperor
- 8.2.2.4. Pomfret
- 8.2.3. Freshwater Fish
- 8.2.3.1. Tilapia
- 8.2.4. Scallop
- 8.2.5. Shrimp
- 8.2.6. Lobsters
- 8.2.7. Caviar
- 8.2.8. Salmon
- 8.2.9. Other Types
- 8.2.1. Pelagic Fish
- 8.1. Market Analysis, Insights and Forecast - by Type (Pr
- 9. Europe UAE Aquaculture Market Analysis, Insights and Forecast, 2020-2032
- 9.1. Market Analysis, Insights and Forecast - by Type (Pr
- 9.1.1. Pelagic Fish
- 9.1.1.1. Sardines
- 9.1.1.2. Mackerel
- 9.1.1.3. Tuna
- 9.1.1.4. Barracuda
- 9.1.2. Demersal Fish
- 9.1.2.1. Grouper
- 9.1.2.2. Trevally
- 9.1.2.3. Emperor
- 9.1.2.4. Pomfret
- 9.1.3. Freshwater Fish
- 9.1.3.1. Tilapia
- 9.1.4. Scallop
- 9.1.5. Shrimp
- 9.1.6. Lobsters
- 9.1.7. Caviar
- 9.1.8. Salmon
- 9.1.9. Other Types
- 9.1.1. Pelagic Fish
- 9.2. Market Analysis, Insights and Forecast - by Type (Pr
- 9.2.1. Pelagic Fish
- 9.2.1.1. Sardines
- 9.2.1.2. Mackerel
- 9.2.1.3. Tuna
- 9.2.1.4. Barracuda
- 9.2.2. Demersal Fish
- 9.2.2.1. Grouper
- 9.2.2.2. Trevally
- 9.2.2.3. Emperor
- 9.2.2.4. Pomfret
- 9.2.3. Freshwater Fish
- 9.2.3.1. Tilapia
- 9.2.4. Scallop
- 9.2.5. Shrimp
- 9.2.6. Lobsters
- 9.2.7. Caviar
- 9.2.8. Salmon
- 9.2.9. Other Types
- 9.2.1. Pelagic Fish
- 9.1. Market Analysis, Insights and Forecast - by Type (Pr
- 10. Middle East & Africa UAE Aquaculture Market Analysis, Insights and Forecast, 2020-2032
- 10.1. Market Analysis, Insights and Forecast - by Type (Pr
- 10.1.1. Pelagic Fish
- 10.1.1.1. Sardines
- 10.1.1.2. Mackerel
- 10.1.1.3. Tuna
- 10.1.1.4. Barracuda
- 10.1.2. Demersal Fish
- 10.1.2.1. Grouper
- 10.1.2.2. Trevally
- 10.1.2.3. Emperor
- 10.1.2.4. Pomfret
- 10.1.3. Freshwater Fish
- 10.1.3.1. Tilapia
- 10.1.4. Scallop
- 10.1.5. Shrimp
- 10.1.6. Lobsters
- 10.1.7. Caviar
- 10.1.8. Salmon
- 10.1.9. Other Types
- 10.1.1. Pelagic Fish
- 10.2. Market Analysis, Insights and Forecast - by Type (Pr
- 10.2.1. Pelagic Fish
- 10.2.1.1. Sardines
- 10.2.1.2. Mackerel
- 10.2.1.3. Tuna
- 10.2.1.4. Barracuda
- 10.2.2. Demersal Fish
- 10.2.2.1. Grouper
- 10.2.2.2. Trevally
- 10.2.2.3. Emperor
- 10.2.2.4. Pomfret
- 10.2.3. Freshwater Fish
- 10.2.3.1. Tilapia
- 10.2.4. Scallop
- 10.2.5. Shrimp
- 10.2.6. Lobsters
- 10.2.7. Caviar
- 10.2.8. Salmon
- 10.2.9. Other Types
- 10.2.1. Pelagic Fish
- 10.1. Market Analysis, Insights and Forecast - by Type (Pr
- 11. Asia Pacific UAE Aquaculture Market Analysis, Insights and Forecast, 2020-2032
- 11.1. Market Analysis, Insights and Forecast - by Type (Pr
- 11.1.1. Pelagic Fish
- 11.1.1.1. Sardines
- 11.1.1.2. Mackerel
- 11.1.1.3. Tuna
- 11.1.1.4. Barracuda
- 11.1.2. Demersal Fish
- 11.1.2.1. Grouper
- 11.1.2.2. Trevally
- 11.1.2.3. Emperor
- 11.1.2.4. Pomfret
- 11.1.3. Freshwater Fish
- 11.1.3.1. Tilapia
- 11.1.4. Scallop
- 11.1.5. Shrimp
- 11.1.6. Lobsters
- 11.1.7. Caviar
- 11.1.8. Salmon
- 11.1.9. Other Types
- 11.1.1. Pelagic Fish
- 11.2. Market Analysis, Insights and Forecast - by Type (Pr
- 11.2.1. Pelagic Fish
- 11.2.1.1. Sardines
- 11.2.1.2. Mackerel
- 11.2.1.3. Tuna
- 11.2.1.4. Barracuda
- 11.2.2. Demersal Fish
- 11.2.2.1. Grouper
- 11.2.2.2. Trevally
- 11.2.2.3. Emperor
- 11.2.2.4. Pomfret
- 11.2.3. Freshwater Fish
- 11.2.3.1. Tilapia
- 11.2.4. Scallop
- 11.2.5. Shrimp
- 11.2.6. Lobsters
- 11.2.7. Caviar
- 11.2.8. Salmon
- 11.2.9. Other Types
- 11.2.1. Pelagic Fish
- 11.1. Market Analysis, Insights and Forecast - by Type (Pr
- 12. Competitive Analysis
- 12.1. Company Profiles
- 12.1.1 Prime Aquaculture FZE
- 12.1.1.1. Company Overview
- 12.1.1.2. Products
- 12.1.1.3. Company Financials
- 12.1.1.4. SWOT Analysis
- 12.1.2 Marine Farm Ltd.
- 12.1.2.1. Company Overview
- 12.1.2.2. Products
- 12.1.2.3. Company Financials
- 12.1.2.4. SWOT Analysis
- 12.1.3 Emirates National Aquaculture LLC
- 12.1.3.1. Company Overview
- 12.1.3.2. Products
- 12.1.3.3. Company Financials
- 12.1.3.4. SWOT Analysis
- 12.1.1 Prime Aquaculture FZE
- 12.2. Market Entropy
- 12.2.1 Company's Key Areas Served
- 12.2.2 Recent Developments
- 12.3. Company Market Share Analysis 2025
- 12.3.1 Top 5 Companies Market Share Analysis
- 12.3.2 Top 3 Companies Market Share Analysis
- 12.4. List of Potential Customers
- 13. Research Methodology
List of Figures
- Figure 1: Global UAE Aquaculture Market Revenue Breakdown (Million, %) by Region 2025 & 2033
- Figure 2: North America UAE Aquaculture Market Revenue (Million), by Type (Pr 2025 & 2033
- Figure 3: North America UAE Aquaculture Market Revenue Share (%), by Type (Pr 2025 & 2033
- Figure 4: North America UAE Aquaculture Market Revenue (Million), by Type (Pr 2025 & 2033
- Figure 5: North America UAE Aquaculture Market Revenue Share (%), by Type (Pr 2025 & 2033
- Figure 6: North America UAE Aquaculture Market Revenue (Million), by Country 2025 & 2033
- Figure 7: North America UAE Aquaculture Market Revenue Share (%), by Country 2025 & 2033
- Figure 8: South America UAE Aquaculture Market Revenue (Million), by Type (Pr 2025 & 2033
- Figure 9: South America UAE Aquaculture Market Revenue Share (%), by Type (Pr 2025 & 2033
- Figure 10: South America UAE Aquaculture Market Revenue (Million), by Type (Pr 2025 & 2033
- Figure 11: South America UAE Aquaculture Market Revenue Share (%), by Type (Pr 2025 & 2033
- Figure 12: South America UAE Aquaculture Market Revenue (Million), by Country 2025 & 2033
- Figure 13: South America UAE Aquaculture Market Revenue Share (%), by Country 2025 & 2033
- Figure 14: Europe UAE Aquaculture Market Revenue (Million), by Type (Pr 2025 & 2033
- Figure 15: Europe UAE Aquaculture Market Revenue Share (%), by Type (Pr 2025 & 2033
- Figure 16: Europe UAE Aquaculture Market Revenue (Million), by Type (Pr 2025 & 2033
- Figure 17: Europe UAE Aquaculture Market Revenue Share (%), by Type (Pr 2025 & 2033
- Figure 18: Europe UAE Aquaculture Market Revenue (Million), by Country 2025 & 2033
- Figure 19: Europe UAE Aquaculture Market Revenue Share (%), by Country 2025 & 2033
- Figure 20: Middle East & Africa UAE Aquaculture Market Revenue (Million), by Type (Pr 2025 & 2033
- Figure 21: Middle East & Africa UAE Aquaculture Market Revenue Share (%), by Type (Pr 2025 & 2033
- Figure 22: Middle East & Africa UAE Aquaculture Market Revenue (Million), by Type (Pr 2025 & 2033
- Figure 23: Middle East & Africa UAE Aquaculture Market Revenue Share (%), by Type (Pr 2025 & 2033
- Figure 24: Middle East & Africa UAE Aquaculture Market Revenue (Million), by Country 2025 & 2033
- Figure 25: Middle East & Africa UAE Aquaculture Market Revenue Share (%), by Country 2025 & 2033
- Figure 26: Asia Pacific UAE Aquaculture Market Revenue (Million), by Type (Pr 2025 & 2033
- Figure 27: Asia Pacific UAE Aquaculture Market Revenue Share (%), by Type (Pr 2025 & 2033
- Figure 28: Asia Pacific UAE Aquaculture Market Revenue (Million), by Type (Pr 2025 & 2033
- Figure 29: Asia Pacific UAE Aquaculture Market Revenue Share (%), by Type (Pr 2025 & 2033
- Figure 30: Asia Pacific UAE Aquaculture Market Revenue (Million), by Country 2025 & 2033
- Figure 31: Asia Pacific UAE Aquaculture Market Revenue Share (%), by Country 2025 & 2033
List of Tables
- Table 1: Global UAE Aquaculture Market Revenue Million Forecast, by Type (Pr 2020 & 2033
- Table 2: Global UAE Aquaculture Market Revenue Million Forecast, by Type (Pr 2020 & 2033
- Table 3: Global UAE Aquaculture Market Revenue Million Forecast, by Region 2020 & 2033
- Table 4: Global UAE Aquaculture Market Revenue Million Forecast, by Type (Pr 2020 & 2033
- Table 5: Global UAE Aquaculture Market Revenue Million Forecast, by Type (Pr 2020 & 2033
- Table 6: Global UAE Aquaculture Market Revenue Million Forecast, by Country 2020 & 2033
- Table 7: United States UAE Aquaculture Market Revenue (Million) Forecast, by Application 2020 & 2033
- Table 8: Canada UAE Aquaculture Market Revenue (Million) Forecast, by Application 2020 & 2033
- Table 9: Mexico UAE Aquaculture Market Revenue (Million) Forecast, by Application 2020 & 2033
- Table 10: Global UAE Aquaculture Market Revenue Million Forecast, by Type (Pr 2020 & 2033
- Table 11: Global UAE Aquaculture Market Revenue Million Forecast, by Type (Pr 2020 & 2033
- Table 12: Global UAE Aquaculture Market Revenue Million Forecast, by Country 2020 & 2033
- Table 13: Brazil UAE Aquaculture Market Revenue (Million) Forecast, by Application 2020 & 2033
- Table 14: Argentina UAE Aquaculture Market Revenue (Million) Forecast, by Application 2020 & 2033
- Table 15: Rest of South America UAE Aquaculture Market Revenue (Million) Forecast, by Application 2020 & 2033
- Table 16: Global UAE Aquaculture Market Revenue Million Forecast, by Type (Pr 2020 & 2033
- Table 17: Global UAE Aquaculture Market Revenue Million Forecast, by Type (Pr 2020 & 2033
- Table 18: Global UAE Aquaculture Market Revenue Million Forecast, by Country 2020 & 2033
- Table 19: United Kingdom UAE Aquaculture Market Revenue (Million) Forecast, by Application 2020 & 2033
- Table 20: Germany UAE Aquaculture Market Revenue (Million) Forecast, by Application 2020 & 2033
- Table 21: France UAE Aquaculture Market Revenue (Million) Forecast, by Application 2020 & 2033
- Table 22: Italy UAE Aquaculture Market Revenue (Million) Forecast, by Application 2020 & 2033
- Table 23: Spain UAE Aquaculture Market Revenue (Million) Forecast, by Application 2020 & 2033
- Table 24: Russia UAE Aquaculture Market Revenue (Million) Forecast, by Application 2020 & 2033
- Table 25: Benelux UAE Aquaculture Market Revenue (Million) Forecast, by Application 2020 & 2033
- Table 26: Nordics UAE Aquaculture Market Revenue (Million) Forecast, by Application 2020 & 2033
- Table 27: Rest of Europe UAE Aquaculture Market Revenue (Million) Forecast, by Application 2020 & 2033
- Table 28: Global UAE Aquaculture Market Revenue Million Forecast, by Type (Pr 2020 & 2033
- Table 29: Global UAE Aquaculture Market Revenue Million Forecast, by Type (Pr 2020 & 2033
- Table 30: Global UAE Aquaculture Market Revenue Million Forecast, by Country 2020 & 2033
- Table 31: Turkey UAE Aquaculture Market Revenue (Million) Forecast, by Application 2020 & 2033
- Table 32: Israel UAE Aquaculture Market Revenue (Million) Forecast, by Application 2020 & 2033
- Table 33: GCC UAE Aquaculture Market Revenue (Million) Forecast, by Application 2020 & 2033
- Table 34: North Africa UAE Aquaculture Market Revenue (Million) Forecast, by Application 2020 & 2033
- Table 35: South Africa UAE Aquaculture Market Revenue (Million) Forecast, by Application 2020 & 2033
- Table 36: Rest of Middle East & Africa UAE Aquaculture Market Revenue (Million) Forecast, by Application 2020 & 2033
- Table 37: Global UAE Aquaculture Market Revenue Million Forecast, by Type (Pr 2020 & 2033
- Table 38: Global UAE Aquaculture Market Revenue Million Forecast, by Type (Pr 2020 & 2033
- Table 39: Global UAE Aquaculture Market Revenue Million Forecast, by Country 2020 & 2033
- Table 40: China UAE Aquaculture Market Revenue (Million) Forecast, by Application 2020 & 2033
- Table 41: India UAE Aquaculture Market Revenue (Million) Forecast, by Application 2020 & 2033
- Table 42: Japan UAE Aquaculture Market Revenue (Million) Forecast, by Application 2020 & 2033
- Table 43: South Korea UAE Aquaculture Market Revenue (Million) Forecast, by Application 2020 & 2033
- Table 44: ASEAN UAE Aquaculture Market Revenue (Million) Forecast, by Application 2020 & 2033
- Table 45: Oceania UAE Aquaculture Market Revenue (Million) Forecast, by Application 2020 & 2033
- Table 46: Rest of Asia Pacific UAE Aquaculture Market Revenue (Million) Forecast, by Application 2020 & 2033
Frequently Asked Questions
1. What is the projected Compound Annual Growth Rate (CAGR) of the UAE Aquaculture Market?
The projected CAGR is approximately 5.10%.
2. Which companies are prominent players in the UAE Aquaculture Market?
Key companies in the market include Prime Aquaculture FZE , Marine Farm Ltd., Emirates National Aquaculture LLC.
3. What are the main segments of the UAE Aquaculture Market?
The market segments include Type (Pr, Type (Pr.
4. Can you provide details about the market size?
The market size is estimated to be USD 21.82 Million as of 2022.
5. What are some drivers contributing to market growth?
Rising Consumption of Cashew Nuts in the Country; Favorable Government Initiatives.
6. What are the notable trends driving market growth?
Growing Demand for Fish and Seafood Products.
7. Are there any restraints impacting market growth?
Hazardous Climatic Condition Hinders Cashew Production; Stringent Regulations Related to Food Quality Standards.
8. Can you provide examples of recent developments in the market?
July 2022: The UAE Ministry of Climate Change and Environment partnered with Abu Dhabi National Oil company and Emirates National Oil company to provide subsidies to the fisherman to cope with the increasing cost and to boost the fisheries sector.
9. What pricing options are available for accessing the report?
Pricing options include single-user, multi-user, and enterprise licenses priced at USD 3800, USD 4500, and USD 5800 respectively.
10. Is the market size provided in terms of value or volume?
The market size is provided in terms of value, measured in Million.
11. Are there any specific market keywords associated with the report?
Yes, the market keyword associated with the report is "UAE Aquaculture Market," which aids in identifying and referencing the specific market segment covered.
12. How do I determine which pricing option suits my needs best?
The pricing options vary based on user requirements and access needs. Individual users may opt for single-user licenses, while businesses requiring broader access may choose multi-user or enterprise licenses for cost-effective access to the report.
13. Are there any additional resources or data provided in the UAE Aquaculture Market report?
While the report offers comprehensive insights, it's advisable to review the specific contents or supplementary materials provided to ascertain if additional resources or data are available.
14. How can I stay updated on further developments or reports in the UAE Aquaculture Market?
To stay informed about further developments, trends, and reports in the UAE Aquaculture Market, consider subscribing to industry newsletters, following relevant companies and organizations, or regularly checking reputable industry news sources and publications.
Methodology
Step 1 - Identification of Relevant Samples Size from Population Database


Step 2 - Approaches for Defining Global Market Size (Value, Volume* & Price*)

Note*: In applicable scenarios
Step 3 - Data Sources
Primary Research
- Web Analytics
- Survey Reports
- Research Institute
- Latest Research Reports
- Opinion Leaders
Secondary Research
- Annual Reports
- White Paper
- Latest Press Release
- Industry Association
- Paid Database
- Investor Presentations

Step 4 - Data Triangulation
Involves using different sources of information in order to increase the validity of a study
These sources are likely to be stakeholders in a program - participants, other researchers, program staff, other community members, and so on.
Then we put all data in single framework & apply various statistical tools to find out the dynamic on the market.
During the analysis stage, feedback from the stakeholder groups would be compared to determine areas of agreement as well as areas of divergence