

Key Insights
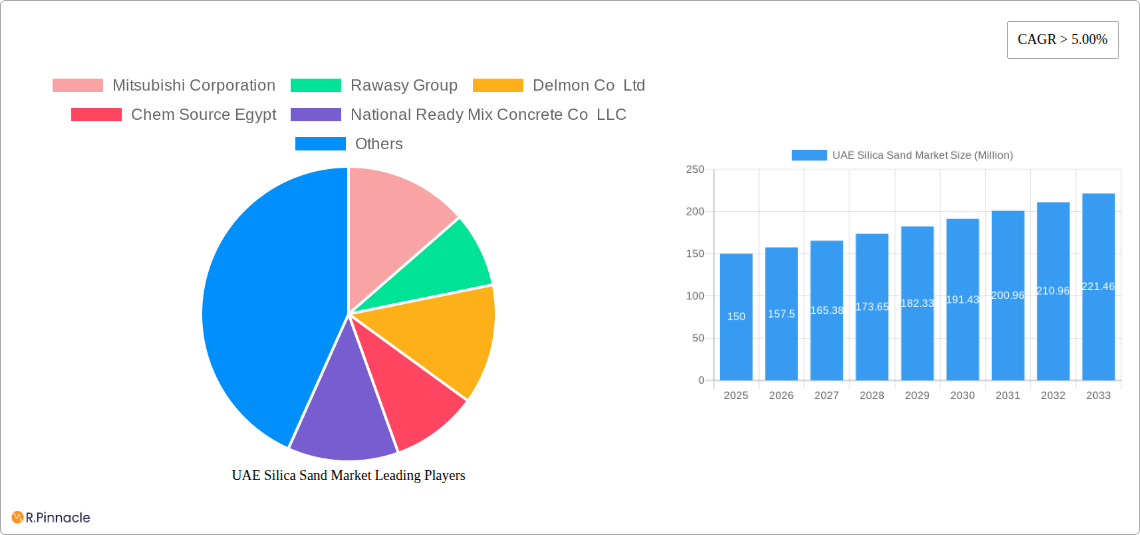
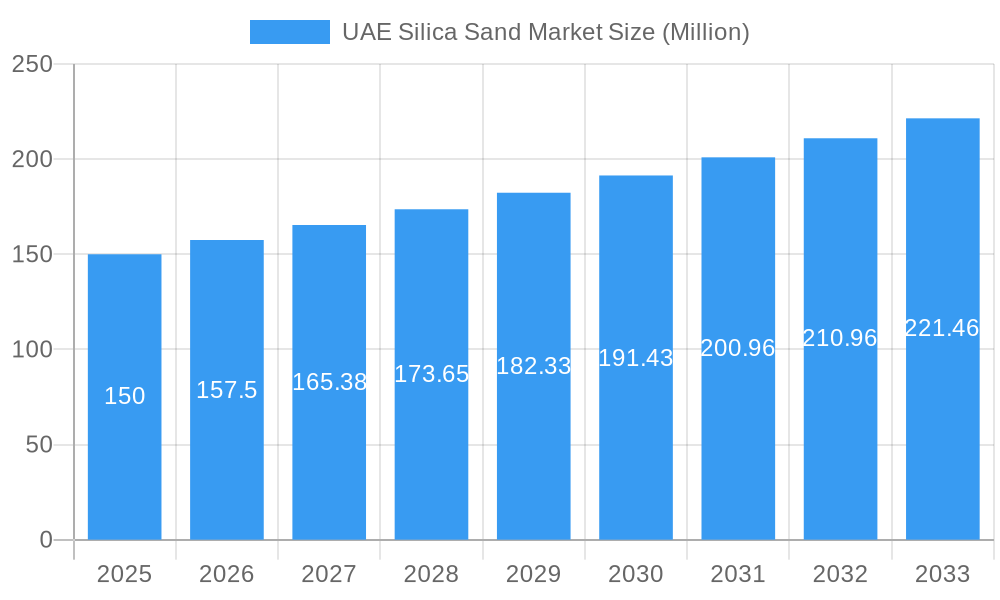
The UAE silica sand market, valued at approximately $150 million in 2025, is experiencing robust growth, projected to maintain a CAGR exceeding 5% from 2025 to 2033. This expansion is driven primarily by the construction boom fueled by large-scale infrastructure projects and real estate development within the UAE. The burgeoning glass manufacturing, chemical production, and oil and gas sectors also contribute significantly to the market's demand. Key trends include the increasing adoption of advanced silica sand processing techniques to enhance product quality and efficiency, alongside a growing focus on sustainable sourcing and environmentally friendly production methods. While competition among established players like Mitsubishi Corporation, Rawasy Group, and Delmon Co Ltd is intense, the market presents opportunities for new entrants specializing in niche applications or sustainable practices. Potential restraints include fluctuating raw material prices and stringent environmental regulations, necessitating continuous innovation and adaptation within the industry. The segmental analysis reveals that construction, glass manufacturing, and chemical production are the major consumers, driving the market's growth trajectory. The UAE's strategic geographic location and its role as a regional hub also enhance its attractiveness as a primary market for silica sand.
UAE Silica Sand Market Market Size (In Million)
The forecast period (2025-2033) anticipates continued market expansion, primarily fueled by sustained investment in infrastructure and industrial development. Growth will be particularly pronounced in segments aligned with the UAE's ambitious diversification plans, such as renewable energy and advanced manufacturing. However, maintaining a competitive edge requires companies to prioritize innovation, invest in efficient production processes, and ensure compliance with environmental standards. The market’s growth is intrinsically linked to the UAE's overall economic health and future infrastructure investments. A consistent focus on sustainability and responsible sourcing will be crucial for long-term success within this dynamic market landscape.
UAE Silica Sand Market Company Market Share
UAE Silica Sand Market: A Comprehensive Report (2019-2033)
This in-depth report provides a comprehensive analysis of the UAE Silica Sand Market, offering invaluable insights for industry professionals, investors, and strategic decision-makers. Covering the period from 2019 to 2033, with a focus on 2025, this report meticulously examines market dynamics, trends, and future prospects. The study includes detailed segmentation by end-user industry, revealing lucrative opportunities and challenges within this vital sector.
UAE Silica Sand Market Structure & Innovation Trends
The UAE silica sand market exhibits a moderately concentrated structure, with key players like Mitsubishi Corporation, Rawasy Group, and Delmon Co Ltd holding significant market share. Estimates suggest that the top five companies account for approximately xx% of the total market revenue in 2025. Innovation is driven by the increasing demand for high-purity silica sand in specialized applications, prompting investments in advanced processing technologies. The regulatory framework, while generally supportive of industrial growth, places emphasis on environmental sustainability, influencing production methods and resource management. Product substitutes, such as synthetic silica, pose a competitive challenge, albeit a limited one due to silica sand's cost-effectiveness. Market consolidation through mergers and acquisitions (M&A) is relatively low, with an estimated xx Million USD in M&A deal value recorded in the last five years. End-user demographics are characterized by a robust construction sector, a growing manufacturing base, and a burgeoning oil and gas industry.
UAE Silica Sand Market Dynamics & Trends
The UAE silica sand market is experiencing robust growth, with a projected Compound Annual Growth Rate (CAGR) of xx% during the forecast period (2025-2033). This growth is fueled by several key factors. The booming construction sector, driven by large-scale infrastructure projects and real estate development, represents a major driver. The expansion of the manufacturing and industrial sectors further fuels demand. Technological advancements in silica sand processing, improving product quality and efficiency, contribute to the market's positive trajectory. Consumer preferences increasingly lean towards sustainable and high-performance building materials, promoting the use of high-quality silica sand. Competitive dynamics are characterized by both price competition and the differentiation of products based on purity, particle size, and specialized applications. Market penetration in emerging segments such as filtration and specialized chemicals shows significant potential.
Dominant Regions & Segments in UAE Silica Sand Market
The Construction sector continues to be the powerhouse of the UAE silica sand market, exhibiting the highest consumption volumes. This dominance is primarily attributed to a confluence of powerful growth stimulants:
- Sustained Government Investment in Infrastructure: The UAE's ambitious vision for the future is heavily reliant on massive infrastructure projects. This includes the continuous expansion and modernization of transportation networks, the development of entirely new urban centers, and the ongoing enhancement of utilities, all of which necessitate substantial quantities of silica sand.
- Thriving Real Estate Sector: The dynamic and expanding real estate market in the UAE, characterized by the construction of both aspirational residential communities and state-of-the-art commercial and industrial spaces, directly translates into a significant and consistent demand for construction-grade silica sand.
- Pro-Investment Economic Policies: The UAE government's proactive economic policies, which actively encourage both domestic and foreign investment in infrastructure development and the construction industry, create a fertile ground for market expansion and increased silica sand utilization.
Geographically, detailed market analysis confirms that the Northern Emirates currently command the largest market share. This prominent position is a direct consequence of the high concentration of both active construction projects and vital industrial operations within these regions.
UAE Silica Sand Market Product Innovations
Recent product innovations focus on enhancing silica sand purity and creating specialized grades for high-value applications. This includes the development of advanced processing techniques for removing impurities and producing precisely sized particles for specific uses. Technological advancements in beneficiation and surface modification offer competitive advantages in terms of cost-effectiveness, performance, and environmental sustainability. The market is witnessing an increasing demand for high-purity silica sand in specialized applications, including microelectronics and solar energy, driving further product innovation.
Report Scope & Segmentation Analysis
This report segments the UAE silica sand market by end-user industry:
- Glass Manufacturing: The glass industry demands high-purity silica sand for enhanced transparency and durability, projecting xx Million USD in market size by 2033.
- Foundry: Used as a molding material, this segment projects a market size of xx Million USD by 2033.
- Chemical Production: Silica sand is essential in various chemical processes and shows a projected market size of xx Million USD by 2033.
- Construction: The largest segment, driven by infrastructure development, showing a projected market size of xx Million USD by 2033.
- Paints and Coatings: Used as a filler and extender, with a projected market size of xx Million USD by 2033.
- Ceramics and Refractories: Essential for the high-temperature applications, this segment projects a market size of xx Million USD by 2033.
- Filtration: This specialized application projects a market size of xx Million USD by 2033.
- Oil and Gas: Used in various oil and gas operations, projecting a market size of xx Million USD by 2033.
- Other End-user Industries: This category encompasses various minor applications, with a projected market size of xx Million USD by 2033.
Key Drivers of UAE Silica Sand Market Growth
The UAE silica sand market is experiencing robust expansion, propelled by several interconnected drivers. Foremost among these is the unwavering commitment to infrastructure development, a strategic priority supported by substantial government funding and increasing private sector investment. This translates into a perpetual demand for high-quality construction materials. Complementing this, the UAE's ever-expanding industrial and manufacturing base, encompassing critical sectors such as construction materials, chemicals, and glass production, consistently elevates the consumption of silica sand. Furthermore, the market is energized by continuous product innovation. This includes the development of higher-purity grades and specialized silica sand formulations tailored for niche and high-performance applications, thereby opening up new and lucrative market avenues.
Challenges in the UAE Silica Sand Market Sector
The UAE silica sand market faces some challenges. Maintaining a sustainable supply chain, balancing the need for high-volume production with environmental considerations, and mitigating the effects of fluctuating global commodity prices pose considerable hurdles. Competition from international suppliers and ensuring sufficient reserves of high-quality silica sand also present considerable challenges. The implementation of stringent environmental regulations and the potential for increased transportation costs pose further risks.
Emerging Opportunities in UAE Silica Sand Market
The UAE silica sand market presents several promising opportunities. Growing demand for high-purity silica sand in specialized applications, such as solar energy and microelectronics, offers potential for expansion. The exploration of sustainable mining and processing techniques, focusing on environmental responsibility, presents opportunities to cater to environmentally conscious consumers and industries. Further developing value-added silica sand products with improved functionalities, for example, nano-silica, will open lucrative market niches.
Leading Players in the UAE Silica Sand Market Market
- Mitsubishi Corporation
- Rawasy Group
- Delmon Co Ltd
- Chem Source Egypt
- National Ready Mix Concrete Co LLC
- Adwan Chemical Industries Co Ltd
- Cairo Minerals
- Speciality Industries LLC
- Gulf Minerals
- Majd Al Muayad
Key Developments in UAE Silica Sand Market Industry
- 2022 Q3: Rawasy Group announced a new investment in advanced silica sand processing technology.
- 2021 Q4: Delmon Co Ltd launched a new line of high-purity silica sand for the solar energy industry.
- 2020 Q2: Mitsubishi Corporation secured a long-term supply contract with a major construction company.
- (Add more developments as available)
Future Outlook for UAE Silica Sand Market Market
The future of the UAE silica sand market is bright. Sustained growth is expected, driven by ongoing infrastructure development, industrial expansion, and innovation in both the production and utilization of silica sand. Strategic partnerships, investments in sustainable mining practices, and the development of value-added products will be crucial for long-term success in this dynamic market. The focus on high-value applications and specialized grades of silica sand will shape the market's future trajectory.
UAE Silica Sand Market Segmentation
-
1. End-user Industry
- 1.1. Glass Manufacturing
- 1.2. Foundry
- 1.3. Chemical Production
- 1.4. Construction
- 1.5. Paints and Coatings
- 1.6. Ceramics and Refractories
- 1.7. Filtration
- 1.8. Oil and Gas
- 1.9. Other End-user Industries
UAE Silica Sand Market Segmentation By Geography
-
1. North America
- 1.1. United States
- 1.2. Canada
- 1.3. Mexico
-
2. South America
- 2.1. Brazil
- 2.2. Argentina
- 2.3. Rest of South America
-
3. Europe
- 3.1. United Kingdom
- 3.2. Germany
- 3.3. France
- 3.4. Italy
- 3.5. Spain
- 3.6. Russia
- 3.7. Benelux
- 3.8. Nordics
- 3.9. Rest of Europe
-
4. Middle East & Africa
- 4.1. Turkey
- 4.2. Israel
- 4.3. GCC
- 4.4. North Africa
- 4.5. South Africa
- 4.6. Rest of Middle East & Africa
-
5. Asia Pacific
- 5.1. China
- 5.2. India
- 5.3. Japan
- 5.4. South Korea
- 5.5. ASEAN
- 5.6. Oceania
- 5.7. Rest of Asia Pacific
UAE Silica Sand Market Regional Market Share
Geographic Coverage of UAE Silica Sand Market
UAE Silica Sand Market REPORT HIGHLIGHTS
| Aspects | Details |
|---|---|
| Study Period | 2020-2034 |
| Base Year | 2025 |
| Estimated Year | 2026 |
| Forecast Period | 2026-2034 |
| Historical Period | 2020-2025 |
| Growth Rate | CAGR of 7.7% from 2020-2034 |
| Segmentation |
|
Table of Contents
- 1. Introduction
- 1.1. Research Scope
- 1.2. Market Segmentation
- 1.3. Research Objective
- 1.4. Definitions and Assumptions
- 2. Executive Summary
- 2.1. Market Snapshot
- 3. Market Dynamics
- 3.1. Market Drivers
- 3.2. Market Restrains
- 3.3. Market Trends
- 3.4. Market Opportunities
- 4. Market Factor Analysis
- 4.1. Porters Five Forces
- 4.1.1. Bargaining Power of Suppliers
- 4.1.2. Bargaining Power of Buyers
- 4.1.3. Threat of New Entrants
- 4.1.4. Threat of Substitutes
- 4.1.5. Competitive Rivalry
- 4.2. PESTEL analysis
- 4.3. BCG Analysis
- 4.3.1. Stars (High Growth, High Market Share)
- 4.3.2. Cash Cows (Low Growth, High Market Share)
- 4.3.3. Question Mark (High Growth, Low Market Share)
- 4.3.4. Dogs (Low Growth, Low Market Share)
- 4.4. Ansoff Matrix Analysis
- 4.5. Supply Chain Analysis
- 4.6. Regulatory Landscape
- 4.7. Current Market Potential and Opportunity Assessment (TAM–SAM–SOM Framework)
- 4.8. PRI Analyst Note
- 4.1. Porters Five Forces
- 5. Market Analysis, Insights and Forecast 2021-2033
- 5.1. Market Analysis, Insights and Forecast - by End-user Industry
- 5.1.1. Glass Manufacturing
- 5.1.2. Foundry
- 5.1.3. Chemical Production
- 5.1.4. Construction
- 5.1.5. Paints and Coatings
- 5.1.6. Ceramics and Refractories
- 5.1.7. Filtration
- 5.1.8. Oil and Gas
- 5.1.9. Other End-user Industries
- 5.2. Market Analysis, Insights and Forecast - by Region
- 5.2.1. North America
- 5.2.2. South America
- 5.2.3. Europe
- 5.2.4. Middle East & Africa
- 5.2.5. Asia Pacific
- 5.1. Market Analysis, Insights and Forecast - by End-user Industry
- 6. Global UAE Silica Sand Market Analysis, Insights and Forecast, 2021-2033
- 6.1. Market Analysis, Insights and Forecast - by End-user Industry
- 6.1.1. Glass Manufacturing
- 6.1.2. Foundry
- 6.1.3. Chemical Production
- 6.1.4. Construction
- 6.1.5. Paints and Coatings
- 6.1.6. Ceramics and Refractories
- 6.1.7. Filtration
- 6.1.8. Oil and Gas
- 6.1.9. Other End-user Industries
- 6.1. Market Analysis, Insights and Forecast - by End-user Industry
- 7. North America UAE Silica Sand Market Analysis, Insights and Forecast, 2020-2032
- 7.1. Market Analysis, Insights and Forecast - by End-user Industry
- 7.1.1. Glass Manufacturing
- 7.1.2. Foundry
- 7.1.3. Chemical Production
- 7.1.4. Construction
- 7.1.5. Paints and Coatings
- 7.1.6. Ceramics and Refractories
- 7.1.7. Filtration
- 7.1.8. Oil and Gas
- 7.1.9. Other End-user Industries
- 7.1. Market Analysis, Insights and Forecast - by End-user Industry
- 8. South America UAE Silica Sand Market Analysis, Insights and Forecast, 2020-2032
- 8.1. Market Analysis, Insights and Forecast - by End-user Industry
- 8.1.1. Glass Manufacturing
- 8.1.2. Foundry
- 8.1.3. Chemical Production
- 8.1.4. Construction
- 8.1.5. Paints and Coatings
- 8.1.6. Ceramics and Refractories
- 8.1.7. Filtration
- 8.1.8. Oil and Gas
- 8.1.9. Other End-user Industries
- 8.1. Market Analysis, Insights and Forecast - by End-user Industry
- 9. Europe UAE Silica Sand Market Analysis, Insights and Forecast, 2020-2032
- 9.1. Market Analysis, Insights and Forecast - by End-user Industry
- 9.1.1. Glass Manufacturing
- 9.1.2. Foundry
- 9.1.3. Chemical Production
- 9.1.4. Construction
- 9.1.5. Paints and Coatings
- 9.1.6. Ceramics and Refractories
- 9.1.7. Filtration
- 9.1.8. Oil and Gas
- 9.1.9. Other End-user Industries
- 9.1. Market Analysis, Insights and Forecast - by End-user Industry
- 10. Middle East & Africa UAE Silica Sand Market Analysis, Insights and Forecast, 2020-2032
- 10.1. Market Analysis, Insights and Forecast - by End-user Industry
- 10.1.1. Glass Manufacturing
- 10.1.2. Foundry
- 10.1.3. Chemical Production
- 10.1.4. Construction
- 10.1.5. Paints and Coatings
- 10.1.6. Ceramics and Refractories
- 10.1.7. Filtration
- 10.1.8. Oil and Gas
- 10.1.9. Other End-user Industries
- 10.1. Market Analysis, Insights and Forecast - by End-user Industry
- 11. Asia Pacific UAE Silica Sand Market Analysis, Insights and Forecast, 2020-2032
- 11.1. Market Analysis, Insights and Forecast - by End-user Industry
- 11.1.1. Glass Manufacturing
- 11.1.2. Foundry
- 11.1.3. Chemical Production
- 11.1.4. Construction
- 11.1.5. Paints and Coatings
- 11.1.6. Ceramics and Refractories
- 11.1.7. Filtration
- 11.1.8. Oil and Gas
- 11.1.9. Other End-user Industries
- 11.1. Market Analysis, Insights and Forecast - by End-user Industry
- 12. Competitive Analysis
- 12.1. Company Profiles
- 12.1.1 Mitsubishi Corporation
- 12.1.1.1. Company Overview
- 12.1.1.2. Products
- 12.1.1.3. Company Financials
- 12.1.1.4. SWOT Analysis
- 12.1.2 Rawasy Group
- 12.1.2.1. Company Overview
- 12.1.2.2. Products
- 12.1.2.3. Company Financials
- 12.1.2.4. SWOT Analysis
- 12.1.3 Delmon Co Ltd
- 12.1.3.1. Company Overview
- 12.1.3.2. Products
- 12.1.3.3. Company Financials
- 12.1.3.4. SWOT Analysis
- 12.1.4 Chem Source Egypt
- 12.1.4.1. Company Overview
- 12.1.4.2. Products
- 12.1.4.3. Company Financials
- 12.1.4.4. SWOT Analysis
- 12.1.5 National Ready Mix Concrete Co LLC
- 12.1.5.1. Company Overview
- 12.1.5.2. Products
- 12.1.5.3. Company Financials
- 12.1.5.4. SWOT Analysis
- 12.1.6 Adwan Chemical Industries Co Ltd
- 12.1.6.1. Company Overview
- 12.1.6.2. Products
- 12.1.6.3. Company Financials
- 12.1.6.4. SWOT Analysis
- 12.1.7 Cairo Minerals
- 12.1.7.1. Company Overview
- 12.1.7.2. Products
- 12.1.7.3. Company Financials
- 12.1.7.4. SWOT Analysis
- 12.1.8 Speciality Industries LLC*List Not Exhaustive
- 12.1.8.1. Company Overview
- 12.1.8.2. Products
- 12.1.8.3. Company Financials
- 12.1.8.4. SWOT Analysis
- 12.1.9 Gulf Minerals
- 12.1.9.1. Company Overview
- 12.1.9.2. Products
- 12.1.9.3. Company Financials
- 12.1.9.4. SWOT Analysis
- 12.1.10 Majd Al Muayad
- 12.1.10.1. Company Overview
- 12.1.10.2. Products
- 12.1.10.3. Company Financials
- 12.1.10.4. SWOT Analysis
- 12.1.1 Mitsubishi Corporation
- 12.2. Market Entropy
- 12.2.1 Company's Key Areas Served
- 12.2.2 Recent Developments
- 12.3. Company Market Share Analysis 2025
- 12.3.1 Top 5 Companies Market Share Analysis
- 12.3.2 Top 3 Companies Market Share Analysis
- 12.4. List of Potential Customers
- 13. Research Methodology
List of Figures
- Figure 1: Global UAE Silica Sand Market Revenue Breakdown (billion, %) by Region 2025 & 2033
- Figure 2: North America UAE Silica Sand Market Revenue (billion), by End-user Industry 2025 & 2033
- Figure 3: North America UAE Silica Sand Market Revenue Share (%), by End-user Industry 2025 & 2033
- Figure 4: North America UAE Silica Sand Market Revenue (billion), by Country 2025 & 2033
- Figure 5: North America UAE Silica Sand Market Revenue Share (%), by Country 2025 & 2033
- Figure 6: South America UAE Silica Sand Market Revenue (billion), by End-user Industry 2025 & 2033
- Figure 7: South America UAE Silica Sand Market Revenue Share (%), by End-user Industry 2025 & 2033
- Figure 8: South America UAE Silica Sand Market Revenue (billion), by Country 2025 & 2033
- Figure 9: South America UAE Silica Sand Market Revenue Share (%), by Country 2025 & 2033
- Figure 10: Europe UAE Silica Sand Market Revenue (billion), by End-user Industry 2025 & 2033
- Figure 11: Europe UAE Silica Sand Market Revenue Share (%), by End-user Industry 2025 & 2033
- Figure 12: Europe UAE Silica Sand Market Revenue (billion), by Country 2025 & 2033
- Figure 13: Europe UAE Silica Sand Market Revenue Share (%), by Country 2025 & 2033
- Figure 14: Middle East & Africa UAE Silica Sand Market Revenue (billion), by End-user Industry 2025 & 2033
- Figure 15: Middle East & Africa UAE Silica Sand Market Revenue Share (%), by End-user Industry 2025 & 2033
- Figure 16: Middle East & Africa UAE Silica Sand Market Revenue (billion), by Country 2025 & 2033
- Figure 17: Middle East & Africa UAE Silica Sand Market Revenue Share (%), by Country 2025 & 2033
- Figure 18: Asia Pacific UAE Silica Sand Market Revenue (billion), by End-user Industry 2025 & 2033
- Figure 19: Asia Pacific UAE Silica Sand Market Revenue Share (%), by End-user Industry 2025 & 2033
- Figure 20: Asia Pacific UAE Silica Sand Market Revenue (billion), by Country 2025 & 2033
- Figure 21: Asia Pacific UAE Silica Sand Market Revenue Share (%), by Country 2025 & 2033
List of Tables
- Table 1: Global UAE Silica Sand Market Revenue billion Forecast, by End-user Industry 2020 & 2033
- Table 2: Global UAE Silica Sand Market Revenue billion Forecast, by Region 2020 & 2033
- Table 3: Global UAE Silica Sand Market Revenue billion Forecast, by End-user Industry 2020 & 2033
- Table 4: Global UAE Silica Sand Market Revenue billion Forecast, by Country 2020 & 2033
- Table 5: United States UAE Silica Sand Market Revenue (billion) Forecast, by Application 2020 & 2033
- Table 6: Canada UAE Silica Sand Market Revenue (billion) Forecast, by Application 2020 & 2033
- Table 7: Mexico UAE Silica Sand Market Revenue (billion) Forecast, by Application 2020 & 2033
- Table 8: Global UAE Silica Sand Market Revenue billion Forecast, by End-user Industry 2020 & 2033
- Table 9: Global UAE Silica Sand Market Revenue billion Forecast, by Country 2020 & 2033
- Table 10: Brazil UAE Silica Sand Market Revenue (billion) Forecast, by Application 2020 & 2033
- Table 11: Argentina UAE Silica Sand Market Revenue (billion) Forecast, by Application 2020 & 2033
- Table 12: Rest of South America UAE Silica Sand Market Revenue (billion) Forecast, by Application 2020 & 2033
- Table 13: Global UAE Silica Sand Market Revenue billion Forecast, by End-user Industry 2020 & 2033
- Table 14: Global UAE Silica Sand Market Revenue billion Forecast, by Country 2020 & 2033
- Table 15: United Kingdom UAE Silica Sand Market Revenue (billion) Forecast, by Application 2020 & 2033
- Table 16: Germany UAE Silica Sand Market Revenue (billion) Forecast, by Application 2020 & 2033
- Table 17: France UAE Silica Sand Market Revenue (billion) Forecast, by Application 2020 & 2033
- Table 18: Italy UAE Silica Sand Market Revenue (billion) Forecast, by Application 2020 & 2033
- Table 19: Spain UAE Silica Sand Market Revenue (billion) Forecast, by Application 2020 & 2033
- Table 20: Russia UAE Silica Sand Market Revenue (billion) Forecast, by Application 2020 & 2033
- Table 21: Benelux UAE Silica Sand Market Revenue (billion) Forecast, by Application 2020 & 2033
- Table 22: Nordics UAE Silica Sand Market Revenue (billion) Forecast, by Application 2020 & 2033
- Table 23: Rest of Europe UAE Silica Sand Market Revenue (billion) Forecast, by Application 2020 & 2033
- Table 24: Global UAE Silica Sand Market Revenue billion Forecast, by End-user Industry 2020 & 2033
- Table 25: Global UAE Silica Sand Market Revenue billion Forecast, by Country 2020 & 2033
- Table 26: Turkey UAE Silica Sand Market Revenue (billion) Forecast, by Application 2020 & 2033
- Table 27: Israel UAE Silica Sand Market Revenue (billion) Forecast, by Application 2020 & 2033
- Table 28: GCC UAE Silica Sand Market Revenue (billion) Forecast, by Application 2020 & 2033
- Table 29: North Africa UAE Silica Sand Market Revenue (billion) Forecast, by Application 2020 & 2033
- Table 30: South Africa UAE Silica Sand Market Revenue (billion) Forecast, by Application 2020 & 2033
- Table 31: Rest of Middle East & Africa UAE Silica Sand Market Revenue (billion) Forecast, by Application 2020 & 2033
- Table 32: Global UAE Silica Sand Market Revenue billion Forecast, by End-user Industry 2020 & 2033
- Table 33: Global UAE Silica Sand Market Revenue billion Forecast, by Country 2020 & 2033
- Table 34: China UAE Silica Sand Market Revenue (billion) Forecast, by Application 2020 & 2033
- Table 35: India UAE Silica Sand Market Revenue (billion) Forecast, by Application 2020 & 2033
- Table 36: Japan UAE Silica Sand Market Revenue (billion) Forecast, by Application 2020 & 2033
- Table 37: South Korea UAE Silica Sand Market Revenue (billion) Forecast, by Application 2020 & 2033
- Table 38: ASEAN UAE Silica Sand Market Revenue (billion) Forecast, by Application 2020 & 2033
- Table 39: Oceania UAE Silica Sand Market Revenue (billion) Forecast, by Application 2020 & 2033
- Table 40: Rest of Asia Pacific UAE Silica Sand Market Revenue (billion) Forecast, by Application 2020 & 2033
Frequently Asked Questions
1. What is the projected Compound Annual Growth Rate (CAGR) of the UAE Silica Sand Market?
The projected CAGR is approximately 7.7%.
2. Which companies are prominent players in the UAE Silica Sand Market?
Key companies in the market include Mitsubishi Corporation, Rawasy Group, Delmon Co Ltd, Chem Source Egypt, National Ready Mix Concrete Co LLC, Adwan Chemical Industries Co Ltd, Cairo Minerals, Speciality Industries LLC*List Not Exhaustive, Gulf Minerals, Majd Al Muayad.
3. What are the main segments of the UAE Silica Sand Market?
The market segments include End-user Industry.
4. Can you provide details about the market size?
The market size is estimated to be USD 14.1 billion as of 2022.
5. What are some drivers contributing to market growth?
Growing Land Reclamation Projects Across the Region.
6. What are the notable trends driving market growth?
Growing Land Reclamation to Drive Demand for Silica Sand.
7. Are there any restraints impacting market growth?
Competition from Various Substitutes; Development of Sand-Free Construction Products.
8. Can you provide examples of recent developments in the market?
N/A
9. What pricing options are available for accessing the report?
Pricing options include single-user, multi-user, and enterprise licenses priced at USD 3800, USD 4500, and USD 5800 respectively.
10. Is the market size provided in terms of value or volume?
The market size is provided in terms of value, measured in billion.
11. Are there any specific market keywords associated with the report?
Yes, the market keyword associated with the report is "UAE Silica Sand Market," which aids in identifying and referencing the specific market segment covered.
12. How do I determine which pricing option suits my needs best?
The pricing options vary based on user requirements and access needs. Individual users may opt for single-user licenses, while businesses requiring broader access may choose multi-user or enterprise licenses for cost-effective access to the report.
13. Are there any additional resources or data provided in the UAE Silica Sand Market report?
While the report offers comprehensive insights, it's advisable to review the specific contents or supplementary materials provided to ascertain if additional resources or data are available.
14. How can I stay updated on further developments or reports in the UAE Silica Sand Market?
To stay informed about further developments, trends, and reports in the UAE Silica Sand Market, consider subscribing to industry newsletters, following relevant companies and organizations, or regularly checking reputable industry news sources and publications.
Methodology
Step 1 - Identification of Relevant Samples Size from Population Database


Step 2 - Approaches for Defining Global Market Size (Value, Volume* & Price*)

Note*: In applicable scenarios
Step 3 - Data Sources
Primary Research
- Web Analytics
- Survey Reports
- Research Institute
- Latest Research Reports
- Opinion Leaders
Secondary Research
- Annual Reports
- White Paper
- Latest Press Release
- Industry Association
- Paid Database
- Investor Presentations

Step 4 - Data Triangulation
Involves using different sources of information in order to increase the validity of a study
These sources are likely to be stakeholders in a program - participants, other researchers, program staff, other community members, and so on.
Then we put all data in single framework & apply various statistical tools to find out the dynamic on the market.
During the analysis stage, feedback from the stakeholder groups would be compared to determine areas of agreement as well as areas of divergence