

Key Insights
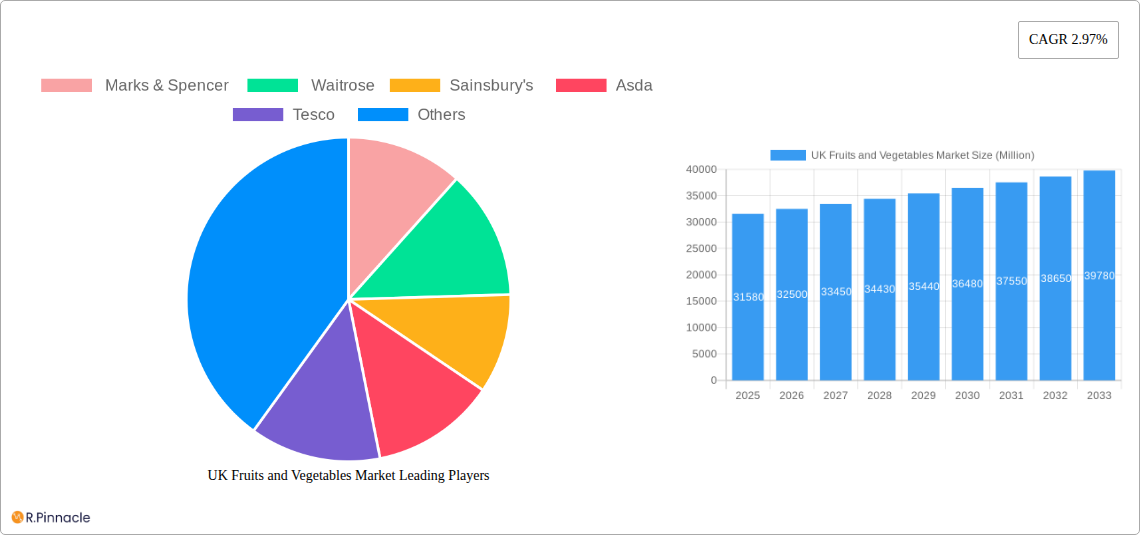
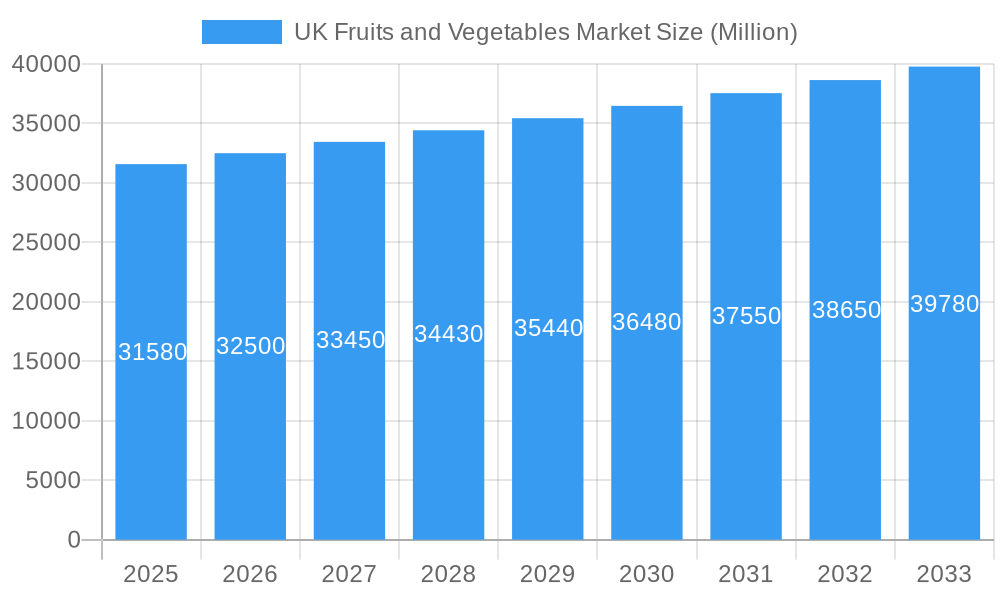
The UK fruits and vegetables market, valued at £31.58 billion in 2025, is projected to experience steady growth, driven by increasing consumer health consciousness and a rising preference for fresh produce. This growth, estimated at a compound annual growth rate (CAGR) of 2.97%, is expected to continue through 2033, reaching a significant market size. Key market drivers include the growing popularity of plant-based diets, increasing awareness of the health benefits associated with fruit and vegetable consumption, and the rising demand for convenient and ready-to-eat options. Major supermarket chains like Tesco, Sainsbury's, Asda, Waitrose, and Marks & Spencer dominate the market, leveraging their extensive distribution networks and established brand recognition. While the market faces potential restraints such as seasonal price fluctuations and potential supply chain disruptions, the ongoing trend towards healthier lifestyles and government initiatives promoting fruit and vegetable consumption are expected to offset these challenges. The market is segmented into fruits and vegetables, with detailed analysis including production, consumption, import/export volumes and values, and price trends for each segment across England, Wales, Scotland, and Northern Ireland. This comprehensive market overview considers historical data from 2019-2024 and provides a robust forecast for 2025-2033.
UK Fruits and Vegetables Market Market Size (In Billion)
The segmentation within the UK fruits and vegetables market reveals valuable insights into consumer preferences and regional variations. For instance, the consumption analysis could reveal significant differences in preferred fruit and vegetable types across different regions of the UK, influencing production and import/export strategies. Price trend analysis is crucial for understanding market volatility and identifying opportunities for optimization within the supply chain. The dominance of major supermarket chains highlights the importance of strong retail partnerships and effective distribution strategies for success in this market. Furthermore, future growth will likely be shaped by innovation in packaging, the expansion of online grocery delivery services, and the increasing availability of sustainably sourced produce. A clear understanding of these factors is essential for businesses seeking to capitalize on the growth opportunities within the UK fruits and vegetables market.
UK Fruits and Vegetables Market Company Market Share
UK Fruits and Vegetables Market Report: 2019-2033
This comprehensive report provides a detailed analysis of the UK fruits and vegetables market, offering invaluable insights for industry professionals, investors, and strategic decision-makers. Covering the period from 2019 to 2033, with a base year of 2025, this report unveils the market's dynamics, growth drivers, challenges, and future outlook. The analysis includes detailed segmentation across fruits and vegetables, encompassing production, consumption, import/export, and price trends. Leading players like Marks & Spencer, Waitrose, Sainsbury's, Asda, and Tesco are profiled, highlighting their market strategies and contributions.
UK Fruits and Vegetables Market Structure & Innovation Trends
This section analyzes the UK fruits and vegetables market structure, encompassing market concentration, innovation drivers, regulatory frameworks, product substitutes, end-user demographics, and M&A activities. We examine the market share held by key players such as Tesco, Sainsbury's, and Marks & Spencer, and delve into the impact of recent mergers and acquisitions (M&A) deals, estimating their total value at approximately £XX Million. The report explores the influence of regulatory frameworks like food safety standards and environmental regulations on market dynamics, analyzing the impact of substitutes such as frozen and processed alternatives. The evolving demographics of consumers and their changing preferences for organic, locally sourced produce are also detailed.
UK Fruits and Vegetables Market Dynamics & Trends
This section explores the key dynamics shaping the UK fruits and vegetables market. We project a Compound Annual Growth Rate (CAGR) of XX% during the forecast period (2025-2033), driven by factors such as rising health consciousness, increasing disposable incomes, and the growing popularity of plant-based diets. Technological disruptions, including advancements in farming techniques, packaging, and supply chain management, are analyzed for their influence on market penetration and efficiency. The changing consumer preferences towards convenience, sustainability, and ethical sourcing, along with the competitive landscape and strategies employed by major players, are also discussed in detail.
Dominant Regions & Segments in UK Fruits and Vegetables Market
This section identifies the leading regions and segments within the UK fruits and vegetables market. Analysis includes detailed breakdowns of production, consumption, import, and export volumes and values for both fruits and vegetables, highlighting regional variations and key factors driving dominance.
Fruits:
- Production: Analysis reveals that [Region Name] is the leading region for fruit production, driven by factors such as [specific driver, e.g., favorable climate conditions].
- Consumption: [Region Name] leads in fruit consumption, driven by factors such as [specific driver, e.g., higher per capita income].
- Import/Export: The UK's import of [specific fruits] from [country name] is significant, while export of [specific fruits] is largely to [country name], due to [specific factors].
- Price Trend Analysis: Fluctuations in the price of [specific fruit] are influenced by [specific factor, e.g., seasonal availability, import costs].
Vegetables:
- Production: [Region Name] dominates vegetable production due to [specific factors].
- Consumption: Consumption patterns show [Region Name] as a key market.
- Import/Export: Import and export patterns are analyzed, identifying key trading partners and product categories.
- Price Trend Analysis: Price trends for key vegetables are analyzed, showing influences of [specific factors].
UK Fruits and Vegetables Market Product Innovations
The UK fruits and vegetables market is witnessing significant product innovation, driven by consumer demand for healthier, more convenient options. This includes the rise of pre-cut vegetables, ready-to-eat salads, and organic produce, along with novel packaging solutions that extend shelf life and reduce food waste. Technological advancements in hydroponics and vertical farming are also contributing to increased efficiency and sustainability in production. These innovations are improving market fit by offering convenience and addressing consumer health and environmental concerns.
Report Scope & Segmentation Analysis
This report provides a detailed segmentation of the UK fruits and vegetables market, analyzing production, consumption, import, export, and price trends for both fruits and vegetables. Each segment's growth projections, market sizes, and competitive dynamics are explored in detail. The analysis provides a thorough understanding of the market's structure and potential. For example, the consumption analysis of apples is broken down by type (e.g., Gala, Braeburn), providing insights into consumer preferences and market size for each sub-segment. This comprehensive segmentation allows for a granular understanding of market dynamics and opportunities within each category.
Key Drivers of UK Fruits and Vegetables Market Growth
Several key drivers fuel the growth of the UK fruits and vegetables market. These include the increasing awareness of the health benefits of consuming fruits and vegetables, coupled with rising disposable incomes enabling consumers to spend more on premium products. Government initiatives promoting healthy eating and sustainable agriculture are also significant factors. Furthermore, technological advancements in farming, packaging and distribution are boosting efficiency and reducing waste.
Challenges in the UK Fruits and Vegetables Market Sector
The UK fruits and vegetables market faces various challenges, including fluctuating prices due to seasonality and global supply chain disruptions. Regulatory hurdles regarding food safety and labeling, along with the increasing competition from imported produce and substitutes, also impact market growth. Labor shortages in the agricultural sector further constrain production capabilities, leading to price increases and potential supply gaps. These challenges impact profitability and market stability.
Emerging Opportunities in UK Fruits and Vegetables Market
Despite challenges, numerous opportunities exist in the UK fruits and vegetables market. The growing demand for organic and locally sourced produce presents significant potential. Furthermore, the increasing interest in plant-based diets and functional foods provides avenues for new product development and market expansion. Technological advancements in hydroponics and vertical farming offer solutions to space constraints and enhance efficiency and sustainability. These opportunities allow for market expansion and innovation.
Leading Players in the UK Fruits and Vegetables Market Market
Key Developments in UK Fruits and Vegetables Market Industry
- January 2023: Tesco launches a new range of sustainably sourced vegetables.
- March 2022: Sainsbury's invests in advanced farming technology to improve yields.
- June 2021: Marks & Spencer partners with local farmers to promote regional produce.
- September 2020: Asda introduces a new packaging solution to reduce food waste.
Future Outlook for UK Fruits and Vegetables Market Market
The future outlook for the UK fruits and vegetables market is positive, driven by continued growth in consumer demand for healthy and convenient options. Technological advancements will improve efficiency and sustainability across the value chain. The increasing focus on ethical and sustainable sourcing will further shape market dynamics, presenting opportunities for businesses that prioritize environmental responsibility and consumer values. Strategic partnerships and investments in innovative farming technologies will be crucial for sustained success in this dynamic market.
UK Fruits and Vegetables Market Segmentation
-
1. Fruits
- 1.1. Production Analysis (Volume)
- 1.2. Consumption Analysis (Volume and Value)
- 1.3. Import Analysis (Volume and Value)
- 1.4. Export Analysis (Volume and Value)
- 1.5. Price Trend Analysis
-
2. Vegetables
- 2.1. Production Analysis (Volume)
- 2.2. Consumption Analysis (Volume and Value)
- 2.3. Import Analysis (Volume and Value)
- 2.4. Export Analysis (Volume and Value)
- 2.5. Price Trend Analysis
-
3. Fruits
- 3.1. Production Analysis (Volume)
- 3.2. Consumption Analysis (Volume and Value)
- 3.3. Import Analysis (Volume and Value)
- 3.4. Export Analysis (Volume and Value)
- 3.5. Price Trend Analysis
-
4. Vegetables
- 4.1. Production Analysis (Volume)
- 4.2. Consumption Analysis (Volume and Value)
- 4.3. Import Analysis (Volume and Value)
- 4.4. Export Analysis (Volume and Value)
- 4.5. Price Trend Analysis
UK Fruits and Vegetables Market Segmentation By Geography
-
1. North America
- 1.1. United States
- 1.2. Canada
- 1.3. Mexico
-
2. South America
- 2.1. Brazil
- 2.2. Argentina
- 2.3. Rest of South America
-
3. Europe
- 3.1. United Kingdom
- 3.2. Germany
- 3.3. France
- 3.4. Italy
- 3.5. Spain
- 3.6. Russia
- 3.7. Benelux
- 3.8. Nordics
- 3.9. Rest of Europe
-
4. Middle East & Africa
- 4.1. Turkey
- 4.2. Israel
- 4.3. GCC
- 4.4. North Africa
- 4.5. South Africa
- 4.6. Rest of Middle East & Africa
-
5. Asia Pacific
- 5.1. China
- 5.2. India
- 5.3. Japan
- 5.4. South Korea
- 5.5. ASEAN
- 5.6. Oceania
- 5.7. Rest of Asia Pacific
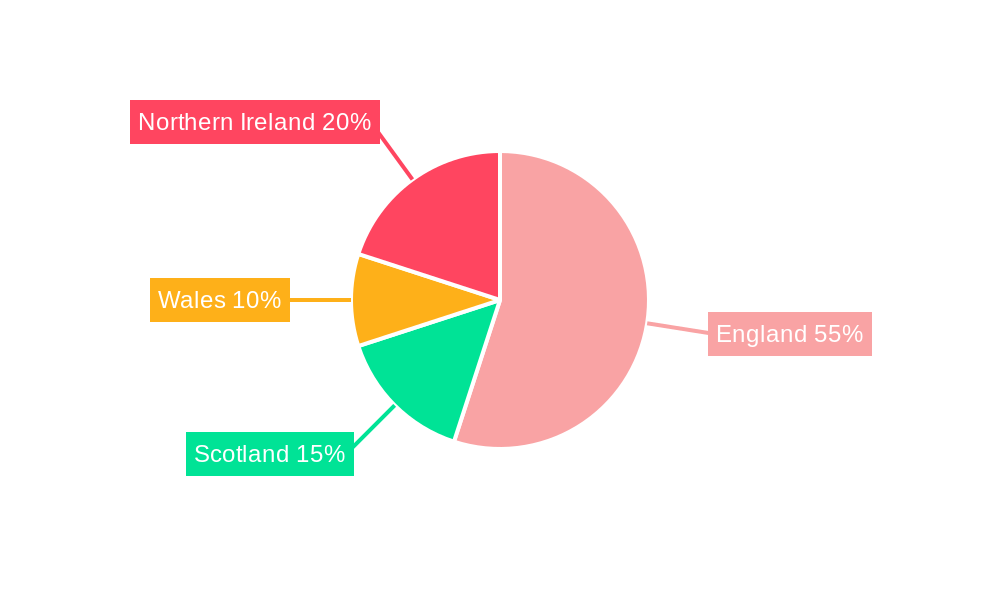
UK Fruits and Vegetables Market Regional Market Share
Geographic Coverage of UK Fruits and Vegetables Market
UK Fruits and Vegetables Market REPORT HIGHLIGHTS
| Aspects | Details |
|---|---|
| Study Period | 2020-2034 |
| Base Year | 2025 |
| Estimated Year | 2026 |
| Forecast Period | 2026-2034 |
| Historical Period | 2020-2025 |
| Growth Rate | CAGR of 2.97% from 2020-2034 |
| Segmentation |
|
Table of Contents
- 1. Introduction
- 1.1. Research Scope
- 1.2. Market Segmentation
- 1.3. Research Objective
- 1.4. Definitions and Assumptions
- 2. Executive Summary
- 2.1. Market Snapshot
- 3. Market Dynamics
- 3.1. Market Drivers
- 3.2. Market Restrains
- 3.3. Market Trends
- 3.4. Market Opportunities
- 4. Market Factor Analysis
- 4.1. Porters Five Forces
- 4.1.1. Bargaining Power of Suppliers
- 4.1.2. Bargaining Power of Buyers
- 4.1.3. Threat of New Entrants
- 4.1.4. Threat of Substitutes
- 4.1.5. Competitive Rivalry
- 4.2. PESTEL analysis
- 4.3. BCG Analysis
- 4.3.1. Stars (High Growth, High Market Share)
- 4.3.2. Cash Cows (Low Growth, High Market Share)
- 4.3.3. Question Mark (High Growth, Low Market Share)
- 4.3.4. Dogs (Low Growth, Low Market Share)
- 4.4. Ansoff Matrix Analysis
- 4.5. Supply Chain Analysis
- 4.6. Regulatory Landscape
- 4.7. Current Market Potential and Opportunity Assessment (TAM–SAM–SOM Framework)
- 4.8. PRI Analyst Note
- 4.1. Porters Five Forces
- 5. Market Analysis, Insights and Forecast 2021-2033
- 5.1. Market Analysis, Insights and Forecast - by Fruits
- 5.1.1. Production Analysis (Volume)
- 5.1.2. Consumption Analysis (Volume and Value)
- 5.1.3. Import Analysis (Volume and Value)
- 5.1.4. Export Analysis (Volume and Value)
- 5.1.5. Price Trend Analysis
- 5.2. Market Analysis, Insights and Forecast - by Vegetables
- 5.2.1. Production Analysis (Volume)
- 5.2.2. Consumption Analysis (Volume and Value)
- 5.2.3. Import Analysis (Volume and Value)
- 5.2.4. Export Analysis (Volume and Value)
- 5.2.5. Price Trend Analysis
- 5.3. Market Analysis, Insights and Forecast - by Fruits
- 5.3.1. Production Analysis (Volume)
- 5.3.2. Consumption Analysis (Volume and Value)
- 5.3.3. Import Analysis (Volume and Value)
- 5.3.4. Export Analysis (Volume and Value)
- 5.3.5. Price Trend Analysis
- 5.4. Market Analysis, Insights and Forecast - by Vegetables
- 5.4.1. Production Analysis (Volume)
- 5.4.2. Consumption Analysis (Volume and Value)
- 5.4.3. Import Analysis (Volume and Value)
- 5.4.4. Export Analysis (Volume and Value)
- 5.4.5. Price Trend Analysis
- 5.5. Market Analysis, Insights and Forecast - by Region
- 5.5.1. North America
- 5.5.2. South America
- 5.5.3. Europe
- 5.5.4. Middle East & Africa
- 5.5.5. Asia Pacific
- 5.1. Market Analysis, Insights and Forecast - by Fruits
- 6. Global UK Fruits and Vegetables Market Analysis, Insights and Forecast, 2021-2033
- 6.1. Market Analysis, Insights and Forecast - by Fruits
- 6.1.1. Production Analysis (Volume)
- 6.1.2. Consumption Analysis (Volume and Value)
- 6.1.3. Import Analysis (Volume and Value)
- 6.1.4. Export Analysis (Volume and Value)
- 6.1.5. Price Trend Analysis
- 6.2. Market Analysis, Insights and Forecast - by Vegetables
- 6.2.1. Production Analysis (Volume)
- 6.2.2. Consumption Analysis (Volume and Value)
- 6.2.3. Import Analysis (Volume and Value)
- 6.2.4. Export Analysis (Volume and Value)
- 6.2.5. Price Trend Analysis
- 6.3. Market Analysis, Insights and Forecast - by Fruits
- 6.3.1. Production Analysis (Volume)
- 6.3.2. Consumption Analysis (Volume and Value)
- 6.3.3. Import Analysis (Volume and Value)
- 6.3.4. Export Analysis (Volume and Value)
- 6.3.5. Price Trend Analysis
- 6.4. Market Analysis, Insights and Forecast - by Vegetables
- 6.4.1. Production Analysis (Volume)
- 6.4.2. Consumption Analysis (Volume and Value)
- 6.4.3. Import Analysis (Volume and Value)
- 6.4.4. Export Analysis (Volume and Value)
- 6.4.5. Price Trend Analysis
- 6.1. Market Analysis, Insights and Forecast - by Fruits
- 7. North America UK Fruits and Vegetables Market Analysis, Insights and Forecast, 2020-2032
- 7.1. Market Analysis, Insights and Forecast - by Fruits
- 7.1.1. Production Analysis (Volume)
- 7.1.2. Consumption Analysis (Volume and Value)
- 7.1.3. Import Analysis (Volume and Value)
- 7.1.4. Export Analysis (Volume and Value)
- 7.1.5. Price Trend Analysis
- 7.2. Market Analysis, Insights and Forecast - by Vegetables
- 7.2.1. Production Analysis (Volume)
- 7.2.2. Consumption Analysis (Volume and Value)
- 7.2.3. Import Analysis (Volume and Value)
- 7.2.4. Export Analysis (Volume and Value)
- 7.2.5. Price Trend Analysis
- 7.3. Market Analysis, Insights and Forecast - by Fruits
- 7.3.1. Production Analysis (Volume)
- 7.3.2. Consumption Analysis (Volume and Value)
- 7.3.3. Import Analysis (Volume and Value)
- 7.3.4. Export Analysis (Volume and Value)
- 7.3.5. Price Trend Analysis
- 7.4. Market Analysis, Insights and Forecast - by Vegetables
- 7.4.1. Production Analysis (Volume)
- 7.4.2. Consumption Analysis (Volume and Value)
- 7.4.3. Import Analysis (Volume and Value)
- 7.4.4. Export Analysis (Volume and Value)
- 7.4.5. Price Trend Analysis
- 7.1. Market Analysis, Insights and Forecast - by Fruits
- 8. South America UK Fruits and Vegetables Market Analysis, Insights and Forecast, 2020-2032
- 8.1. Market Analysis, Insights and Forecast - by Fruits
- 8.1.1. Production Analysis (Volume)
- 8.1.2. Consumption Analysis (Volume and Value)
- 8.1.3. Import Analysis (Volume and Value)
- 8.1.4. Export Analysis (Volume and Value)
- 8.1.5. Price Trend Analysis
- 8.2. Market Analysis, Insights and Forecast - by Vegetables
- 8.2.1. Production Analysis (Volume)
- 8.2.2. Consumption Analysis (Volume and Value)
- 8.2.3. Import Analysis (Volume and Value)
- 8.2.4. Export Analysis (Volume and Value)
- 8.2.5. Price Trend Analysis
- 8.3. Market Analysis, Insights and Forecast - by Fruits
- 8.3.1. Production Analysis (Volume)
- 8.3.2. Consumption Analysis (Volume and Value)
- 8.3.3. Import Analysis (Volume and Value)
- 8.3.4. Export Analysis (Volume and Value)
- 8.3.5. Price Trend Analysis
- 8.4. Market Analysis, Insights and Forecast - by Vegetables
- 8.4.1. Production Analysis (Volume)
- 8.4.2. Consumption Analysis (Volume and Value)
- 8.4.3. Import Analysis (Volume and Value)
- 8.4.4. Export Analysis (Volume and Value)
- 8.4.5. Price Trend Analysis
- 8.1. Market Analysis, Insights and Forecast - by Fruits
- 9. Europe UK Fruits and Vegetables Market Analysis, Insights and Forecast, 2020-2032
- 9.1. Market Analysis, Insights and Forecast - by Fruits
- 9.1.1. Production Analysis (Volume)
- 9.1.2. Consumption Analysis (Volume and Value)
- 9.1.3. Import Analysis (Volume and Value)
- 9.1.4. Export Analysis (Volume and Value)
- 9.1.5. Price Trend Analysis
- 9.2. Market Analysis, Insights and Forecast - by Vegetables
- 9.2.1. Production Analysis (Volume)
- 9.2.2. Consumption Analysis (Volume and Value)
- 9.2.3. Import Analysis (Volume and Value)
- 9.2.4. Export Analysis (Volume and Value)
- 9.2.5. Price Trend Analysis
- 9.3. Market Analysis, Insights and Forecast - by Fruits
- 9.3.1. Production Analysis (Volume)
- 9.3.2. Consumption Analysis (Volume and Value)
- 9.3.3. Import Analysis (Volume and Value)
- 9.3.4. Export Analysis (Volume and Value)
- 9.3.5. Price Trend Analysis
- 9.4. Market Analysis, Insights and Forecast - by Vegetables
- 9.4.1. Production Analysis (Volume)
- 9.4.2. Consumption Analysis (Volume and Value)
- 9.4.3. Import Analysis (Volume and Value)
- 9.4.4. Export Analysis (Volume and Value)
- 9.4.5. Price Trend Analysis
- 9.1. Market Analysis, Insights and Forecast - by Fruits
- 10. Middle East & Africa UK Fruits and Vegetables Market Analysis, Insights and Forecast, 2020-2032
- 10.1. Market Analysis, Insights and Forecast - by Fruits
- 10.1.1. Production Analysis (Volume)
- 10.1.2. Consumption Analysis (Volume and Value)
- 10.1.3. Import Analysis (Volume and Value)
- 10.1.4. Export Analysis (Volume and Value)
- 10.1.5. Price Trend Analysis
- 10.2. Market Analysis, Insights and Forecast - by Vegetables
- 10.2.1. Production Analysis (Volume)
- 10.2.2. Consumption Analysis (Volume and Value)
- 10.2.3. Import Analysis (Volume and Value)
- 10.2.4. Export Analysis (Volume and Value)
- 10.2.5. Price Trend Analysis
- 10.3. Market Analysis, Insights and Forecast - by Fruits
- 10.3.1. Production Analysis (Volume)
- 10.3.2. Consumption Analysis (Volume and Value)
- 10.3.3. Import Analysis (Volume and Value)
- 10.3.4. Export Analysis (Volume and Value)
- 10.3.5. Price Trend Analysis
- 10.4. Market Analysis, Insights and Forecast - by Vegetables
- 10.4.1. Production Analysis (Volume)
- 10.4.2. Consumption Analysis (Volume and Value)
- 10.4.3. Import Analysis (Volume and Value)
- 10.4.4. Export Analysis (Volume and Value)
- 10.4.5. Price Trend Analysis
- 10.1. Market Analysis, Insights and Forecast - by Fruits
- 11. Asia Pacific UK Fruits and Vegetables Market Analysis, Insights and Forecast, 2020-2032
- 11.1. Market Analysis, Insights and Forecast - by Fruits
- 11.1.1. Production Analysis (Volume)
- 11.1.2. Consumption Analysis (Volume and Value)
- 11.1.3. Import Analysis (Volume and Value)
- 11.1.4. Export Analysis (Volume and Value)
- 11.1.5. Price Trend Analysis
- 11.2. Market Analysis, Insights and Forecast - by Vegetables
- 11.2.1. Production Analysis (Volume)
- 11.2.2. Consumption Analysis (Volume and Value)
- 11.2.3. Import Analysis (Volume and Value)
- 11.2.4. Export Analysis (Volume and Value)
- 11.2.5. Price Trend Analysis
- 11.3. Market Analysis, Insights and Forecast - by Fruits
- 11.3.1. Production Analysis (Volume)
- 11.3.2. Consumption Analysis (Volume and Value)
- 11.3.3. Import Analysis (Volume and Value)
- 11.3.4. Export Analysis (Volume and Value)
- 11.3.5. Price Trend Analysis
- 11.4. Market Analysis, Insights and Forecast - by Vegetables
- 11.4.1. Production Analysis (Volume)
- 11.4.2. Consumption Analysis (Volume and Value)
- 11.4.3. Import Analysis (Volume and Value)
- 11.4.4. Export Analysis (Volume and Value)
- 11.4.5. Price Trend Analysis
- 11.1. Market Analysis, Insights and Forecast - by Fruits
- 12. Competitive Analysis
- 12.1. Company Profiles
- 12.1.1 Marks & Spencer
- 12.1.1.1. Company Overview
- 12.1.1.2. Products
- 12.1.1.3. Company Financials
- 12.1.1.4. SWOT Analysis
- 12.1.2 Waitrose
- 12.1.2.1. Company Overview
- 12.1.2.2. Products
- 12.1.2.3. Company Financials
- 12.1.2.4. SWOT Analysis
- 12.1.3 Sainsbury's
- 12.1.3.1. Company Overview
- 12.1.3.2. Products
- 12.1.3.3. Company Financials
- 12.1.3.4. SWOT Analysis
- 12.1.4 Asda
- 12.1.4.1. Company Overview
- 12.1.4.2. Products
- 12.1.4.3. Company Financials
- 12.1.4.4. SWOT Analysis
- 12.1.5 Tesco
- 12.1.5.1. Company Overview
- 12.1.5.2. Products
- 12.1.5.3. Company Financials
- 12.1.5.4. SWOT Analysis
- 12.1.1 Marks & Spencer
- 12.2. Market Entropy
- 12.2.1 Company's Key Areas Served
- 12.2.2 Recent Developments
- 12.3. Company Market Share Analysis 2025
- 12.3.1 Top 5 Companies Market Share Analysis
- 12.3.2 Top 3 Companies Market Share Analysis
- 12.4. List of Potential Customers
- 13. Research Methodology
List of Figures
- Figure 1: Global UK Fruits and Vegetables Market Revenue Breakdown (Million, %) by Region 2025 & 2033
- Figure 2: Global UK Fruits and Vegetables Market Volume Breakdown (Kiloton, %) by Region 2025 & 2033
- Figure 3: North America UK Fruits and Vegetables Market Revenue (Million), by Fruits 2025 & 2033
- Figure 4: North America UK Fruits and Vegetables Market Volume (Kiloton), by Fruits 2025 & 2033
- Figure 5: North America UK Fruits and Vegetables Market Revenue Share (%), by Fruits 2025 & 2033
- Figure 6: North America UK Fruits and Vegetables Market Volume Share (%), by Fruits 2025 & 2033
- Figure 7: North America UK Fruits and Vegetables Market Revenue (Million), by Vegetables 2025 & 2033
- Figure 8: North America UK Fruits and Vegetables Market Volume (Kiloton), by Vegetables 2025 & 2033
- Figure 9: North America UK Fruits and Vegetables Market Revenue Share (%), by Vegetables 2025 & 2033
- Figure 10: North America UK Fruits and Vegetables Market Volume Share (%), by Vegetables 2025 & 2033
- Figure 11: North America UK Fruits and Vegetables Market Revenue (Million), by Fruits 2025 & 2033
- Figure 12: North America UK Fruits and Vegetables Market Volume (Kiloton), by Fruits 2025 & 2033
- Figure 13: North America UK Fruits and Vegetables Market Revenue Share (%), by Fruits 2025 & 2033
- Figure 14: North America UK Fruits and Vegetables Market Volume Share (%), by Fruits 2025 & 2033
- Figure 15: North America UK Fruits and Vegetables Market Revenue (Million), by Vegetables 2025 & 2033
- Figure 16: North America UK Fruits and Vegetables Market Volume (Kiloton), by Vegetables 2025 & 2033
- Figure 17: North America UK Fruits and Vegetables Market Revenue Share (%), by Vegetables 2025 & 2033
- Figure 18: North America UK Fruits and Vegetables Market Volume Share (%), by Vegetables 2025 & 2033
- Figure 19: North America UK Fruits and Vegetables Market Revenue (Million), by Country 2025 & 2033
- Figure 20: North America UK Fruits and Vegetables Market Volume (Kiloton), by Country 2025 & 2033
- Figure 21: North America UK Fruits and Vegetables Market Revenue Share (%), by Country 2025 & 2033
- Figure 22: North America UK Fruits and Vegetables Market Volume Share (%), by Country 2025 & 2033
- Figure 23: South America UK Fruits and Vegetables Market Revenue (Million), by Fruits 2025 & 2033
- Figure 24: South America UK Fruits and Vegetables Market Volume (Kiloton), by Fruits 2025 & 2033
- Figure 25: South America UK Fruits and Vegetables Market Revenue Share (%), by Fruits 2025 & 2033
- Figure 26: South America UK Fruits and Vegetables Market Volume Share (%), by Fruits 2025 & 2033
- Figure 27: South America UK Fruits and Vegetables Market Revenue (Million), by Vegetables 2025 & 2033
- Figure 28: South America UK Fruits and Vegetables Market Volume (Kiloton), by Vegetables 2025 & 2033
- Figure 29: South America UK Fruits and Vegetables Market Revenue Share (%), by Vegetables 2025 & 2033
- Figure 30: South America UK Fruits and Vegetables Market Volume Share (%), by Vegetables 2025 & 2033
- Figure 31: South America UK Fruits and Vegetables Market Revenue (Million), by Fruits 2025 & 2033
- Figure 32: South America UK Fruits and Vegetables Market Volume (Kiloton), by Fruits 2025 & 2033
- Figure 33: South America UK Fruits and Vegetables Market Revenue Share (%), by Fruits 2025 & 2033
- Figure 34: South America UK Fruits and Vegetables Market Volume Share (%), by Fruits 2025 & 2033
- Figure 35: South America UK Fruits and Vegetables Market Revenue (Million), by Vegetables 2025 & 2033
- Figure 36: South America UK Fruits and Vegetables Market Volume (Kiloton), by Vegetables 2025 & 2033
- Figure 37: South America UK Fruits and Vegetables Market Revenue Share (%), by Vegetables 2025 & 2033
- Figure 38: South America UK Fruits and Vegetables Market Volume Share (%), by Vegetables 2025 & 2033
- Figure 39: South America UK Fruits and Vegetables Market Revenue (Million), by Country 2025 & 2033
- Figure 40: South America UK Fruits and Vegetables Market Volume (Kiloton), by Country 2025 & 2033
- Figure 41: South America UK Fruits and Vegetables Market Revenue Share (%), by Country 2025 & 2033
- Figure 42: South America UK Fruits and Vegetables Market Volume Share (%), by Country 2025 & 2033
- Figure 43: Europe UK Fruits and Vegetables Market Revenue (Million), by Fruits 2025 & 2033
- Figure 44: Europe UK Fruits and Vegetables Market Volume (Kiloton), by Fruits 2025 & 2033
- Figure 45: Europe UK Fruits and Vegetables Market Revenue Share (%), by Fruits 2025 & 2033
- Figure 46: Europe UK Fruits and Vegetables Market Volume Share (%), by Fruits 2025 & 2033
- Figure 47: Europe UK Fruits and Vegetables Market Revenue (Million), by Vegetables 2025 & 2033
- Figure 48: Europe UK Fruits and Vegetables Market Volume (Kiloton), by Vegetables 2025 & 2033
- Figure 49: Europe UK Fruits and Vegetables Market Revenue Share (%), by Vegetables 2025 & 2033
- Figure 50: Europe UK Fruits and Vegetables Market Volume Share (%), by Vegetables 2025 & 2033
- Figure 51: Europe UK Fruits and Vegetables Market Revenue (Million), by Fruits 2025 & 2033
- Figure 52: Europe UK Fruits and Vegetables Market Volume (Kiloton), by Fruits 2025 & 2033
- Figure 53: Europe UK Fruits and Vegetables Market Revenue Share (%), by Fruits 2025 & 2033
- Figure 54: Europe UK Fruits and Vegetables Market Volume Share (%), by Fruits 2025 & 2033
- Figure 55: Europe UK Fruits and Vegetables Market Revenue (Million), by Vegetables 2025 & 2033
- Figure 56: Europe UK Fruits and Vegetables Market Volume (Kiloton), by Vegetables 2025 & 2033
- Figure 57: Europe UK Fruits and Vegetables Market Revenue Share (%), by Vegetables 2025 & 2033
- Figure 58: Europe UK Fruits and Vegetables Market Volume Share (%), by Vegetables 2025 & 2033
- Figure 59: Europe UK Fruits and Vegetables Market Revenue (Million), by Country 2025 & 2033
- Figure 60: Europe UK Fruits and Vegetables Market Volume (Kiloton), by Country 2025 & 2033
- Figure 61: Europe UK Fruits and Vegetables Market Revenue Share (%), by Country 2025 & 2033
- Figure 62: Europe UK Fruits and Vegetables Market Volume Share (%), by Country 2025 & 2033
- Figure 63: Middle East & Africa UK Fruits and Vegetables Market Revenue (Million), by Fruits 2025 & 2033
- Figure 64: Middle East & Africa UK Fruits and Vegetables Market Volume (Kiloton), by Fruits 2025 & 2033
- Figure 65: Middle East & Africa UK Fruits and Vegetables Market Revenue Share (%), by Fruits 2025 & 2033
- Figure 66: Middle East & Africa UK Fruits and Vegetables Market Volume Share (%), by Fruits 2025 & 2033
- Figure 67: Middle East & Africa UK Fruits and Vegetables Market Revenue (Million), by Vegetables 2025 & 2033
- Figure 68: Middle East & Africa UK Fruits and Vegetables Market Volume (Kiloton), by Vegetables 2025 & 2033
- Figure 69: Middle East & Africa UK Fruits and Vegetables Market Revenue Share (%), by Vegetables 2025 & 2033
- Figure 70: Middle East & Africa UK Fruits and Vegetables Market Volume Share (%), by Vegetables 2025 & 2033
- Figure 71: Middle East & Africa UK Fruits and Vegetables Market Revenue (Million), by Fruits 2025 & 2033
- Figure 72: Middle East & Africa UK Fruits and Vegetables Market Volume (Kiloton), by Fruits 2025 & 2033
- Figure 73: Middle East & Africa UK Fruits and Vegetables Market Revenue Share (%), by Fruits 2025 & 2033
- Figure 74: Middle East & Africa UK Fruits and Vegetables Market Volume Share (%), by Fruits 2025 & 2033
- Figure 75: Middle East & Africa UK Fruits and Vegetables Market Revenue (Million), by Vegetables 2025 & 2033
- Figure 76: Middle East & Africa UK Fruits and Vegetables Market Volume (Kiloton), by Vegetables 2025 & 2033
- Figure 77: Middle East & Africa UK Fruits and Vegetables Market Revenue Share (%), by Vegetables 2025 & 2033
- Figure 78: Middle East & Africa UK Fruits and Vegetables Market Volume Share (%), by Vegetables 2025 & 2033
- Figure 79: Middle East & Africa UK Fruits and Vegetables Market Revenue (Million), by Country 2025 & 2033
- Figure 80: Middle East & Africa UK Fruits and Vegetables Market Volume (Kiloton), by Country 2025 & 2033
- Figure 81: Middle East & Africa UK Fruits and Vegetables Market Revenue Share (%), by Country 2025 & 2033
- Figure 82: Middle East & Africa UK Fruits and Vegetables Market Volume Share (%), by Country 2025 & 2033
- Figure 83: Asia Pacific UK Fruits and Vegetables Market Revenue (Million), by Fruits 2025 & 2033
- Figure 84: Asia Pacific UK Fruits and Vegetables Market Volume (Kiloton), by Fruits 2025 & 2033
- Figure 85: Asia Pacific UK Fruits and Vegetables Market Revenue Share (%), by Fruits 2025 & 2033
- Figure 86: Asia Pacific UK Fruits and Vegetables Market Volume Share (%), by Fruits 2025 & 2033
- Figure 87: Asia Pacific UK Fruits and Vegetables Market Revenue (Million), by Vegetables 2025 & 2033
- Figure 88: Asia Pacific UK Fruits and Vegetables Market Volume (Kiloton), by Vegetables 2025 & 2033
- Figure 89: Asia Pacific UK Fruits and Vegetables Market Revenue Share (%), by Vegetables 2025 & 2033
- Figure 90: Asia Pacific UK Fruits and Vegetables Market Volume Share (%), by Vegetables 2025 & 2033
- Figure 91: Asia Pacific UK Fruits and Vegetables Market Revenue (Million), by Fruits 2025 & 2033
- Figure 92: Asia Pacific UK Fruits and Vegetables Market Volume (Kiloton), by Fruits 2025 & 2033
- Figure 93: Asia Pacific UK Fruits and Vegetables Market Revenue Share (%), by Fruits 2025 & 2033
- Figure 94: Asia Pacific UK Fruits and Vegetables Market Volume Share (%), by Fruits 2025 & 2033
- Figure 95: Asia Pacific UK Fruits and Vegetables Market Revenue (Million), by Vegetables 2025 & 2033
- Figure 96: Asia Pacific UK Fruits and Vegetables Market Volume (Kiloton), by Vegetables 2025 & 2033
- Figure 97: Asia Pacific UK Fruits and Vegetables Market Revenue Share (%), by Vegetables 2025 & 2033
- Figure 98: Asia Pacific UK Fruits and Vegetables Market Volume Share (%), by Vegetables 2025 & 2033
- Figure 99: Asia Pacific UK Fruits and Vegetables Market Revenue (Million), by Country 2025 & 2033
- Figure 100: Asia Pacific UK Fruits and Vegetables Market Volume (Kiloton), by Country 2025 & 2033
- Figure 101: Asia Pacific UK Fruits and Vegetables Market Revenue Share (%), by Country 2025 & 2033
- Figure 102: Asia Pacific UK Fruits and Vegetables Market Volume Share (%), by Country 2025 & 2033
List of Tables
- Table 1: Global UK Fruits and Vegetables Market Revenue Million Forecast, by Fruits 2020 & 2033
- Table 2: Global UK Fruits and Vegetables Market Volume Kiloton Forecast, by Fruits 2020 & 2033
- Table 3: Global UK Fruits and Vegetables Market Revenue Million Forecast, by Vegetables 2020 & 2033
- Table 4: Global UK Fruits and Vegetables Market Volume Kiloton Forecast, by Vegetables 2020 & 2033
- Table 5: Global UK Fruits and Vegetables Market Revenue Million Forecast, by Fruits 2020 & 2033
- Table 6: Global UK Fruits and Vegetables Market Volume Kiloton Forecast, by Fruits 2020 & 2033
- Table 7: Global UK Fruits and Vegetables Market Revenue Million Forecast, by Vegetables 2020 & 2033
- Table 8: Global UK Fruits and Vegetables Market Volume Kiloton Forecast, by Vegetables 2020 & 2033
- Table 9: Global UK Fruits and Vegetables Market Revenue Million Forecast, by Region 2020 & 2033
- Table 10: Global UK Fruits and Vegetables Market Volume Kiloton Forecast, by Region 2020 & 2033
- Table 11: Global UK Fruits and Vegetables Market Revenue Million Forecast, by Fruits 2020 & 2033
- Table 12: Global UK Fruits and Vegetables Market Volume Kiloton Forecast, by Fruits 2020 & 2033
- Table 13: Global UK Fruits and Vegetables Market Revenue Million Forecast, by Vegetables 2020 & 2033
- Table 14: Global UK Fruits and Vegetables Market Volume Kiloton Forecast, by Vegetables 2020 & 2033
- Table 15: Global UK Fruits and Vegetables Market Revenue Million Forecast, by Fruits 2020 & 2033
- Table 16: Global UK Fruits and Vegetables Market Volume Kiloton Forecast, by Fruits 2020 & 2033
- Table 17: Global UK Fruits and Vegetables Market Revenue Million Forecast, by Vegetables 2020 & 2033
- Table 18: Global UK Fruits and Vegetables Market Volume Kiloton Forecast, by Vegetables 2020 & 2033
- Table 19: Global UK Fruits and Vegetables Market Revenue Million Forecast, by Country 2020 & 2033
- Table 20: Global UK Fruits and Vegetables Market Volume Kiloton Forecast, by Country 2020 & 2033
- Table 21: United States UK Fruits and Vegetables Market Revenue (Million) Forecast, by Application 2020 & 2033
- Table 22: United States UK Fruits and Vegetables Market Volume (Kiloton) Forecast, by Application 2020 & 2033
- Table 23: Canada UK Fruits and Vegetables Market Revenue (Million) Forecast, by Application 2020 & 2033
- Table 24: Canada UK Fruits and Vegetables Market Volume (Kiloton) Forecast, by Application 2020 & 2033
- Table 25: Mexico UK Fruits and Vegetables Market Revenue (Million) Forecast, by Application 2020 & 2033
- Table 26: Mexico UK Fruits and Vegetables Market Volume (Kiloton) Forecast, by Application 2020 & 2033
- Table 27: Global UK Fruits and Vegetables Market Revenue Million Forecast, by Fruits 2020 & 2033
- Table 28: Global UK Fruits and Vegetables Market Volume Kiloton Forecast, by Fruits 2020 & 2033
- Table 29: Global UK Fruits and Vegetables Market Revenue Million Forecast, by Vegetables 2020 & 2033
- Table 30: Global UK Fruits and Vegetables Market Volume Kiloton Forecast, by Vegetables 2020 & 2033
- Table 31: Global UK Fruits and Vegetables Market Revenue Million Forecast, by Fruits 2020 & 2033
- Table 32: Global UK Fruits and Vegetables Market Volume Kiloton Forecast, by Fruits 2020 & 2033
- Table 33: Global UK Fruits and Vegetables Market Revenue Million Forecast, by Vegetables 2020 & 2033
- Table 34: Global UK Fruits and Vegetables Market Volume Kiloton Forecast, by Vegetables 2020 & 2033
- Table 35: Global UK Fruits and Vegetables Market Revenue Million Forecast, by Country 2020 & 2033
- Table 36: Global UK Fruits and Vegetables Market Volume Kiloton Forecast, by Country 2020 & 2033
- Table 37: Brazil UK Fruits and Vegetables Market Revenue (Million) Forecast, by Application 2020 & 2033
- Table 38: Brazil UK Fruits and Vegetables Market Volume (Kiloton) Forecast, by Application 2020 & 2033
- Table 39: Argentina UK Fruits and Vegetables Market Revenue (Million) Forecast, by Application 2020 & 2033
- Table 40: Argentina UK Fruits and Vegetables Market Volume (Kiloton) Forecast, by Application 2020 & 2033
- Table 41: Rest of South America UK Fruits and Vegetables Market Revenue (Million) Forecast, by Application 2020 & 2033
- Table 42: Rest of South America UK Fruits and Vegetables Market Volume (Kiloton) Forecast, by Application 2020 & 2033
- Table 43: Global UK Fruits and Vegetables Market Revenue Million Forecast, by Fruits 2020 & 2033
- Table 44: Global UK Fruits and Vegetables Market Volume Kiloton Forecast, by Fruits 2020 & 2033
- Table 45: Global UK Fruits and Vegetables Market Revenue Million Forecast, by Vegetables 2020 & 2033
- Table 46: Global UK Fruits and Vegetables Market Volume Kiloton Forecast, by Vegetables 2020 & 2033
- Table 47: Global UK Fruits and Vegetables Market Revenue Million Forecast, by Fruits 2020 & 2033
- Table 48: Global UK Fruits and Vegetables Market Volume Kiloton Forecast, by Fruits 2020 & 2033
- Table 49: Global UK Fruits and Vegetables Market Revenue Million Forecast, by Vegetables 2020 & 2033
- Table 50: Global UK Fruits and Vegetables Market Volume Kiloton Forecast, by Vegetables 2020 & 2033
- Table 51: Global UK Fruits and Vegetables Market Revenue Million Forecast, by Country 2020 & 2033
- Table 52: Global UK Fruits and Vegetables Market Volume Kiloton Forecast, by Country 2020 & 2033
- Table 53: United Kingdom UK Fruits and Vegetables Market Revenue (Million) Forecast, by Application 2020 & 2033
- Table 54: United Kingdom UK Fruits and Vegetables Market Volume (Kiloton) Forecast, by Application 2020 & 2033
- Table 55: Germany UK Fruits and Vegetables Market Revenue (Million) Forecast, by Application 2020 & 2033
- Table 56: Germany UK Fruits and Vegetables Market Volume (Kiloton) Forecast, by Application 2020 & 2033
- Table 57: France UK Fruits and Vegetables Market Revenue (Million) Forecast, by Application 2020 & 2033
- Table 58: France UK Fruits and Vegetables Market Volume (Kiloton) Forecast, by Application 2020 & 2033
- Table 59: Italy UK Fruits and Vegetables Market Revenue (Million) Forecast, by Application 2020 & 2033
- Table 60: Italy UK Fruits and Vegetables Market Volume (Kiloton) Forecast, by Application 2020 & 2033
- Table 61: Spain UK Fruits and Vegetables Market Revenue (Million) Forecast, by Application 2020 & 2033
- Table 62: Spain UK Fruits and Vegetables Market Volume (Kiloton) Forecast, by Application 2020 & 2033
- Table 63: Russia UK Fruits and Vegetables Market Revenue (Million) Forecast, by Application 2020 & 2033
- Table 64: Russia UK Fruits and Vegetables Market Volume (Kiloton) Forecast, by Application 2020 & 2033
- Table 65: Benelux UK Fruits and Vegetables Market Revenue (Million) Forecast, by Application 2020 & 2033
- Table 66: Benelux UK Fruits and Vegetables Market Volume (Kiloton) Forecast, by Application 2020 & 2033
- Table 67: Nordics UK Fruits and Vegetables Market Revenue (Million) Forecast, by Application 2020 & 2033
- Table 68: Nordics UK Fruits and Vegetables Market Volume (Kiloton) Forecast, by Application 2020 & 2033
- Table 69: Rest of Europe UK Fruits and Vegetables Market Revenue (Million) Forecast, by Application 2020 & 2033
- Table 70: Rest of Europe UK Fruits and Vegetables Market Volume (Kiloton) Forecast, by Application 2020 & 2033
- Table 71: Global UK Fruits and Vegetables Market Revenue Million Forecast, by Fruits 2020 & 2033
- Table 72: Global UK Fruits and Vegetables Market Volume Kiloton Forecast, by Fruits 2020 & 2033
- Table 73: Global UK Fruits and Vegetables Market Revenue Million Forecast, by Vegetables 2020 & 2033
- Table 74: Global UK Fruits and Vegetables Market Volume Kiloton Forecast, by Vegetables 2020 & 2033
- Table 75: Global UK Fruits and Vegetables Market Revenue Million Forecast, by Fruits 2020 & 2033
- Table 76: Global UK Fruits and Vegetables Market Volume Kiloton Forecast, by Fruits 2020 & 2033
- Table 77: Global UK Fruits and Vegetables Market Revenue Million Forecast, by Vegetables 2020 & 2033
- Table 78: Global UK Fruits and Vegetables Market Volume Kiloton Forecast, by Vegetables 2020 & 2033
- Table 79: Global UK Fruits and Vegetables Market Revenue Million Forecast, by Country 2020 & 2033
- Table 80: Global UK Fruits and Vegetables Market Volume Kiloton Forecast, by Country 2020 & 2033
- Table 81: Turkey UK Fruits and Vegetables Market Revenue (Million) Forecast, by Application 2020 & 2033
- Table 82: Turkey UK Fruits and Vegetables Market Volume (Kiloton) Forecast, by Application 2020 & 2033
- Table 83: Israel UK Fruits and Vegetables Market Revenue (Million) Forecast, by Application 2020 & 2033
- Table 84: Israel UK Fruits and Vegetables Market Volume (Kiloton) Forecast, by Application 2020 & 2033
- Table 85: GCC UK Fruits and Vegetables Market Revenue (Million) Forecast, by Application 2020 & 2033
- Table 86: GCC UK Fruits and Vegetables Market Volume (Kiloton) Forecast, by Application 2020 & 2033
- Table 87: North Africa UK Fruits and Vegetables Market Revenue (Million) Forecast, by Application 2020 & 2033
- Table 88: North Africa UK Fruits and Vegetables Market Volume (Kiloton) Forecast, by Application 2020 & 2033
- Table 89: South Africa UK Fruits and Vegetables Market Revenue (Million) Forecast, by Application 2020 & 2033
- Table 90: South Africa UK Fruits and Vegetables Market Volume (Kiloton) Forecast, by Application 2020 & 2033
- Table 91: Rest of Middle East & Africa UK Fruits and Vegetables Market Revenue (Million) Forecast, by Application 2020 & 2033
- Table 92: Rest of Middle East & Africa UK Fruits and Vegetables Market Volume (Kiloton) Forecast, by Application 2020 & 2033
- Table 93: Global UK Fruits and Vegetables Market Revenue Million Forecast, by Fruits 2020 & 2033
- Table 94: Global UK Fruits and Vegetables Market Volume Kiloton Forecast, by Fruits 2020 & 2033
- Table 95: Global UK Fruits and Vegetables Market Revenue Million Forecast, by Vegetables 2020 & 2033
- Table 96: Global UK Fruits and Vegetables Market Volume Kiloton Forecast, by Vegetables 2020 & 2033
- Table 97: Global UK Fruits and Vegetables Market Revenue Million Forecast, by Fruits 2020 & 2033
- Table 98: Global UK Fruits and Vegetables Market Volume Kiloton Forecast, by Fruits 2020 & 2033
- Table 99: Global UK Fruits and Vegetables Market Revenue Million Forecast, by Vegetables 2020 & 2033
- Table 100: Global UK Fruits and Vegetables Market Volume Kiloton Forecast, by Vegetables 2020 & 2033
- Table 101: Global UK Fruits and Vegetables Market Revenue Million Forecast, by Country 2020 & 2033
- Table 102: Global UK Fruits and Vegetables Market Volume Kiloton Forecast, by Country 2020 & 2033
- Table 103: China UK Fruits and Vegetables Market Revenue (Million) Forecast, by Application 2020 & 2033
- Table 104: China UK Fruits and Vegetables Market Volume (Kiloton) Forecast, by Application 2020 & 2033
- Table 105: India UK Fruits and Vegetables Market Revenue (Million) Forecast, by Application 2020 & 2033
- Table 106: India UK Fruits and Vegetables Market Volume (Kiloton) Forecast, by Application 2020 & 2033
- Table 107: Japan UK Fruits and Vegetables Market Revenue (Million) Forecast, by Application 2020 & 2033
- Table 108: Japan UK Fruits and Vegetables Market Volume (Kiloton) Forecast, by Application 2020 & 2033
- Table 109: South Korea UK Fruits and Vegetables Market Revenue (Million) Forecast, by Application 2020 & 2033
- Table 110: South Korea UK Fruits and Vegetables Market Volume (Kiloton) Forecast, by Application 2020 & 2033
- Table 111: ASEAN UK Fruits and Vegetables Market Revenue (Million) Forecast, by Application 2020 & 2033
- Table 112: ASEAN UK Fruits and Vegetables Market Volume (Kiloton) Forecast, by Application 2020 & 2033
- Table 113: Oceania UK Fruits and Vegetables Market Revenue (Million) Forecast, by Application 2020 & 2033
- Table 114: Oceania UK Fruits and Vegetables Market Volume (Kiloton) Forecast, by Application 2020 & 2033
- Table 115: Rest of Asia Pacific UK Fruits and Vegetables Market Revenue (Million) Forecast, by Application 2020 & 2033
- Table 116: Rest of Asia Pacific UK Fruits and Vegetables Market Volume (Kiloton) Forecast, by Application 2020 & 2033
Frequently Asked Questions
1. What is the projected Compound Annual Growth Rate (CAGR) of the UK Fruits and Vegetables Market?
The projected CAGR is approximately 2.97%.
2. Which companies are prominent players in the UK Fruits and Vegetables Market?
Key companies in the market include Marks & Spencer , Waitrose, Sainsbury's , Asda , Tesco .
3. What are the main segments of the UK Fruits and Vegetables Market?
The market segments include Fruits, Vegetables, Fruits, Vegetables.
4. Can you provide details about the market size?
The market size is estimated to be USD 31.58 Million as of 2022.
5. What are some drivers contributing to market growth?
; Awareness About Health Benefits Associated With Pecan Consumption; Wide Application of Pecan.
6. What are the notable trends driving market growth?
Increasing Area Under Cultivation.
7. Are there any restraints impacting market growth?
; Volatility in the Prices; Adverse Weather Conditions Affecting Yield.
8. Can you provide examples of recent developments in the market?
N/A
9. What pricing options are available for accessing the report?
Pricing options include single-user, multi-user, and enterprise licenses priced at USD 3800, USD 4500, and USD 5800 respectively.
10. Is the market size provided in terms of value or volume?
The market size is provided in terms of value, measured in Million and volume, measured in Kiloton.
11. Are there any specific market keywords associated with the report?
Yes, the market keyword associated with the report is "UK Fruits and Vegetables Market," which aids in identifying and referencing the specific market segment covered.
12. How do I determine which pricing option suits my needs best?
The pricing options vary based on user requirements and access needs. Individual users may opt for single-user licenses, while businesses requiring broader access may choose multi-user or enterprise licenses for cost-effective access to the report.
13. Are there any additional resources or data provided in the UK Fruits and Vegetables Market report?
While the report offers comprehensive insights, it's advisable to review the specific contents or supplementary materials provided to ascertain if additional resources or data are available.
14. How can I stay updated on further developments or reports in the UK Fruits and Vegetables Market?
To stay informed about further developments, trends, and reports in the UK Fruits and Vegetables Market, consider subscribing to industry newsletters, following relevant companies and organizations, or regularly checking reputable industry news sources and publications.
Methodology
Step 1 - Identification of Relevant Samples Size from Population Database


Step 2 - Approaches for Defining Global Market Size (Value, Volume* & Price*)

Note*: In applicable scenarios
Step 3 - Data Sources
Primary Research
- Web Analytics
- Survey Reports
- Research Institute
- Latest Research Reports
- Opinion Leaders
Secondary Research
- Annual Reports
- White Paper
- Latest Press Release
- Industry Association
- Paid Database
- Investor Presentations

Step 4 - Data Triangulation
Involves using different sources of information in order to increase the validity of a study
These sources are likely to be stakeholders in a program - participants, other researchers, program staff, other community members, and so on.
Then we put all data in single framework & apply various statistical tools to find out the dynamic on the market.
During the analysis stage, feedback from the stakeholder groups would be compared to determine areas of agreement as well as areas of divergence