

Key Insights
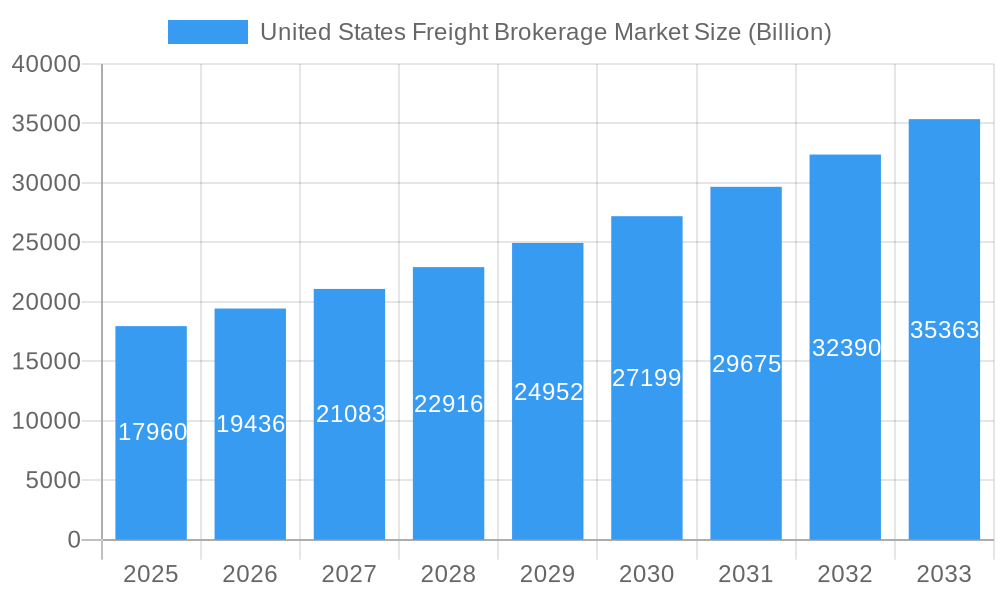
The United States freight brokerage market, valued at approximately $17.96 billion in 2025, is experiencing robust growth, projected to expand at a compound annual growth rate (CAGR) of 8.35% from 2025 to 2033. This growth is fueled by several key factors. The rise of e-commerce continues to drive demand for efficient and reliable freight transportation, pushing businesses to leverage the expertise of freight brokers to manage complex logistics. Furthermore, advancements in technology, such as digital freight matching platforms and sophisticated route optimization software, are streamlining operations and enhancing transparency, leading to increased efficiency and cost savings. The increasing complexity of supply chains, particularly in sectors like manufacturing and automotive, necessitates the services of experienced freight brokers capable of handling diverse transportation needs and navigating regulatory hurdles. Finally, a growing focus on sustainability within the logistics industry is prompting freight brokers to adopt eco-friendly practices, further enhancing their appeal to environmentally conscious businesses.
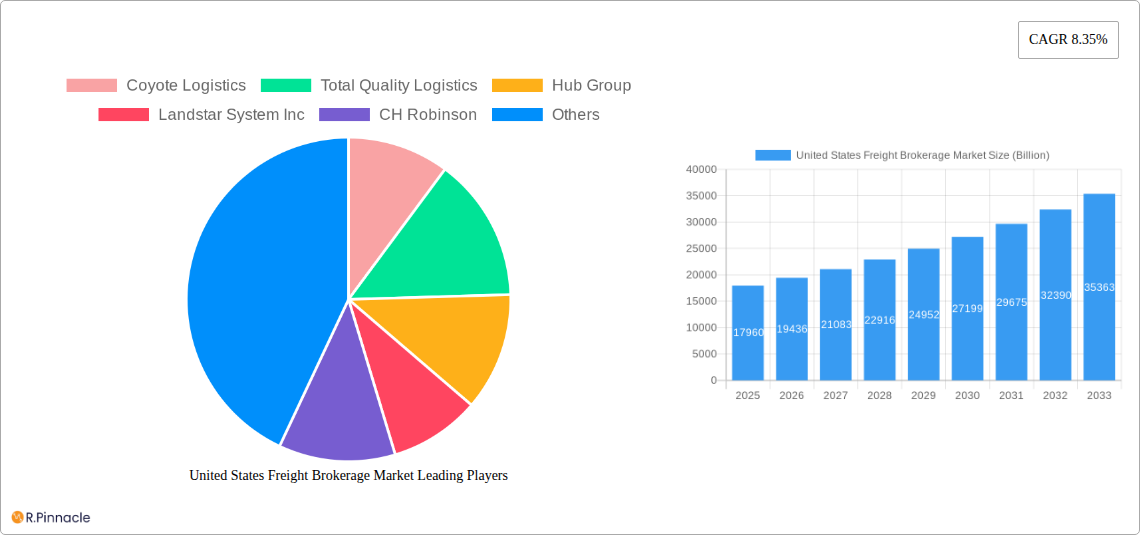
United States Freight Brokerage Market Market Size (In Billion)
The market's segmentation reveals significant opportunities across various service types and end-user industries. While Less-Than-Truckload (LTL) and Full-Truckload (FTL) services remain dominant, the "Other Services" segment, encompassing specialized transportation and value-added logistics, presents a significant growth area. Among end-users, the manufacturing and automotive sector constitutes a substantial portion of the market, followed by oil and gas, and the distributive trade sector (including FMCG). The construction industry also presents a sizable market segment, demonstrating the broad reach of freight brokerage services across diverse economic sectors. Competitive intensity is high, with major players like Coyote Logistics, Total Quality Logistics, and C.H. Robinson vying for market share alongside a range of regional and specialized brokers. However, the market's growth trajectory suggests ample room for both established players and new entrants to thrive, provided they can adapt to evolving technological advancements and customer demands.
United States Freight Brokerage Market Company Market Share
This in-depth report provides a comprehensive analysis of the United States freight brokerage market, offering invaluable insights for industry professionals, investors, and strategic decision-makers. With a study period spanning 2019-2033, a base year of 2025, and a forecast period of 2025-2033, this report meticulously examines market dynamics, competitive landscapes, and future growth potential. The market is projected to reach xx Billion by 2033, showcasing significant growth opportunities.
United States Freight Brokerage Market Market Structure & Innovation Trends
This section analyzes the structure of the US freight brokerage market, including market concentration, innovation drivers, regulatory frameworks, product substitutes, end-user demographics, and M&A activities. The market is characterized by a mix of large multinational corporations and smaller, specialized players.
Market Concentration: While a few large players such as Coyote Logistics, C.H. Robinson, and Total Quality Logistics hold significant market share, the market also features numerous smaller, regional brokers. The top 10 players account for an estimated xx% of the market share in 2025, leaving significant room for competition and growth amongst smaller firms.
Innovation Drivers: Technological advancements, such as digital freight matching platforms, AI-powered route optimization, and blockchain-based supply chain solutions, are driving innovation and efficiency improvements in the industry.
Regulatory Framework: Regulations surrounding trucking, safety, and environmental compliance significantly influence market dynamics. Ongoing regulatory changes necessitate continuous adaptation and compliance efforts for all market participants.
Product Substitutes: The emergence of alternative transportation solutions, like last-mile delivery services and autonomous trucking, presents a potential threat to traditional freight brokerage models, prompting adaptations in service offerings and technology adoption.
End-User Demographics: The market caters to a diverse range of end users across various sectors, including manufacturing, retail, oil & gas, and more. Understanding the specific needs of these sectors is crucial for successful market penetration and growth.
M&A Activities: Consolidation is a recurring trend within the freight brokerage industry, with significant M&A activity observed in recent years. Deal values have ranged from xx Billion to xx Billion, driven by the need to scale operations and expand service offerings. Examples include the acquisition of X Company by Y Company for xx Billion. This trend reflects the growing market dominance of larger firms.
United States Freight Brokerage Market Market Dynamics & Trends
This section explores the market growth drivers, technological disruptions, consumer preferences, and competitive dynamics within the United States freight brokerage market.
The US freight brokerage market is experiencing robust growth fueled by the expansion of e-commerce, increasing demand for efficient supply chain solutions, and the growing complexity of global trade. The market has witnessed a Compound Annual Growth Rate (CAGR) of xx% during the historical period (2019-2024) and is projected to maintain a CAGR of xx% during the forecast period (2025-2033). Increased reliance on technology is transforming the industry. Companies are investing in advanced analytics to optimize routes, predict demand, and improve customer service. This results in increased efficiency and customer satisfaction. This is further enhanced by improved supply chain visibility through technology-driven solutions. Competition is fierce, driven by price pressures and the need for constant innovation. Market penetration is high for major players, especially in larger metropolitan areas. However, there are still opportunities for smaller companies to focus on niche markets or specialized services.
Dominant Regions & Segments in United States Freight Brokerage Market
This section identifies the leading regions and segments within the US freight brokerage market.
By Service: Full Truckload (FTL) currently dominates the market, accounting for the largest share (xx%), followed by Less-Than-Truckload (LTL) at xx%. Other Services, such as intermodal transportation and specialized freight, are also experiencing significant growth.
By End User: The Manufacturing and Automotive sector stands as the largest end-user segment, driven by robust production and supply chain activities. Distributive Trade (wholesale and retail, including FMCG) is another significant segment, owing to the expansive nature of retail logistics and the demand for timely deliveries.
Key Drivers:
- Economic Growth: Strong economic activity drives increased freight volume and demand for brokerage services.
- Infrastructure Development: Investments in road networks and transportation infrastructure enhance efficiency and connectivity.
- Government Policies: Regulatory changes and support for logistics infrastructure contribute significantly to market growth.
The dominance of FTL and the Manufacturing and Automotive sectors is attributable to their high freight volumes and reliance on efficient and reliable transportation solutions. The growth of e-commerce and the rising demand for faster deliveries are further bolstering the demand for these services.
United States Freight Brokerage Market Product Innovations
Recent product innovations include the integration of advanced technologies such as AI and machine learning for improved route optimization and predictive analytics. The development of digital platforms and mobile applications enhances supply chain visibility and facilitates seamless communication between brokers, carriers, and shippers. These technological advancements are improving efficiency, transparency, and cost-effectiveness, fostering a competitive advantage in the marketplace. This directly leads to the enhanced capabilities of freight brokerage companies to meet the demanding needs of their customers, offering faster transit times, greater delivery reliability and improved cost management.
Report Scope & Segmentation Analysis
This report comprehensively segments the US freight brokerage market by service type (LTL, FTL, Other Services) and end-user (Manufacturing and Automotive, Oil and Gas, Mining, and Quarrying, Agriculture, Fishing, and Forestry, Construction, Distributive Trade, Other End Users). Each segment provides specific growth projections, market sizes, and competitive dynamics. Growth projections show significant opportunities across all segments, with strong growth expected in LTL and specialized services driven by the expansion of e-commerce and the growth of niche markets.
Key Drivers of United States Freight Brokerage Market Growth
Key drivers include the growth of e-commerce leading to increased demand for last-mile delivery solutions. Technological advancements such as AI-powered route optimization and digital freight matching platforms enhance efficiency and reduce costs. Favorable government regulations promoting infrastructure development and streamlining logistics processes also stimulate market growth.
Challenges in the United States Freight Brokerage Market Sector
Challenges include driver shortages leading to capacity constraints and increased transportation costs, impacting on-time delivery rates and increasing operational challenges for businesses. Fluctuations in fuel prices contribute to cost volatility and impact profitability, while increased regulatory scrutiny necessitates increased compliance costs. Intense competition necessitates a continuous pursuit of efficiency and innovation to maintain market share.
Emerging Opportunities in United States Freight Brokerage Market
Emerging opportunities include the increasing adoption of autonomous vehicles and the growing demand for sustainable transportation solutions. Expansion into underserved markets and offering specialized services catering to niche industry demands are other key opportunities. Growing use of blockchain technology for improved supply chain transparency and traceability also presents significant opportunities for growth and market differentiation.
Leading Players in the United States Freight Brokerage Market Market
- Coyote Logistics
- Total Quality Logistics
- Hub Group
- Landstar System Inc
- C.H. Robinson
- KAG Logistics Inc
- SunteckTTS
- BNSF Logistics LLC
- XPO Logistics Inc
- Uber Freight
- 6 3 Other Companies
- Worldwide Express
- Schneider
- Echo Global Logistics
- GlobalTranz
- J.B. Hunt Transport Inc
Key Developments in United States Freight Brokerage Market Industry
August 2023: Convoy launches a just-in-time (JIT) trucking offering, providing 15-minute delivery windows and enhancing flexibility for shippers. This innovation addresses the evolving needs of shippers requiring rapid and adaptable delivery solutions.
February 2023: Echo Global Logistics introduces EchoInsure+, an integrated cargo insurance product, offering enhanced protection for LTL shipments through its online platform. This enhances customer trust and risk mitigation by offering full coverage and convenient access to insurance through the shipping platform.
Future Outlook for United States Freight Brokerage Market Market
The US freight brokerage market is poised for continued growth, driven by technological advancements, increasing e-commerce activity, and the ongoing need for efficient and reliable transportation solutions. Strategic partnerships, investments in technology, and expansion into new markets will be crucial for sustained success in this dynamic and competitive landscape. The market is projected to see significant expansion in the coming years, presenting attractive opportunities for both established players and new entrants.
United States Freight Brokerage Market Segmentation
-
1. Service
- 1.1. LTL
- 1.2. FTL
- 1.3. Other Services
-
2. End User
- 2.1. Manufacturing and Automotive
- 2.2. Oil and Gas, Mining, and Quarrying
- 2.3. Agriculture, Fishing, and Forestry
- 2.4. Construction
- 2.5. Distribu
- 2.6. Other En
United States Freight Brokerage Market Segmentation By Geography
- 1. United States
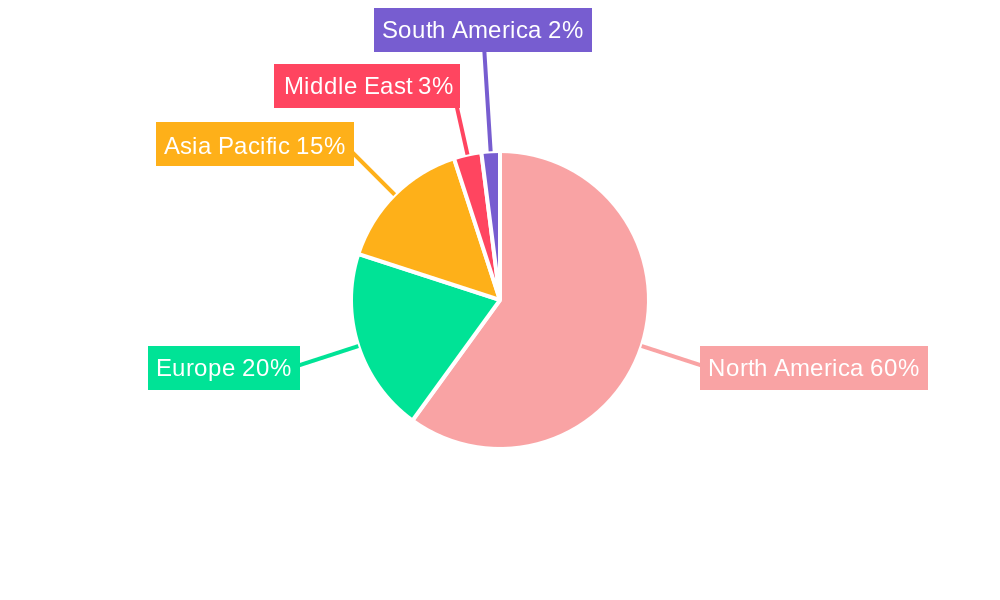
United States Freight Brokerage Market Regional Market Share
Geographic Coverage of United States Freight Brokerage Market
United States Freight Brokerage Market REPORT HIGHLIGHTS
| Aspects | Details |
|---|---|
| Study Period | 2020-2034 |
| Base Year | 2025 |
| Estimated Year | 2026 |
| Forecast Period | 2026-2034 |
| Historical Period | 2020-2025 |
| Growth Rate | CAGR of 8.35% from 2020-2034 |
| Segmentation |
|
Table of Contents
- 1. Introduction
- 1.1. Research Scope
- 1.2. Market Segmentation
- 1.3. Research Objective
- 1.4. Definitions and Assumptions
- 2. Executive Summary
- 2.1. Market Snapshot
- 3. Market Dynamics
- 3.1. Market Drivers
- 3.2. Market Restrains
- 3.3. Market Trends
- 3.4. Market Opportunities
- 4. Market Factor Analysis
- 4.1. Porters Five Forces
- 4.1.1. Bargaining Power of Suppliers
- 4.1.2. Bargaining Power of Buyers
- 4.1.3. Threat of New Entrants
- 4.1.4. Threat of Substitutes
- 4.1.5. Competitive Rivalry
- 4.2. PESTEL analysis
- 4.3. BCG Analysis
- 4.3.1. Stars (High Growth, High Market Share)
- 4.3.2. Cash Cows (Low Growth, High Market Share)
- 4.3.3. Question Mark (High Growth, Low Market Share)
- 4.3.4. Dogs (Low Growth, Low Market Share)
- 4.4. Ansoff Matrix Analysis
- 4.5. Supply Chain Analysis
- 4.6. Regulatory Landscape
- 4.7. Current Market Potential and Opportunity Assessment (TAM–SAM–SOM Framework)
- 4.8. PRI Analyst Note
- 4.1. Porters Five Forces
- 5. Market Analysis, Insights and Forecast 2021-2033
- 5.1. Market Analysis, Insights and Forecast - by Service
- 5.1.1. LTL
- 5.1.2. FTL
- 5.1.3. Other Services
- 5.2. Market Analysis, Insights and Forecast - by End User
- 5.2.1. Manufacturing and Automotive
- 5.2.2. Oil and Gas, Mining, and Quarrying
- 5.2.3. Agriculture, Fishing, and Forestry
- 5.2.4. Construction
- 5.2.5. Distribu
- 5.2.6. Other En
- 5.3. Market Analysis, Insights and Forecast - by Region
- 5.3.1. United States
- 5.1. Market Analysis, Insights and Forecast - by Service
- 6. United States Freight Brokerage Market Analysis, Insights and Forecast, 2021-2033
- 6.1. Market Analysis, Insights and Forecast - by Service
- 6.1.1. LTL
- 6.1.2. FTL
- 6.1.3. Other Services
- 6.2. Market Analysis, Insights and Forecast - by End User
- 6.2.1. Manufacturing and Automotive
- 6.2.2. Oil and Gas, Mining, and Quarrying
- 6.2.3. Agriculture, Fishing, and Forestry
- 6.2.4. Construction
- 6.2.5. Distribu
- 6.2.6. Other En
- 6.1. Market Analysis, Insights and Forecast - by Service
- 7. Competitive Analysis
- 7.1. Company Profiles
- 7.1.1 Coyote Logistics
- 7.1.1.1. Company Overview
- 7.1.1.2. Products
- 7.1.1.3. Company Financials
- 7.1.1.4. SWOT Analysis
- 7.1.2 Total Quality Logistics
- 7.1.2.1. Company Overview
- 7.1.2.2. Products
- 7.1.2.3. Company Financials
- 7.1.2.4. SWOT Analysis
- 7.1.3 Hub Group
- 7.1.3.1. Company Overview
- 7.1.3.2. Products
- 7.1.3.3. Company Financials
- 7.1.3.4. SWOT Analysis
- 7.1.4 Landstar System Inc
- 7.1.4.1. Company Overview
- 7.1.4.2. Products
- 7.1.4.3. Company Financials
- 7.1.4.4. SWOT Analysis
- 7.1.5 CH Robinson
- 7.1.5.1. Company Overview
- 7.1.5.2. Products
- 7.1.5.3. Company Financials
- 7.1.5.4. SWOT Analysis
- 7.1.6 KAG Logistics Inc
- 7.1.6.1. Company Overview
- 7.1.6.2. Products
- 7.1.6.3. Company Financials
- 7.1.6.4. SWOT Analysis
- 7.1.7 SunteckTTS
- 7.1.7.1. Company Overview
- 7.1.7.2. Products
- 7.1.7.3. Company Financials
- 7.1.7.4. SWOT Analysis
- 7.1.8 BNSF Logistics LLC
- 7.1.8.1. Company Overview
- 7.1.8.2. Products
- 7.1.8.3. Company Financials
- 7.1.8.4. SWOT Analysis
- 7.1.9 XPO Logistics Inc
- 7.1.9.1. Company Overview
- 7.1.9.2. Products
- 7.1.9.3. Company Financials
- 7.1.9.4. SWOT Analysis
- 7.1.10 Uber Freight**List Not Exhaustive 6 3 Other Companie
- 7.1.10.1. Company Overview
- 7.1.10.2. Products
- 7.1.10.3. Company Financials
- 7.1.10.4. SWOT Analysis
- 7.1.11 Worldwide Express
- 7.1.11.1. Company Overview
- 7.1.11.2. Products
- 7.1.11.3. Company Financials
- 7.1.11.4. SWOT Analysis
- 7.1.12 Schneider
- 7.1.12.1. Company Overview
- 7.1.12.2. Products
- 7.1.12.3. Company Financials
- 7.1.12.4. SWOT Analysis
- 7.1.13 Echo Global Logistics
- 7.1.13.1. Company Overview
- 7.1.13.2. Products
- 7.1.13.3. Company Financials
- 7.1.13.4. SWOT Analysis
- 7.1.14 GlobalTranz
- 7.1.14.1. Company Overview
- 7.1.14.2. Products
- 7.1.14.3. Company Financials
- 7.1.14.4. SWOT Analysis
- 7.1.15 J B Hunt Transport Inc
- 7.1.15.1. Company Overview
- 7.1.15.2. Products
- 7.1.15.3. Company Financials
- 7.1.15.4. SWOT Analysis
- 7.1.1 Coyote Logistics
- 7.2. Market Entropy
- 7.2.1 Company's Key Areas Served
- 7.2.2 Recent Developments
- 7.3. Company Market Share Analysis 2025
- 7.3.1 Top 5 Companies Market Share Analysis
- 7.3.2 Top 3 Companies Market Share Analysis
- 7.4. List of Potential Customers
- 8. Research Methodology
List of Figures
- Figure 1: United States Freight Brokerage Market Revenue Breakdown (Billion, %) by Product 2025 & 2033
- Figure 2: United States Freight Brokerage Market Share (%) by Company 2025
List of Tables
- Table 1: United States Freight Brokerage Market Revenue Billion Forecast, by Service 2020 & 2033
- Table 2: United States Freight Brokerage Market Revenue Billion Forecast, by End User 2020 & 2033
- Table 3: United States Freight Brokerage Market Revenue Billion Forecast, by Region 2020 & 2033
- Table 4: United States Freight Brokerage Market Revenue Billion Forecast, by Service 2020 & 2033
- Table 5: United States Freight Brokerage Market Revenue Billion Forecast, by End User 2020 & 2033
- Table 6: United States Freight Brokerage Market Revenue Billion Forecast, by Country 2020 & 2033
Frequently Asked Questions
1. What is the projected Compound Annual Growth Rate (CAGR) of the United States Freight Brokerage Market?
The projected CAGR is approximately 8.35%.
2. Which companies are prominent players in the United States Freight Brokerage Market?
Key companies in the market include Coyote Logistics, Total Quality Logistics, Hub Group, Landstar System Inc, CH Robinson, KAG Logistics Inc, SunteckTTS, BNSF Logistics LLC, XPO Logistics Inc, Uber Freight**List Not Exhaustive 6 3 Other Companie, Worldwide Express, Schneider, Echo Global Logistics, GlobalTranz, J B Hunt Transport Inc.
3. What are the main segments of the United States Freight Brokerage Market?
The market segments include Service, End User.
4. Can you provide details about the market size?
The market size is estimated to be USD 17.96 Billion as of 2022.
5. What are some drivers contributing to market growth?
4.; Growing Construction Across the Country4.; The Growing Number of Freight Brokers Across the Country.
6. What are the notable trends driving market growth?
FTL Service Has Gained Momentum in the Country in Recent Years.
7. Are there any restraints impacting market growth?
4.; Rerouting of Cargo and Other Factors4.; Reducing Freight Imports Across the Country.
8. Can you provide examples of recent developments in the market?
August 2023: Digital logistics provider and freight brokerage Convoy unveiled an offering for just-in-time (JIT) trucking, with a pledge of delivery within 15 minutes of the set arrival time. Convoy spotted an opening for a more flexible service that gives shippers the ability to scale up and down in response to fast-changing conditions. Its new JIT service leverages a network of over 400,000 trucks and the IT infrastructure to find matching carriers to meet specific shipper requirements.
9. What pricing options are available for accessing the report?
Pricing options include single-user, multi-user, and enterprise licenses priced at USD 3800, USD 4500, and USD 5800 respectively.
10. Is the market size provided in terms of value or volume?
The market size is provided in terms of value, measured in Billion.
11. Are there any specific market keywords associated with the report?
Yes, the market keyword associated with the report is "United States Freight Brokerage Market," which aids in identifying and referencing the specific market segment covered.
12. How do I determine which pricing option suits my needs best?
The pricing options vary based on user requirements and access needs. Individual users may opt for single-user licenses, while businesses requiring broader access may choose multi-user or enterprise licenses for cost-effective access to the report.
13. Are there any additional resources or data provided in the United States Freight Brokerage Market report?
While the report offers comprehensive insights, it's advisable to review the specific contents or supplementary materials provided to ascertain if additional resources or data are available.
14. How can I stay updated on further developments or reports in the United States Freight Brokerage Market?
To stay informed about further developments, trends, and reports in the United States Freight Brokerage Market, consider subscribing to industry newsletters, following relevant companies and organizations, or regularly checking reputable industry news sources and publications.
Methodology
Step 1 - Identification of Relevant Samples Size from Population Database


Step 2 - Approaches for Defining Global Market Size (Value, Volume* & Price*)

Note*: In applicable scenarios
Step 3 - Data Sources
Primary Research
- Web Analytics
- Survey Reports
- Research Institute
- Latest Research Reports
- Opinion Leaders
Secondary Research
- Annual Reports
- White Paper
- Latest Press Release
- Industry Association
- Paid Database
- Investor Presentations

Step 4 - Data Triangulation
Involves using different sources of information in order to increase the validity of a study
These sources are likely to be stakeholders in a program - participants, other researchers, program staff, other community members, and so on.
Then we put all data in single framework & apply various statistical tools to find out the dynamic on the market.
During the analysis stage, feedback from the stakeholder groups would be compared to determine areas of agreement as well as areas of divergence