

Key Insights
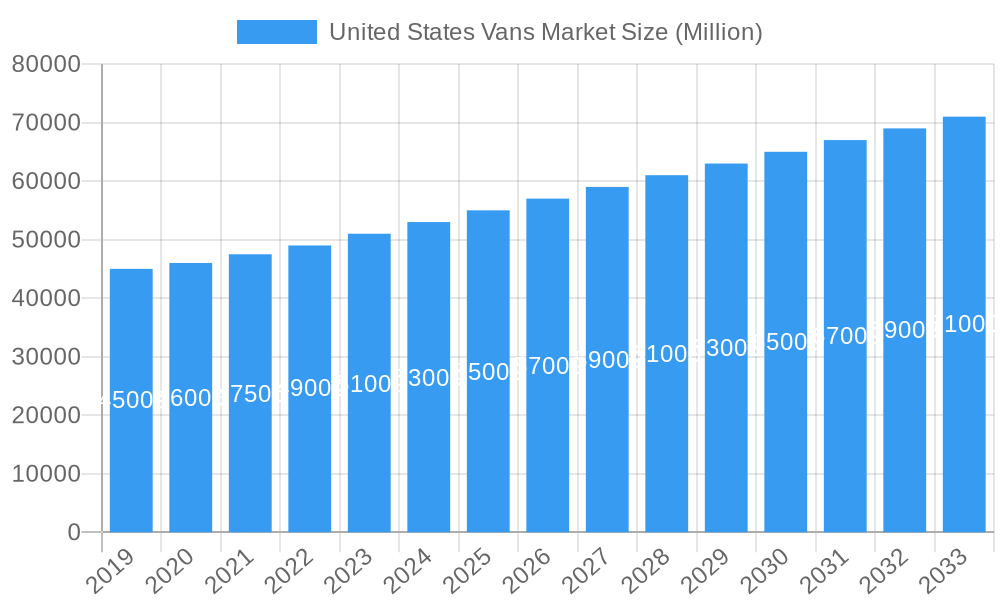
The United States Vans Market is set for substantial expansion, projected to reach $11.79 billion by 2025, with a Compound Annual Growth Rate (CAGR) of 5.73% through 2033. This growth is fueled by the burgeoning e-commerce sector and the escalating demand for efficient last-mile delivery solutions. The surge in online retail necessitates reliable and versatile vans for goods transportation, positioning fleet operators and logistics companies as key stakeholders. Evolving consumer preferences for flexible and accessible transportation, alongside government initiatives promoting commercial fleet electrification, are further accelerating market growth. A notable trend is the increasing adoption of electric and hybrid vans, aligning with environmental goals and corporate social responsibility. Leading manufacturers such as Ford, General Motors, and Ram Trucking are actively introducing new models to meet these evolving demands, highlighting a competitive and dynamic market landscape.
United States Vans Market Market Size (In Billion)
Despite a positive outlook, market growth may be tempered by certain challenges. The initial investment for electric and hybrid vans, while declining, remains a significant hurdle for some businesses, particularly SMEs. Furthermore, the availability and charging infrastructure for electric vans, especially in non-urban areas, continue to present challenges. However, the long-term operational cost savings of electric vehicles, including reduced fuel and maintenance, are increasingly mitigating initial investment concerns. Market segmentation demonstrates a balance between traditional Internal Combustion Engine (ICE) vehicles, favored for their established range and refueling convenience, and the rapidly expanding hybrid and electric vehicle segments. Ongoing advancements in battery technology, coupled with government incentives and tax credits, are expected to accelerate the adoption of Battery Electric Vehicles (BEVs) and Hybrid Electric Vehicles (HEVs), reshaping the future of commercial van transportation in the United States.
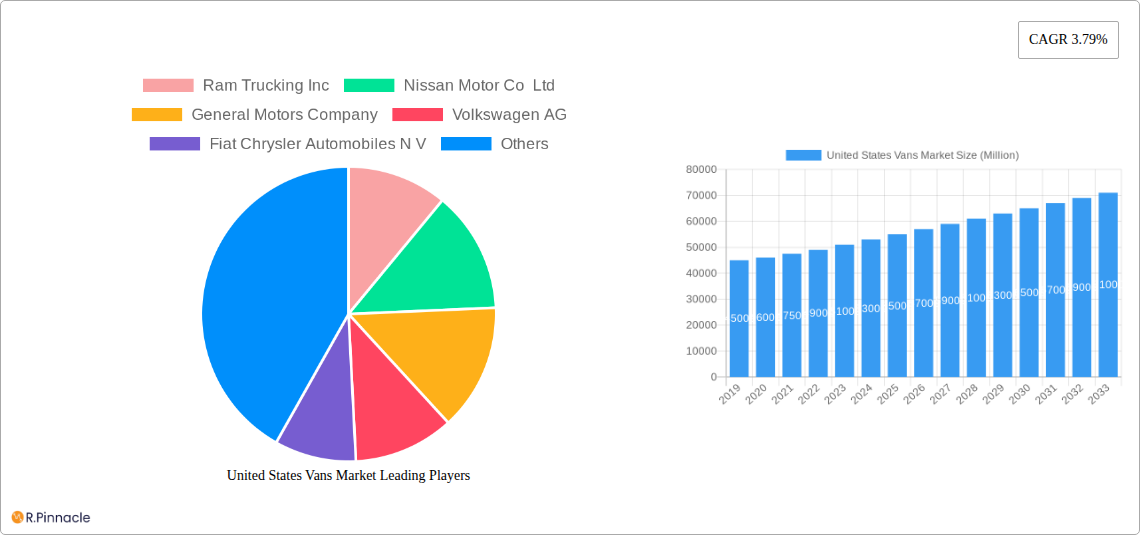
United States Vans Market Company Market Share
United States Vans Market Report: Comprehensive Analysis & Future Outlook (2019-2033)
Unlock unparalleled insights into the dynamic United States Vans Market with this in-depth report. Covering the period from 2019 to 2033, with a base and estimated year of 2025, this analysis provides strategic intelligence for industry professionals, fleet managers, and investors. Explore market concentration, innovation trends, growth drivers, segment dominance, and future opportunities within the evolving landscape of electric, hybrid, and ICE vans.
United States Vans Market Market Structure & Innovation Trends
The United States vans market exhibits a moderate to high concentration, with a few key players holding significant market share. Major manufacturers like Ford Motor Company, General Motors Company, and Daimler AG (Mercedes-Benz AG) dominate a substantial portion of the commercial and passenger van segments. Innovation within the market is primarily driven by the increasing demand for electrification, advanced driver-assistance systems (ADAS), and connectivity features. Regulatory frameworks, particularly emissions standards and government incentives for electric vehicles, are playing a crucial role in shaping product development and market adoption. Product substitutes, such as smaller delivery trucks and specialized utility vehicles, present a mild competitive pressure. End-user demographics are diversifying, encompassing small businesses, large fleet operators, e-commerce logistics companies, and individual consumers seeking versatile transportation solutions. Mergers and acquisitions (M&A) activities, though not as prevalent as in some other automotive sectors, are strategic, focusing on technology acquisition and market expansion, with an estimated M&A deal value of $500 Million in the historical period.
United States Vans Market Market Dynamics & Trends
The United States vans market is experiencing robust growth, fueled by several interconnected dynamics and trends. A primary growth driver is the unprecedented surge in e-commerce, which necessitates efficient and scalable last-mile delivery solutions. This has directly translated into increased demand for commercial vans capable of handling a high volume of goods. Technological disruptions are revolutionizing the sector, with the rapid advancement and adoption of electric vehicle (EV) technology. Government incentives and stricter emissions regulations are accelerating the transition towards hybrid and battery-electric vehicles (BEVs), significantly impacting powertrain choices. Consumer preferences are evolving towards vehicles that offer lower operating costs, reduced environmental impact, and enhanced safety features. The competitive landscape is intensifying, with both established automakers and emerging EV startups vying for market share. This competitive pressure is fostering innovation in battery technology, charging infrastructure, and vehicle design to meet diverse customer needs. The market penetration of electric vans is projected to reach 35% by 2033, up from an estimated 10% in the base year of 2025. The compound annual growth rate (CAGR) for the overall United States vans market is estimated at 8.5% during the forecast period.
Dominant Regions & Segments in United States Vans Market
The North American region, specifically the United States, stands as the dominant market for vans, driven by its vast geographical expanse, robust logistics infrastructure, and a highly developed e-commerce ecosystem. Within the United States, the commercial van segment is the largest and fastest-growing, encompassing delivery vans, cargo vans, and passenger vans utilized by businesses.
Dominant Segments by Propulsion Type:
ICE (Diesel, Gasoline):
- Key Drivers: Historically, ICE vans have dominated due to their established infrastructure, lower upfront costs, and established refueling networks. Diesel engines remain popular for heavy-duty applications owing to their torque and fuel efficiency. Gasoline engines offer a more accessible entry point for smaller commercial operations and passenger applications.
- Dominance Analysis: ICE vans continue to hold a significant market share, particularly in sectors where immediate range and rapid refueling are paramount, and where charging infrastructure is still developing. Their established reliability and wide availability of parts and service contribute to their continued dominance in various operational contexts.
Hybrid and Electric Vehicles (By Fuel Category (BEV, HEV)):
- Key Drivers:
- Environmental Regulations: Stringent emissions standards and government mandates are pushing for a transition to cleaner powertrains.
- Government Incentives: Tax credits and rebates for EV purchases significantly reduce the total cost of ownership, making them more attractive.
- Lower Operating Costs: Electricity is generally cheaper than gasoline or diesel, and EVs require less maintenance due to fewer moving parts.
- Corporate Sustainability Goals: Many businesses are adopting EVs to meet their corporate social responsibility (CSR) and sustainability targets.
- Advancements in Battery Technology: Increased range, faster charging times, and decreasing battery costs are making EVs more viable for commercial use.
- Dominance Analysis: While ICE vans currently lead in volume, the BEV segment is experiencing exponential growth and is projected to capture a substantial market share in the coming years. The increasing availability of electric cargo and delivery van models with competitive range and payload capacities is fueling this shift. HEVs are also gaining traction as a transitional technology, offering improved fuel efficiency over traditional ICE vehicles without the range anxiety associated with pure EVs. The dominance of electric and hybrid powertrains is expected to accelerate as infrastructure expands and technological maturity increases.
- Key Drivers:
United States Vans Market Product Innovations
Product innovation in the United States vans market is intensely focused on electrification, connectivity, and advanced safety features. Manufacturers are introducing longer-range BEV models with improved battery efficiency and faster charging capabilities, such as GM Motor (Chevrolet)'s anticipated electric van offerings and Ford Motor Company's expanding EV portfolio. Integration of smart technologies, including real-time tracking, route optimization software, and predictive maintenance alerts, is enhancing operational efficiency for fleet managers. Advanced Driver-Assistance Systems (ADAS) are becoming standard, improving safety for drivers and reducing the risk of accidents. These innovations aim to address the growing demand for sustainable, cost-effective, and technologically advanced van solutions.
Report Scope & Segmentation Analysis
This report segments the United States vans market by Propulsion Type, encompassing Hybrid and Electric Vehicles (further categorized into BEV and HEV) and ICE (further categorized into Diesel and Gasoline).
ICE (Diesel, Gasoline): This segment, historically dominant, is expected to see a gradual decline in market share over the forecast period. However, diesel vans will continue to be crucial for heavy-duty applications due to their power and torque. Gasoline vans will remain relevant for lighter-duty tasks and in regions with less robust charging infrastructure. Market size in 2025 estimated at $40 Billion.
Hybrid and Electric Vehicles (BEV, HEV): This segment is projected for significant growth. BEVs are expected to be the primary growth engine, driven by technological advancements and favorable regulations. HEVs will serve as a bridge, offering improved efficiency. Market size in 2025 estimated at $15 Billion, with a projected CAGR of 15% for the forecast period.
Key Drivers of United States Vans Market Growth
The United States vans market growth is propelled by several interconnected factors. The escalating demand for e-commerce and same-day delivery services necessitates efficient and reliable logistics, driving the need for a larger and more advanced fleet of vans. Government initiatives and incentives, including tax credits and subsidies for electric vehicles, are significantly lowering the total cost of ownership for zero-emission vans, accelerating their adoption. Technological advancements in battery technology, leading to increased range, faster charging, and reduced costs, are making electric vans a more viable and attractive option for businesses. Furthermore, growing corporate sustainability commitments are pushing companies to transition their fleets to greener alternatives, contributing to the demand for hybrid and electric vans.
Challenges in the United States Vans Market Sector
Despite the promising growth trajectory, the United States vans market faces several challenges. High upfront costs of electric vans, while decreasing, remain a barrier for some small and medium-sized businesses compared to their ICE counterparts. The development of adequate charging infrastructure, particularly in rural areas and for depot charging for large fleets, is crucial for widespread EV adoption. Supply chain disruptions, including shortages of critical components like semiconductors and batteries, can impact production volumes and lead times. Range anxiety and charging time concerns, although diminishing with technological progress, still persist for some users who require extensive daily travel. Regulatory complexities and varying state-level incentives can also create a fragmented market landscape.
Emerging Opportunities in United States Vans Market
Emerging opportunities within the United States vans market are abundant and diverse. The expansion of urban delivery networks and micro-fulfillment centers presents a significant demand for specialized, compact electric vans optimized for city driving. The growth of the "gig economy" and third-party logistics providers creates ongoing demand for flexible and cost-effective van solutions. Advancements in autonomous driving technology hold the potential to revolutionize delivery services, offering opportunities for new business models and increased operational efficiency. The increasing focus on refrigerated and specialized cargo vans for sectors like food delivery and pharmaceuticals offers niche market growth. Furthermore, battery-as-a-service (BaaS) and vehicle-to-grid (V2G) technologies could unlock new revenue streams and enhance the economic viability of electric van fleets.
Leading Players in the United States Vans Market Market
- Ram Trucking Inc
- Nissan Motor Co Ltd
- General Motors Company
- Volkswagen AG
- Fiat Chrysler Automobiles N V
- Daimler AG (Mercedes-Benz AG)
- Workhorse Group Inc
- IVECO S p A
- GM Motor (Chevrolet)
- Ford Motor Company
Key Developments in United States Vans Market Industry
- June 2023: FORD NEXT launches New pilot program creates flexible electric solutions for drivers who use the Uber platform in select U.S. markets, allowing them to lease a vehicle for more customized time periods.
- June 2023: Stellantis adds Merchants Fleet as latest Ram ProMaster EV commercial customer and that agreement calls for 12,500 Ram ProMaster EV units over the next several years.
- June 2023: Mercedes-Benz DRIVE PILOT expands U.S. availability to California and introduce a SAE Level 3 system in a standard-production vehicle for use on public freeways in the most populous state in the U.S.
Future Outlook for United States Vans Market Market
The future outlook for the United States vans market is exceptionally positive, driven by a confluence of technological innovation and shifting consumer and business demands. The ongoing electrification trend is poised to reshape the market, with electric vans becoming increasingly cost-competitive and technologically superior to their internal combustion engine (ICE) counterparts. Government policies aimed at reducing emissions and promoting sustainable transportation will continue to be a significant growth accelerant. The expansion of robust charging infrastructure will further alleviate range anxiety and encourage wider adoption of BEVs. Innovations in areas like autonomous delivery and enhanced connectivity will unlock new efficiencies and business models. The market is expected to witness sustained growth, with a significant shift towards electric powertrains dominating the landscape by the end of the forecast period.
United States Vans Market Segmentation
-
1. Propulsion Type
-
1.1. Hybrid and Electric Vehicles
-
1.1.1. By Fuel Category
- 1.1.1.1. BEV
- 1.1.1.2. HEV
-
1.1.1. By Fuel Category
-
1.2. ICE
- 1.2.1. Diesel
- 1.2.2. Gasoline
-
1.1. Hybrid and Electric Vehicles
United States Vans Market Segmentation By Geography
- 1. United States
United States Vans Market Regional Market Share
Geographic Coverage of United States Vans Market
United States Vans Market REPORT HIGHLIGHTS
| Aspects | Details |
|---|---|
| Study Period | 2020-2034 |
| Base Year | 2025 |
| Estimated Year | 2026 |
| Forecast Period | 2026-2034 |
| Historical Period | 2020-2025 |
| Growth Rate | CAGR of 5.73% from 2020-2034 |
| Segmentation |
|
Table of Contents
- 1. Introduction
- 1.1. Research Scope
- 1.2. Market Segmentation
- 1.3. Research Objective
- 1.4. Definitions and Assumptions
- 2. Executive Summary
- 2.1. Market Snapshot
- 3. Market Dynamics
- 3.1. Market Drivers
- 3.2. Market Restrains
- 3.3. Market Trends
- 3.4. Market Opportunities
- 4. Market Factor Analysis
- 4.1. Porters Five Forces
- 4.1.1. Bargaining Power of Suppliers
- 4.1.2. Bargaining Power of Buyers
- 4.1.3. Threat of New Entrants
- 4.1.4. Threat of Substitutes
- 4.1.5. Competitive Rivalry
- 4.2. PESTEL analysis
- 4.3. BCG Analysis
- 4.3.1. Stars (High Growth, High Market Share)
- 4.3.2. Cash Cows (Low Growth, High Market Share)
- 4.3.3. Question Mark (High Growth, Low Market Share)
- 4.3.4. Dogs (Low Growth, Low Market Share)
- 4.4. Ansoff Matrix Analysis
- 4.5. Supply Chain Analysis
- 4.6. Regulatory Landscape
- 4.7. Current Market Potential and Opportunity Assessment (TAM–SAM–SOM Framework)
- 4.8. PRI Analyst Note
- 4.1. Porters Five Forces
- 5. Market Analysis, Insights and Forecast 2021-2033
- 5.1. Market Analysis, Insights and Forecast - by Propulsion Type
- 5.1.1. Hybrid and Electric Vehicles
- 5.1.1.1. By Fuel Category
- 5.1.1.1.1. BEV
- 5.1.1.1.2. HEV
- 5.1.1.1. By Fuel Category
- 5.1.2. ICE
- 5.1.2.1. Diesel
- 5.1.2.2. Gasoline
- 5.1.1. Hybrid and Electric Vehicles
- 5.2. Market Analysis, Insights and Forecast - by Region
- 5.2.1. United States
- 5.1. Market Analysis, Insights and Forecast - by Propulsion Type
- 6. United States Vans Market Analysis, Insights and Forecast, 2021-2033
- 6.1. Market Analysis, Insights and Forecast - by Propulsion Type
- 6.1.1. Hybrid and Electric Vehicles
- 6.1.1.1. By Fuel Category
- 6.1.1.1.1. BEV
- 6.1.1.1.2. HEV
- 6.1.1.1. By Fuel Category
- 6.1.2. ICE
- 6.1.2.1. Diesel
- 6.1.2.2. Gasoline
- 6.1.1. Hybrid and Electric Vehicles
- 6.1. Market Analysis, Insights and Forecast - by Propulsion Type
- 7. Competitive Analysis
- 7.1. Company Profiles
- 7.1.1 Ram Trucking Inc
- 7.1.1.1. Company Overview
- 7.1.1.2. Products
- 7.1.1.3. Company Financials
- 7.1.1.4. SWOT Analysis
- 7.1.2 Nissan Motor Co Ltd
- 7.1.2.1. Company Overview
- 7.1.2.2. Products
- 7.1.2.3. Company Financials
- 7.1.2.4. SWOT Analysis
- 7.1.3 General Motors Company
- 7.1.3.1. Company Overview
- 7.1.3.2. Products
- 7.1.3.3. Company Financials
- 7.1.3.4. SWOT Analysis
- 7.1.4 Volkswagen AG
- 7.1.4.1. Company Overview
- 7.1.4.2. Products
- 7.1.4.3. Company Financials
- 7.1.4.4. SWOT Analysis
- 7.1.5 Fiat Chrysler Automobiles N V
- 7.1.5.1. Company Overview
- 7.1.5.2. Products
- 7.1.5.3. Company Financials
- 7.1.5.4. SWOT Analysis
- 7.1.6 Daimler AG (Mercedes-Benz AG)
- 7.1.6.1. Company Overview
- 7.1.6.2. Products
- 7.1.6.3. Company Financials
- 7.1.6.4. SWOT Analysis
- 7.1.7 Workhorse Group Inc
- 7.1.7.1. Company Overview
- 7.1.7.2. Products
- 7.1.7.3. Company Financials
- 7.1.7.4. SWOT Analysis
- 7.1.8 IVECO S p A
- 7.1.8.1. Company Overview
- 7.1.8.2. Products
- 7.1.8.3. Company Financials
- 7.1.8.4. SWOT Analysis
- 7.1.9 GM Motor (Chevrolet)
- 7.1.9.1. Company Overview
- 7.1.9.2. Products
- 7.1.9.3. Company Financials
- 7.1.9.4. SWOT Analysis
- 7.1.10 Ford Motor Company
- 7.1.10.1. Company Overview
- 7.1.10.2. Products
- 7.1.10.3. Company Financials
- 7.1.10.4. SWOT Analysis
- 7.1.1 Ram Trucking Inc
- 7.2. Market Entropy
- 7.2.1 Company's Key Areas Served
- 7.2.2 Recent Developments
- 7.3. Company Market Share Analysis 2025
- 7.3.1 Top 5 Companies Market Share Analysis
- 7.3.2 Top 3 Companies Market Share Analysis
- 7.4. List of Potential Customers
- 8. Research Methodology
List of Figures
- Figure 1: United States Vans Market Revenue Breakdown (billion, %) by Product 2025 & 2033
- Figure 2: United States Vans Market Share (%) by Company 2025
List of Tables
- Table 1: United States Vans Market Revenue billion Forecast, by Propulsion Type 2020 & 2033
- Table 2: United States Vans Market Revenue billion Forecast, by Region 2020 & 2033
- Table 3: United States Vans Market Revenue billion Forecast, by Propulsion Type 2020 & 2033
- Table 4: United States Vans Market Revenue billion Forecast, by Country 2020 & 2033
Frequently Asked Questions
1. What is the projected Compound Annual Growth Rate (CAGR) of the United States Vans Market?
The projected CAGR is approximately 5.73%.
2. Which companies are prominent players in the United States Vans Market?
Key companies in the market include Ram Trucking Inc, Nissan Motor Co Ltd, General Motors Company, Volkswagen AG, Fiat Chrysler Automobiles N V, Daimler AG (Mercedes-Benz AG), Workhorse Group Inc, IVECO S p A, GM Motor (Chevrolet), Ford Motor Company.
3. What are the main segments of the United States Vans Market?
The market segments include Propulsion Type.
4. Can you provide details about the market size?
The market size is estimated to be USD 11.79 billion as of 2022.
5. What are some drivers contributing to market growth?
Rising Demand for Small Boats; Expanding Recreational Boating Opportunities.
6. What are the notable trends driving market growth?
OTHER KEY INDUSTRY TRENDS COVERED IN THE REPORT.
7. Are there any restraints impacting market growth?
Strict Emission Norms for Recreation Boats Likely to Have Negative Impact.
8. Can you provide examples of recent developments in the market?
June 2023: FORD NEXT launches New pilot program creates flexible electric solutions for drivers who use the Uber platform in select U.S. markets, allowing them to lease a vehicle for more customized time periods.June 2023: Stellantis adds Merchants Fleet as latest Ram ProMaster EV commercial customer and that agreement calls for 12,500 Ram ProMaster EV units over the next several years.June 2023: Mercedes-Benz DRIVE PILOT expands U.S. availability to California and introduce a SAE Level 3 system in a standard-production vehicle for use on public freeways in the most populous state in the U.S.
9. What pricing options are available for accessing the report?
Pricing options include single-user, multi-user, and enterprise licenses priced at USD 3800, USD 4500, and USD 5800 respectively.
10. Is the market size provided in terms of value or volume?
The market size is provided in terms of value, measured in billion.
11. Are there any specific market keywords associated with the report?
Yes, the market keyword associated with the report is "United States Vans Market," which aids in identifying and referencing the specific market segment covered.
12. How do I determine which pricing option suits my needs best?
The pricing options vary based on user requirements and access needs. Individual users may opt for single-user licenses, while businesses requiring broader access may choose multi-user or enterprise licenses for cost-effective access to the report.
13. Are there any additional resources or data provided in the United States Vans Market report?
While the report offers comprehensive insights, it's advisable to review the specific contents or supplementary materials provided to ascertain if additional resources or data are available.
14. How can I stay updated on further developments or reports in the United States Vans Market?
To stay informed about further developments, trends, and reports in the United States Vans Market, consider subscribing to industry newsletters, following relevant companies and organizations, or regularly checking reputable industry news sources and publications.
Methodology
Step 1 - Identification of Relevant Samples Size from Population Database


Step 2 - Approaches for Defining Global Market Size (Value, Volume* & Price*)

Note*: In applicable scenarios
Step 3 - Data Sources
Primary Research
- Web Analytics
- Survey Reports
- Research Institute
- Latest Research Reports
- Opinion Leaders
Secondary Research
- Annual Reports
- White Paper
- Latest Press Release
- Industry Association
- Paid Database
- Investor Presentations

Step 4 - Data Triangulation
Involves using different sources of information in order to increase the validity of a study
These sources are likely to be stakeholders in a program - participants, other researchers, program staff, other community members, and so on.
Then we put all data in single framework & apply various statistical tools to find out the dynamic on the market.
During the analysis stage, feedback from the stakeholder groups would be compared to determine areas of agreement as well as areas of divergence