

Key Insights
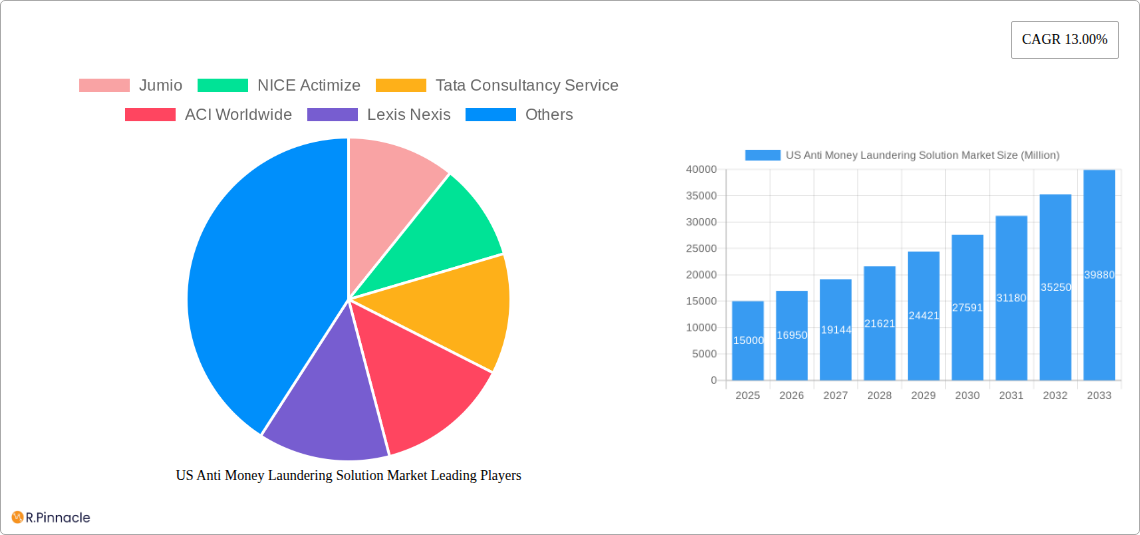
The United States Anti-Money Laundering (AML) Solutions market is projected for significant expansion, propelled by intensified regulatory oversight, escalating financial crime sophistication, and the pervasive digital economy. With an estimated market size of $4.13 billion in the base year of 2025, the market is anticipated to experience a Compound Annual Growth Rate (CAGR) of 17.8% through 2033. This robust growth is attributed to the escalating complexity of financial crimes demanding advanced AML tools, stringent compliance mandates within the U.S. financial sector, and the increased vulnerability to money laundering associated with the proliferation of digital transactions. Key market segments include Know Your Customer (KYC) systems, compliance reporting solutions, and transaction monitoring software, with cloud-based deployments gaining prominence for their scalability and cost-efficiency. Leading providers such as Jumio, NICE Actimize, and Tata Consultancy Services are instrumental in driving innovation and competitive offerings.
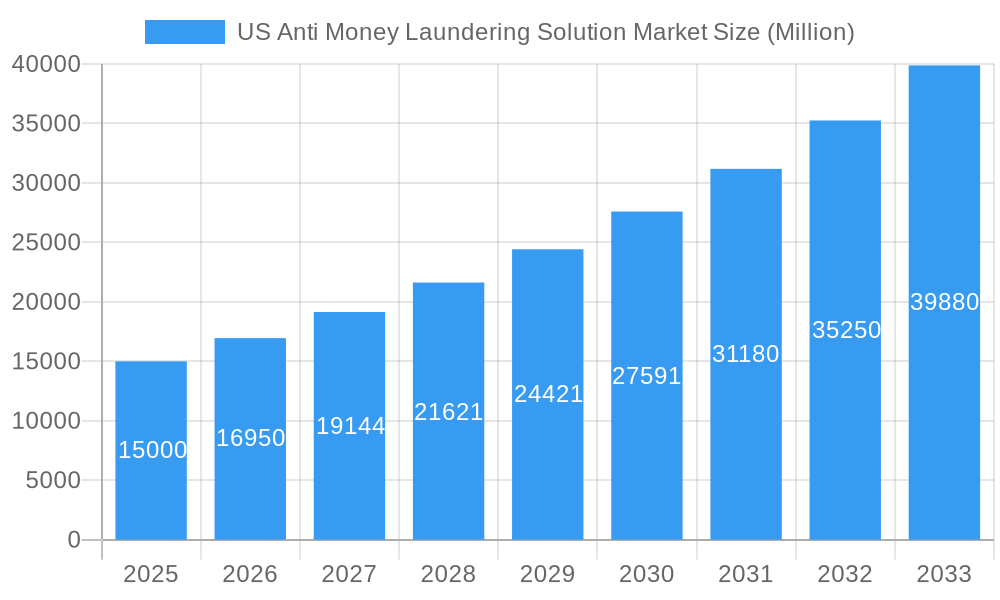
US Anti Money Laundering Solution Market Market Size (In Billion)
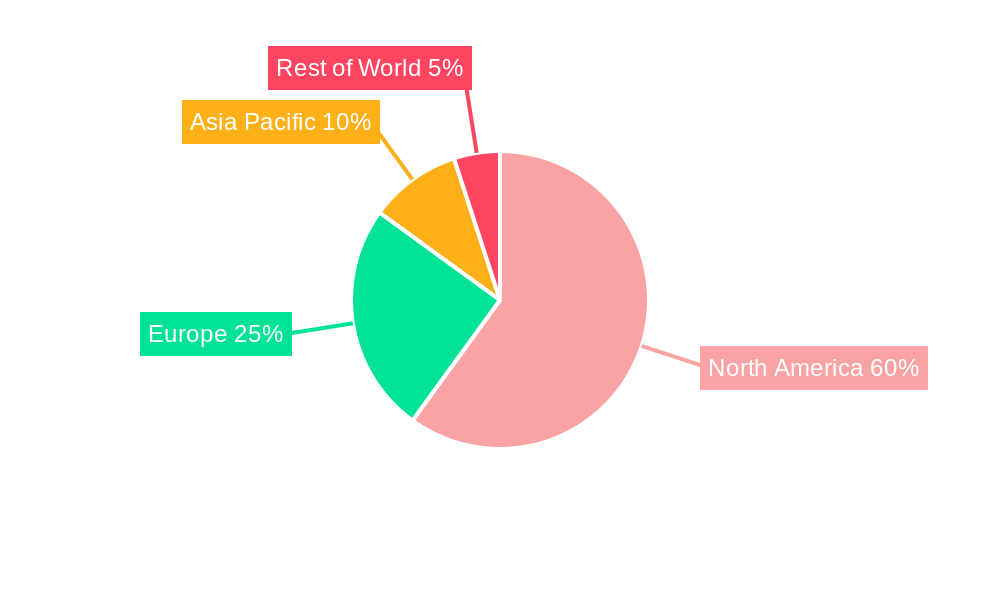
Future market trajectory will be further shaped by advancements in AI-driven fraud detection, blockchain for enhanced transparency, and the increasing adoption of RegTech solutions. While implementation costs, system integration complexities, and evolving money laundering tactics present challenges, the heightened awareness of financial crime risks and the non-negotiable need for regulatory adherence are poised to ensure sustained market growth. The North American region, particularly the U.S., is expected to maintain its leadership position, underpinned by its dynamic financial industry and rigorous regulatory landscape.
US Anti Money Laundering Solution Market Company Market Share
US Anti-Money Laundering (AML) Solution Market Report: 2019-2033
This comprehensive report provides a detailed analysis of the US Anti-Money Laundering (AML) Solution market, offering invaluable insights for industry professionals, investors, and strategic decision-makers. The study period covers 2019-2033, with a base year of 2025 and a forecast period of 2025-2033. The report leverages extensive market research to deliver actionable intelligence, focusing on market size, growth drivers, challenges, and future opportunities. Key players like Jumio, NICE Actimize, Tata Consultancy Services, and more are analyzed, alongside segment breakdowns by solution type, deployment model, and industry. The report also incorporates key industry developments, providing a current and forward-looking perspective.
US Anti-Money Laundering Solution Market Structure & Innovation Trends
The US AML solution market exhibits a moderately concentrated structure, with a few major players holding significant market share. However, a number of smaller, niche players also contribute to the overall market landscape. The market is driven by increasing regulatory scrutiny, rising cyber threats, and the need for robust compliance frameworks across various sectors. Innovation is fueled by advancements in AI, machine learning, and big data analytics, leading to more sophisticated and efficient AML solutions. The regulatory framework, including the Bank Secrecy Act (BSA) and the USA PATRIOT Act, significantly impacts market growth and drives demand for compliant solutions. Product substitutes are limited, mainly due to the stringent regulatory compliance requirements specific to AML solutions. End-users span diverse industries, including finance, gaming, and real estate, each with specific compliance needs.
Mergers and acquisitions (M&A) activity is a key aspect of market dynamics. While precise deal values are not publicly available for all transactions, we estimate that M&A activity in the period from 2019-2024 contributed to a xx Million increase in market concentration. Specific examples include the acquisition of Sentinels by Fenergo in March 2022.
- Market Concentration: Moderately concentrated, with a few dominant players and several smaller niche players.
- Innovation Drivers: AI, machine learning, big data analytics.
- Regulatory Framework: BSA, USA PATRIOT Act, and other relevant regulations.
- M&A Activity: Significant consolidation observed, with estimated xx Million in deal value from 2019-2024 (data reflects publicly disclosed and estimated values).
US Anti-Money Laundering Solution Market Dynamics & Trends
The US AML solution market is experiencing robust growth, driven by several factors. Increasing regulatory pressure, particularly following high-profile financial crimes, is a major catalyst. The rising sophistication of financial crime necessitates advanced technological solutions capable of detecting and preventing money laundering activities. Consumer preference is shifting towards cloud-based solutions for enhanced scalability, flexibility, and cost-effectiveness. This preference is further fueled by the growing adoption of digital financial services and increased reliance on technology. The market is characterized by intense competition, with established players and innovative startups vying for market share. Technological advancements constantly reshape the competitive landscape, necessitating continuous innovation and adaptation.
The Compound Annual Growth Rate (CAGR) for the market is projected at xx% during the forecast period (2025-2033), reflecting a significant expansion in market size from xx Million in 2025 to xx Million by 2033. Market penetration remains relatively high in the financial sector but is expanding into other industries, such as gaming and real estate.
Dominant Regions & Segments in US Anti-Money Laundering Solution Market
The US AML solution market is geographically concentrated, with major metropolitan areas and financial hubs exhibiting the highest demand. Key factors contributing to this dominance include higher concentrations of financial institutions, robust regulatory frameworks, and greater technological adoption.
By Solution: The Know Your Customer (KYC) system segment holds the largest market share, followed by Transaction Monitoring and Compliance Reporting. This is due to the fundamental nature of KYC in AML compliance and the critical role of transaction monitoring in detecting suspicious activities.
By Type: The Software segment dominates due to the flexibility and scalability it offers. However, the Services segment is also experiencing strong growth, driven by the increasing need for expert consultation and implementation support.
By Deployment Model: The On-Cloud segment is gaining traction due to its cost-effectiveness and scalability. However, On-Premise deployments remain significant, especially within organizations with strict data security and compliance requirements.
Key Drivers:
- Stringent Regulatory Environment: The presence of strict regulations drives the adoption of AML solutions.
- Technological Advancements: Innovations in AI, machine learning, and big data analytics enhance the effectiveness of AML solutions.
- Rising Cyber Threats: The increasing frequency and sophistication of cyberattacks necessitates advanced AML solutions to protect against financial crimes.
- Growing Digitalization of Financial Services: The shift towards digital banking and fintech increases the need for robust AML systems.
US Anti-Money Laundering Solution Market Product Innovations
Recent product developments emphasize AI-powered solutions, enhanced transaction monitoring capabilities, and improved KYC processes. These innovations provide competitive advantages by offering greater accuracy, efficiency, and scalability. The market is seeing a trend towards integrated platforms that combine various AML functionalities into a single solution, reducing complexity and improving workflow. These integrated systems often leverage machine learning to analyze large volumes of data and identify potential money laundering activities more efficiently.
Report Scope & Segmentation Analysis
This report comprehensively analyzes the US AML solution market across various segments:
By Solution: Know Your Customer (KYC) System, Compliance Reporting, Transaction Monitoring, Auditing and Reporting, Other Solutions. Each segment's growth is driven by unique factors and possesses different market dynamics.
By Type: Software and Services. Software solutions dominate due to scalability, while services are crucial for implementation and maintenance.
By Deployment Model: On-Cloud and On-Premise. The Cloud segment shows faster growth due to its flexibility and cost-effectiveness. Each segment exhibits distinct growth projections and competitive dynamics, providing a detailed market overview.
Key Drivers of US Anti-Money Laundering Solution Market Growth
The market's growth is driven by several factors:
- Stringent Regulations: Increased regulatory scrutiny and penalties for non-compliance.
- Technological Advancements: AI, machine learning, and big data analytics improve detection capabilities.
- Rising Cybercrime: The sophistication of financial crimes necessitates advanced AML solutions.
- Expansion of Digital Finance: The growth of online and mobile banking increases vulnerability to money laundering.
Challenges in the US Anti-Money Laundering Solution Market Sector
The market faces challenges, including:
- High Implementation Costs: Implementing and maintaining AML solutions can be expensive.
- Data Privacy Concerns: Balancing AML compliance with data privacy regulations presents challenges.
- Keeping up with evolving regulations: Regulatory changes require continuous adaptation of solutions.
- Integration complexities: Integrating AML solutions with existing systems can be complex and time-consuming.
Emerging Opportunities in US Anti-Money Laundering Solution Market
Emerging opportunities include:
- Expansion into new sectors: AML solutions are expanding into sectors like cryptocurrency and gaming.
- Adoption of advanced technologies: AI and blockchain offer new opportunities for improved AML.
- Growth of managed services: Demand for managed AML services is increasing.
Leading Players in the US Anti-Money Laundering Solution Market Market
- Jumio
- NICE Actimize
- Tata Consultancy Services
- ACI Worldwide
- LexisNexis
- Oracle Corporation
- Signicat
- Trust Stamp
- Trulioo
- Deloitte
Key Developments in US Anti-Money Laundering Solution Market Industry
- June 2022: ACI Worldwide divested its ACI Digital Business Banking solutions to One Equity Partners. This impacts the market by shifting focus and potentially altering competitive dynamics.
- March 2022: Sentinels, a transaction monitoring solution provider, was acquired by Fenergo. This consolidation signifies a trend toward larger players acquiring specialized AML technology providers.
Future Outlook for US Anti Money Laundering Solution Market Market
The US Anti-Money Laundering (AML) solution market is projected to experience robust and sustained expansion in the coming years. This growth trajectory is fueled by a dynamic interplay of evolving regulatory landscapes, continuous technological advancements, and the ever-increasing complexity of financial crime typologies. Key drivers include the proactive adaptation by financial institutions to new compliance mandates and the growing imperative to combat sophisticated money laundering schemes. Strategic opportunities abound for solution providers to innovate and capitalize on emerging trends. The development and deployment of advanced Artificial Intelligence (AI) and Machine Learning (ML) powered solutions are paramount, offering enhanced efficiency and accuracy in transaction monitoring, risk assessment, and fraud detection. Expanding service offerings into adjacent sectors beyond traditional banking, such as FinTech, cryptocurrencies, and digital asset management, presents significant growth avenues. Furthermore, the demand for comprehensive managed services, allowing organizations to outsource their AML compliance burdens to specialized providers, is set to escalate. The market landscape is also anticipated to undergo further consolidation, with strategic mergers and acquisitions becoming a prominent feature. These M&A activities will enable companies to broaden their technological capabilities, diversify their client bases, and solidify their market share in an increasingly competitive environment. The emphasis will remain on delivering scalable, adaptable, and intelligent solutions that empower businesses to effectively mitigate AML risks and maintain regulatory adherence.
US Anti Money Laundering Solution Market Segmentation
-
1. Solution
- 1.1. Know Your Customers (KYC) System
- 1.2. Compliance Reporting
- 1.3. Transaction Monitoring
- 1.4. Auditing and Reporting
- 1.5. Other Solutions
-
2. Type
- 2.1. Software
- 2.2. Services
-
3. Deployment Model
- 3.1. On-Cloud
- 3.2. On-Premise
US Anti Money Laundering Solution Market Segmentation By Geography
-
1. North America
- 1.1. United States
- 1.2. Canada
- 1.3. Mexico
-
2. South America
- 2.1. Brazil
- 2.2. Argentina
- 2.3. Rest of South America
-
3. Europe
- 3.1. United Kingdom
- 3.2. Germany
- 3.3. France
- 3.4. Italy
- 3.5. Spain
- 3.6. Russia
- 3.7. Benelux
- 3.8. Nordics
- 3.9. Rest of Europe
-
4. Middle East & Africa
- 4.1. Turkey
- 4.2. Israel
- 4.3. GCC
- 4.4. North Africa
- 4.5. South Africa
- 4.6. Rest of Middle East & Africa
-
5. Asia Pacific
- 5.1. China
- 5.2. India
- 5.3. Japan
- 5.4. South Korea
- 5.5. ASEAN
- 5.6. Oceania
- 5.7. Rest of Asia Pacific
US Anti Money Laundering Solution Market Regional Market Share
Geographic Coverage of US Anti Money Laundering Solution Market
US Anti Money Laundering Solution Market REPORT HIGHLIGHTS
| Aspects | Details |
|---|---|
| Study Period | 2020-2034 |
| Base Year | 2025 |
| Estimated Year | 2026 |
| Forecast Period | 2026-2034 |
| Historical Period | 2020-2025 |
| Growth Rate | CAGR of 17.8% from 2020-2034 |
| Segmentation |
|
Table of Contents
- 1. Introduction
- 1.1. Research Scope
- 1.2. Market Segmentation
- 1.3. Research Objective
- 1.4. Definitions and Assumptions
- 2. Executive Summary
- 2.1. Market Snapshot
- 3. Market Dynamics
- 3.1. Market Drivers
- 3.2. Market Restrains
- 3.3. Market Trends
- 3.4. Market Opportunities
- 4. Market Factor Analysis
- 4.1. Porters Five Forces
- 4.1.1. Bargaining Power of Suppliers
- 4.1.2. Bargaining Power of Buyers
- 4.1.3. Threat of New Entrants
- 4.1.4. Threat of Substitutes
- 4.1.5. Competitive Rivalry
- 4.2. PESTEL analysis
- 4.3. BCG Analysis
- 4.3.1. Stars (High Growth, High Market Share)
- 4.3.2. Cash Cows (Low Growth, High Market Share)
- 4.3.3. Question Mark (High Growth, Low Market Share)
- 4.3.4. Dogs (Low Growth, Low Market Share)
- 4.4. Ansoff Matrix Analysis
- 4.5. Supply Chain Analysis
- 4.6. Regulatory Landscape
- 4.7. Current Market Potential and Opportunity Assessment (TAM–SAM–SOM Framework)
- 4.8. PRI Analyst Note
- 4.1. Porters Five Forces
- 5. Market Analysis, Insights and Forecast 2021-2033
- 5.1. Market Analysis, Insights and Forecast - by Solution
- 5.1.1. Know Your Customers (KYC) System
- 5.1.2. Compliance Reporting
- 5.1.3. Transaction Monitoring
- 5.1.4. Auditing and Reporting
- 5.1.5. Other Solutions
- 5.2. Market Analysis, Insights and Forecast - by Type
- 5.2.1. Software
- 5.2.2. Services
- 5.3. Market Analysis, Insights and Forecast - by Deployment Model
- 5.3.1. On-Cloud
- 5.3.2. On-Premise
- 5.4. Market Analysis, Insights and Forecast - by Region
- 5.4.1. North America
- 5.4.2. South America
- 5.4.3. Europe
- 5.4.4. Middle East & Africa
- 5.4.5. Asia Pacific
- 5.1. Market Analysis, Insights and Forecast - by Solution
- 6. Global US Anti Money Laundering Solution Market Analysis, Insights and Forecast, 2021-2033
- 6.1. Market Analysis, Insights and Forecast - by Solution
- 6.1.1. Know Your Customers (KYC) System
- 6.1.2. Compliance Reporting
- 6.1.3. Transaction Monitoring
- 6.1.4. Auditing and Reporting
- 6.1.5. Other Solutions
- 6.2. Market Analysis, Insights and Forecast - by Type
- 6.2.1. Software
- 6.2.2. Services
- 6.3. Market Analysis, Insights and Forecast - by Deployment Model
- 6.3.1. On-Cloud
- 6.3.2. On-Premise
- 6.1. Market Analysis, Insights and Forecast - by Solution
- 7. North America US Anti Money Laundering Solution Market Analysis, Insights and Forecast, 2020-2032
- 7.1. Market Analysis, Insights and Forecast - by Solution
- 7.1.1. Know Your Customers (KYC) System
- 7.1.2. Compliance Reporting
- 7.1.3. Transaction Monitoring
- 7.1.4. Auditing and Reporting
- 7.1.5. Other Solutions
- 7.2. Market Analysis, Insights and Forecast - by Type
- 7.2.1. Software
- 7.2.2. Services
- 7.3. Market Analysis, Insights and Forecast - by Deployment Model
- 7.3.1. On-Cloud
- 7.3.2. On-Premise
- 7.1. Market Analysis, Insights and Forecast - by Solution
- 8. South America US Anti Money Laundering Solution Market Analysis, Insights and Forecast, 2020-2032
- 8.1. Market Analysis, Insights and Forecast - by Solution
- 8.1.1. Know Your Customers (KYC) System
- 8.1.2. Compliance Reporting
- 8.1.3. Transaction Monitoring
- 8.1.4. Auditing and Reporting
- 8.1.5. Other Solutions
- 8.2. Market Analysis, Insights and Forecast - by Type
- 8.2.1. Software
- 8.2.2. Services
- 8.3. Market Analysis, Insights and Forecast - by Deployment Model
- 8.3.1. On-Cloud
- 8.3.2. On-Premise
- 8.1. Market Analysis, Insights and Forecast - by Solution
- 9. Europe US Anti Money Laundering Solution Market Analysis, Insights and Forecast, 2020-2032
- 9.1. Market Analysis, Insights and Forecast - by Solution
- 9.1.1. Know Your Customers (KYC) System
- 9.1.2. Compliance Reporting
- 9.1.3. Transaction Monitoring
- 9.1.4. Auditing and Reporting
- 9.1.5. Other Solutions
- 9.2. Market Analysis, Insights and Forecast - by Type
- 9.2.1. Software
- 9.2.2. Services
- 9.3. Market Analysis, Insights and Forecast - by Deployment Model
- 9.3.1. On-Cloud
- 9.3.2. On-Premise
- 9.1. Market Analysis, Insights and Forecast - by Solution
- 10. Middle East & Africa US Anti Money Laundering Solution Market Analysis, Insights and Forecast, 2020-2032
- 10.1. Market Analysis, Insights and Forecast - by Solution
- 10.1.1. Know Your Customers (KYC) System
- 10.1.2. Compliance Reporting
- 10.1.3. Transaction Monitoring
- 10.1.4. Auditing and Reporting
- 10.1.5. Other Solutions
- 10.2. Market Analysis, Insights and Forecast - by Type
- 10.2.1. Software
- 10.2.2. Services
- 10.3. Market Analysis, Insights and Forecast - by Deployment Model
- 10.3.1. On-Cloud
- 10.3.2. On-Premise
- 10.1. Market Analysis, Insights and Forecast - by Solution
- 11. Asia Pacific US Anti Money Laundering Solution Market Analysis, Insights and Forecast, 2020-2032
- 11.1. Market Analysis, Insights and Forecast - by Solution
- 11.1.1. Know Your Customers (KYC) System
- 11.1.2. Compliance Reporting
- 11.1.3. Transaction Monitoring
- 11.1.4. Auditing and Reporting
- 11.1.5. Other Solutions
- 11.2. Market Analysis, Insights and Forecast - by Type
- 11.2.1. Software
- 11.2.2. Services
- 11.3. Market Analysis, Insights and Forecast - by Deployment Model
- 11.3.1. On-Cloud
- 11.3.2. On-Premise
- 11.1. Market Analysis, Insights and Forecast - by Solution
- 12. Competitive Analysis
- 12.1. Company Profiles
- 12.1.1 Jumio
- 12.1.1.1. Company Overview
- 12.1.1.2. Products
- 12.1.1.3. Company Financials
- 12.1.1.4. SWOT Analysis
- 12.1.2 NICE Actimize
- 12.1.2.1. Company Overview
- 12.1.2.2. Products
- 12.1.2.3. Company Financials
- 12.1.2.4. SWOT Analysis
- 12.1.3 Tata Consultancy Service
- 12.1.3.1. Company Overview
- 12.1.3.2. Products
- 12.1.3.3. Company Financials
- 12.1.3.4. SWOT Analysis
- 12.1.4 ACI Worldwide
- 12.1.4.1. Company Overview
- 12.1.4.2. Products
- 12.1.4.3. Company Financials
- 12.1.4.4. SWOT Analysis
- 12.1.5 Lexis Nexis
- 12.1.5.1. Company Overview
- 12.1.5.2. Products
- 12.1.5.3. Company Financials
- 12.1.5.4. SWOT Analysis
- 12.1.6 Oracle Corporation
- 12.1.6.1. Company Overview
- 12.1.6.2. Products
- 12.1.6.3. Company Financials
- 12.1.6.4. SWOT Analysis
- 12.1.7 Signicat**List Not Exhaustive
- 12.1.7.1. Company Overview
- 12.1.7.2. Products
- 12.1.7.3. Company Financials
- 12.1.7.4. SWOT Analysis
- 12.1.8 Trust Stamp
- 12.1.8.1. Company Overview
- 12.1.8.2. Products
- 12.1.8.3. Company Financials
- 12.1.8.4. SWOT Analysis
- 12.1.9 Trulioo
- 12.1.9.1. Company Overview
- 12.1.9.2. Products
- 12.1.9.3. Company Financials
- 12.1.9.4. SWOT Analysis
- 12.1.10 Deloitte
- 12.1.10.1. Company Overview
- 12.1.10.2. Products
- 12.1.10.3. Company Financials
- 12.1.10.4. SWOT Analysis
- 12.1.1 Jumio
- 12.2. Market Entropy
- 12.2.1 Company's Key Areas Served
- 12.2.2 Recent Developments
- 12.3. Company Market Share Analysis 2025
- 12.3.1 Top 5 Companies Market Share Analysis
- 12.3.2 Top 3 Companies Market Share Analysis
- 12.4. List of Potential Customers
- 13. Research Methodology
List of Figures
- Figure 1: Global US Anti Money Laundering Solution Market Revenue Breakdown (billion, %) by Region 2025 & 2033
- Figure 2: North America US Anti Money Laundering Solution Market Revenue (billion), by Solution 2025 & 2033
- Figure 3: North America US Anti Money Laundering Solution Market Revenue Share (%), by Solution 2025 & 2033
- Figure 4: North America US Anti Money Laundering Solution Market Revenue (billion), by Type 2025 & 2033
- Figure 5: North America US Anti Money Laundering Solution Market Revenue Share (%), by Type 2025 & 2033
- Figure 6: North America US Anti Money Laundering Solution Market Revenue (billion), by Deployment Model 2025 & 2033
- Figure 7: North America US Anti Money Laundering Solution Market Revenue Share (%), by Deployment Model 2025 & 2033
- Figure 8: North America US Anti Money Laundering Solution Market Revenue (billion), by Country 2025 & 2033
- Figure 9: North America US Anti Money Laundering Solution Market Revenue Share (%), by Country 2025 & 2033
- Figure 10: South America US Anti Money Laundering Solution Market Revenue (billion), by Solution 2025 & 2033
- Figure 11: South America US Anti Money Laundering Solution Market Revenue Share (%), by Solution 2025 & 2033
- Figure 12: South America US Anti Money Laundering Solution Market Revenue (billion), by Type 2025 & 2033
- Figure 13: South America US Anti Money Laundering Solution Market Revenue Share (%), by Type 2025 & 2033
- Figure 14: South America US Anti Money Laundering Solution Market Revenue (billion), by Deployment Model 2025 & 2033
- Figure 15: South America US Anti Money Laundering Solution Market Revenue Share (%), by Deployment Model 2025 & 2033
- Figure 16: South America US Anti Money Laundering Solution Market Revenue (billion), by Country 2025 & 2033
- Figure 17: South America US Anti Money Laundering Solution Market Revenue Share (%), by Country 2025 & 2033
- Figure 18: Europe US Anti Money Laundering Solution Market Revenue (billion), by Solution 2025 & 2033
- Figure 19: Europe US Anti Money Laundering Solution Market Revenue Share (%), by Solution 2025 & 2033
- Figure 20: Europe US Anti Money Laundering Solution Market Revenue (billion), by Type 2025 & 2033
- Figure 21: Europe US Anti Money Laundering Solution Market Revenue Share (%), by Type 2025 & 2033
- Figure 22: Europe US Anti Money Laundering Solution Market Revenue (billion), by Deployment Model 2025 & 2033
- Figure 23: Europe US Anti Money Laundering Solution Market Revenue Share (%), by Deployment Model 2025 & 2033
- Figure 24: Europe US Anti Money Laundering Solution Market Revenue (billion), by Country 2025 & 2033
- Figure 25: Europe US Anti Money Laundering Solution Market Revenue Share (%), by Country 2025 & 2033
- Figure 26: Middle East & Africa US Anti Money Laundering Solution Market Revenue (billion), by Solution 2025 & 2033
- Figure 27: Middle East & Africa US Anti Money Laundering Solution Market Revenue Share (%), by Solution 2025 & 2033
- Figure 28: Middle East & Africa US Anti Money Laundering Solution Market Revenue (billion), by Type 2025 & 2033
- Figure 29: Middle East & Africa US Anti Money Laundering Solution Market Revenue Share (%), by Type 2025 & 2033
- Figure 30: Middle East & Africa US Anti Money Laundering Solution Market Revenue (billion), by Deployment Model 2025 & 2033
- Figure 31: Middle East & Africa US Anti Money Laundering Solution Market Revenue Share (%), by Deployment Model 2025 & 2033
- Figure 32: Middle East & Africa US Anti Money Laundering Solution Market Revenue (billion), by Country 2025 & 2033
- Figure 33: Middle East & Africa US Anti Money Laundering Solution Market Revenue Share (%), by Country 2025 & 2033
- Figure 34: Asia Pacific US Anti Money Laundering Solution Market Revenue (billion), by Solution 2025 & 2033
- Figure 35: Asia Pacific US Anti Money Laundering Solution Market Revenue Share (%), by Solution 2025 & 2033
- Figure 36: Asia Pacific US Anti Money Laundering Solution Market Revenue (billion), by Type 2025 & 2033
- Figure 37: Asia Pacific US Anti Money Laundering Solution Market Revenue Share (%), by Type 2025 & 2033
- Figure 38: Asia Pacific US Anti Money Laundering Solution Market Revenue (billion), by Deployment Model 2025 & 2033
- Figure 39: Asia Pacific US Anti Money Laundering Solution Market Revenue Share (%), by Deployment Model 2025 & 2033
- Figure 40: Asia Pacific US Anti Money Laundering Solution Market Revenue (billion), by Country 2025 & 2033
- Figure 41: Asia Pacific US Anti Money Laundering Solution Market Revenue Share (%), by Country 2025 & 2033
List of Tables
- Table 1: Global US Anti Money Laundering Solution Market Revenue billion Forecast, by Solution 2020 & 2033
- Table 2: Global US Anti Money Laundering Solution Market Revenue billion Forecast, by Type 2020 & 2033
- Table 3: Global US Anti Money Laundering Solution Market Revenue billion Forecast, by Deployment Model 2020 & 2033
- Table 4: Global US Anti Money Laundering Solution Market Revenue billion Forecast, by Region 2020 & 2033
- Table 5: Global US Anti Money Laundering Solution Market Revenue billion Forecast, by Solution 2020 & 2033
- Table 6: Global US Anti Money Laundering Solution Market Revenue billion Forecast, by Type 2020 & 2033
- Table 7: Global US Anti Money Laundering Solution Market Revenue billion Forecast, by Deployment Model 2020 & 2033
- Table 8: Global US Anti Money Laundering Solution Market Revenue billion Forecast, by Country 2020 & 2033
- Table 9: United States US Anti Money Laundering Solution Market Revenue (billion) Forecast, by Application 2020 & 2033
- Table 10: Canada US Anti Money Laundering Solution Market Revenue (billion) Forecast, by Application 2020 & 2033
- Table 11: Mexico US Anti Money Laundering Solution Market Revenue (billion) Forecast, by Application 2020 & 2033
- Table 12: Global US Anti Money Laundering Solution Market Revenue billion Forecast, by Solution 2020 & 2033
- Table 13: Global US Anti Money Laundering Solution Market Revenue billion Forecast, by Type 2020 & 2033
- Table 14: Global US Anti Money Laundering Solution Market Revenue billion Forecast, by Deployment Model 2020 & 2033
- Table 15: Global US Anti Money Laundering Solution Market Revenue billion Forecast, by Country 2020 & 2033
- Table 16: Brazil US Anti Money Laundering Solution Market Revenue (billion) Forecast, by Application 2020 & 2033
- Table 17: Argentina US Anti Money Laundering Solution Market Revenue (billion) Forecast, by Application 2020 & 2033
- Table 18: Rest of South America US Anti Money Laundering Solution Market Revenue (billion) Forecast, by Application 2020 & 2033
- Table 19: Global US Anti Money Laundering Solution Market Revenue billion Forecast, by Solution 2020 & 2033
- Table 20: Global US Anti Money Laundering Solution Market Revenue billion Forecast, by Type 2020 & 2033
- Table 21: Global US Anti Money Laundering Solution Market Revenue billion Forecast, by Deployment Model 2020 & 2033
- Table 22: Global US Anti Money Laundering Solution Market Revenue billion Forecast, by Country 2020 & 2033
- Table 23: United Kingdom US Anti Money Laundering Solution Market Revenue (billion) Forecast, by Application 2020 & 2033
- Table 24: Germany US Anti Money Laundering Solution Market Revenue (billion) Forecast, by Application 2020 & 2033
- Table 25: France US Anti Money Laundering Solution Market Revenue (billion) Forecast, by Application 2020 & 2033
- Table 26: Italy US Anti Money Laundering Solution Market Revenue (billion) Forecast, by Application 2020 & 2033
- Table 27: Spain US Anti Money Laundering Solution Market Revenue (billion) Forecast, by Application 2020 & 2033
- Table 28: Russia US Anti Money Laundering Solution Market Revenue (billion) Forecast, by Application 2020 & 2033
- Table 29: Benelux US Anti Money Laundering Solution Market Revenue (billion) Forecast, by Application 2020 & 2033
- Table 30: Nordics US Anti Money Laundering Solution Market Revenue (billion) Forecast, by Application 2020 & 2033
- Table 31: Rest of Europe US Anti Money Laundering Solution Market Revenue (billion) Forecast, by Application 2020 & 2033
- Table 32: Global US Anti Money Laundering Solution Market Revenue billion Forecast, by Solution 2020 & 2033
- Table 33: Global US Anti Money Laundering Solution Market Revenue billion Forecast, by Type 2020 & 2033
- Table 34: Global US Anti Money Laundering Solution Market Revenue billion Forecast, by Deployment Model 2020 & 2033
- Table 35: Global US Anti Money Laundering Solution Market Revenue billion Forecast, by Country 2020 & 2033
- Table 36: Turkey US Anti Money Laundering Solution Market Revenue (billion) Forecast, by Application 2020 & 2033
- Table 37: Israel US Anti Money Laundering Solution Market Revenue (billion) Forecast, by Application 2020 & 2033
- Table 38: GCC US Anti Money Laundering Solution Market Revenue (billion) Forecast, by Application 2020 & 2033
- Table 39: North Africa US Anti Money Laundering Solution Market Revenue (billion) Forecast, by Application 2020 & 2033
- Table 40: South Africa US Anti Money Laundering Solution Market Revenue (billion) Forecast, by Application 2020 & 2033
- Table 41: Rest of Middle East & Africa US Anti Money Laundering Solution Market Revenue (billion) Forecast, by Application 2020 & 2033
- Table 42: Global US Anti Money Laundering Solution Market Revenue billion Forecast, by Solution 2020 & 2033
- Table 43: Global US Anti Money Laundering Solution Market Revenue billion Forecast, by Type 2020 & 2033
- Table 44: Global US Anti Money Laundering Solution Market Revenue billion Forecast, by Deployment Model 2020 & 2033
- Table 45: Global US Anti Money Laundering Solution Market Revenue billion Forecast, by Country 2020 & 2033
- Table 46: China US Anti Money Laundering Solution Market Revenue (billion) Forecast, by Application 2020 & 2033
- Table 47: India US Anti Money Laundering Solution Market Revenue (billion) Forecast, by Application 2020 & 2033
- Table 48: Japan US Anti Money Laundering Solution Market Revenue (billion) Forecast, by Application 2020 & 2033
- Table 49: South Korea US Anti Money Laundering Solution Market Revenue (billion) Forecast, by Application 2020 & 2033
- Table 50: ASEAN US Anti Money Laundering Solution Market Revenue (billion) Forecast, by Application 2020 & 2033
- Table 51: Oceania US Anti Money Laundering Solution Market Revenue (billion) Forecast, by Application 2020 & 2033
- Table 52: Rest of Asia Pacific US Anti Money Laundering Solution Market Revenue (billion) Forecast, by Application 2020 & 2033
Frequently Asked Questions
1. What is the projected Compound Annual Growth Rate (CAGR) of the US Anti Money Laundering Solution Market?
The projected CAGR is approximately 17.8%.
2. Which companies are prominent players in the US Anti Money Laundering Solution Market?
Key companies in the market include Jumio, NICE Actimize, Tata Consultancy Service, ACI Worldwide, Lexis Nexis, Oracle Corporation, Signicat**List Not Exhaustive, Trust Stamp, Trulioo, Deloitte.
3. What are the main segments of the US Anti Money Laundering Solution Market?
The market segments include Solution, Type, Deployment Model.
4. Can you provide details about the market size?
The market size is estimated to be USD 4.13 billion as of 2022.
5. What are some drivers contributing to market growth?
Internet Penetration is Driving the Market.
6. What are the notable trends driving market growth?
US-Anti Money laundering market is affected by development of New transaction meathods..
7. Are there any restraints impacting market growth?
Government Regulations are Restraining the Market.
8. Can you provide examples of recent developments in the market?
June 2022 - ACI Worldwide a global leader in mission-critical real-time payment software announced an agreement to divest its corporate online banking solutions ACI Digital Business Banking to One Equity Partners, a middle market private equity firm.
9. What pricing options are available for accessing the report?
Pricing options include single-user, multi-user, and enterprise licenses priced at USD 3800, USD 4500, and USD 5800 respectively.
10. Is the market size provided in terms of value or volume?
The market size is provided in terms of value, measured in billion.
11. Are there any specific market keywords associated with the report?
Yes, the market keyword associated with the report is "US Anti Money Laundering Solution Market," which aids in identifying and referencing the specific market segment covered.
12. How do I determine which pricing option suits my needs best?
The pricing options vary based on user requirements and access needs. Individual users may opt for single-user licenses, while businesses requiring broader access may choose multi-user or enterprise licenses for cost-effective access to the report.
13. Are there any additional resources or data provided in the US Anti Money Laundering Solution Market report?
While the report offers comprehensive insights, it's advisable to review the specific contents or supplementary materials provided to ascertain if additional resources or data are available.
14. How can I stay updated on further developments or reports in the US Anti Money Laundering Solution Market?
To stay informed about further developments, trends, and reports in the US Anti Money Laundering Solution Market, consider subscribing to industry newsletters, following relevant companies and organizations, or regularly checking reputable industry news sources and publications.
Methodology
Step 1 - Identification of Relevant Samples Size from Population Database


Step 2 - Approaches for Defining Global Market Size (Value, Volume* & Price*)

Note*: In applicable scenarios
Step 3 - Data Sources
Primary Research
- Web Analytics
- Survey Reports
- Research Institute
- Latest Research Reports
- Opinion Leaders
Secondary Research
- Annual Reports
- White Paper
- Latest Press Release
- Industry Association
- Paid Database
- Investor Presentations

Step 4 - Data Triangulation
Involves using different sources of information in order to increase the validity of a study
These sources are likely to be stakeholders in a program - participants, other researchers, program staff, other community members, and so on.
Then we put all data in single framework & apply various statistical tools to find out the dynamic on the market.
During the analysis stage, feedback from the stakeholder groups would be compared to determine areas of agreement as well as areas of divergence