

Key Insights
The US Buy Now Pay Later (BNPL) market is experiencing robust expansion, driven by escalating consumer demand for payment flexibility and widespread e-commerce adoption. The market is projected to grow at a Compound Annual Growth Rate (CAGR) of 12.2%. This growth is supported by strong performance across diverse application channels, with online platforms leading. Key product categories propelling this expansion include kitchen appliances, electronics (TVs, mobile devices, laptops, tablets), fashion, personal care, and healthcare. BNPL services appeal to consumers due to their convenience and accessibility, enabling cost-effective installment payments, particularly valuable during economic volatility. Leading providers like Afterpay, Affirm, Klarna, and PayPal are engaged in competitive innovation to enhance service offerings and capture market share. Future growth is anticipated, though potential challenges such as regulatory oversight and consumer debt concerns require careful consideration. Expansion into new product categories, geographical markets, and advancements in fraud prevention and risk management will be critical for market evolution.
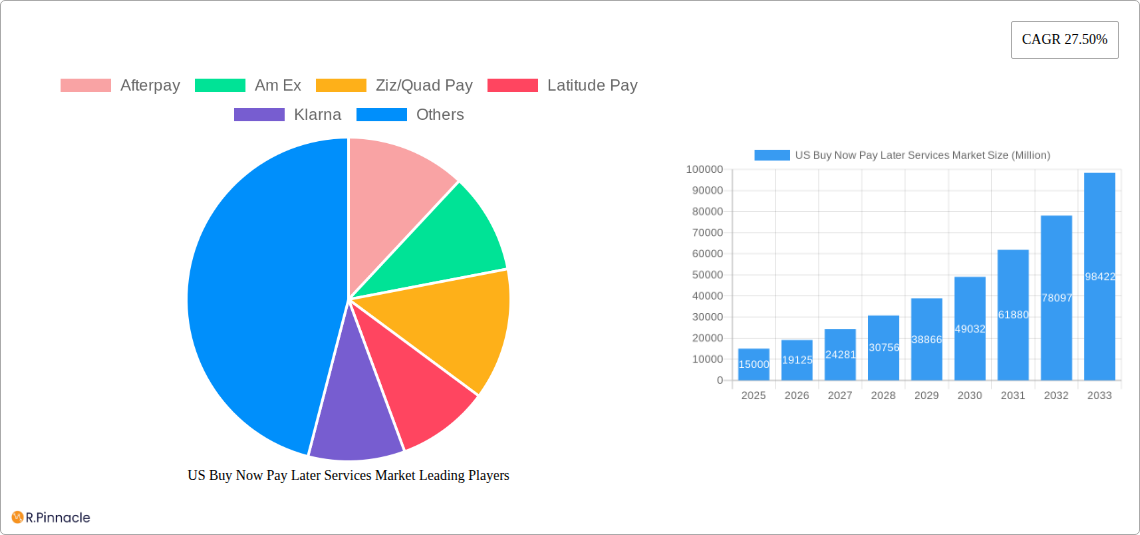
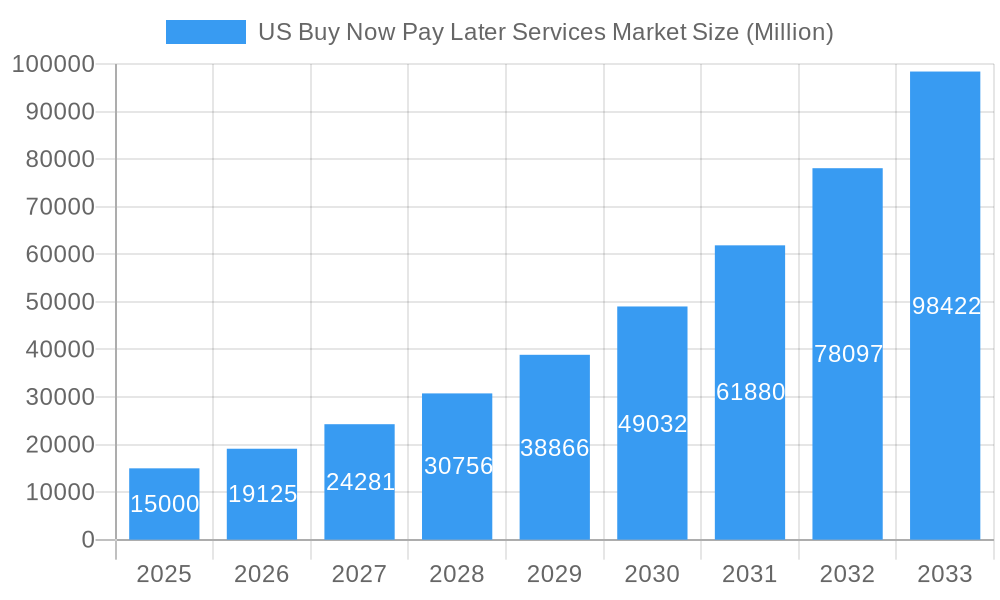
US Buy Now Pay Later Services Market Market Size (In Billion)
The US region significantly contributes to the global BNPL market. This dominance is attributed to a strong presence of major BNPL providers, high e-commerce penetration, and a receptive consumer base. Future growth in the US market will be influenced by technological advancements, shifting consumer preferences, and the adaptability of BNPL providers to economic changes. As the market matures, expect an increased emphasis on responsible lending, enhanced customer protection, and the integration of BNPL services into broader financial platforms. Strategic alliances and acquisitions among industry players are likely to redefine the market landscape. The long-term outlook for the US BNPL market remains optimistic, fueled by consumer demand for financial flexibility and continuous industry innovation. Proactive mitigation of potential challenges and adaptation to the evolving regulatory environment are crucial for sustained growth. The current market size is estimated at $122.26 billion in the base year 2025.
US Buy Now Pay Later Services Market Company Market Share
US Buy Now Pay Later Services Market Report: 2019-2033
This comprehensive report provides a detailed analysis of the US Buy Now Pay Later (BNPL) services market, offering invaluable insights for industry professionals, investors, and strategists. Covering the period from 2019 to 2033, with a focus on 2025, this report dissects market dynamics, competitive landscapes, and future growth potential. The study utilizes rigorous research methodologies and incorporates key industry developments to provide an accurate and up-to-date overview.
US Buy Now Pay Later Services Market Structure & Innovation Trends
This section analyzes the market structure of the US BNPL services industry, focusing on market concentration, innovation drivers, regulatory frameworks, and competitive dynamics. We explore the impact of mergers and acquisitions (M&A) activities, examining deal values and their influence on market share. The analysis includes a deep dive into end-user demographics and the role of product substitutes. We estimate the market concentration to be moderately high, with a few dominant players controlling a significant share. Key players exhibit aggressive M&A activities, with estimated deal values exceeding xx Million in the last five years. This has led to a consolidation of the market, driving innovation and efficiency but also creating challenges for smaller entrants.
- Market Share: Affirm Inc and Klarna hold a significant portion of the market, estimated at xx% and xx%, respectively. Other major players like Afterpay and PayPal hold substantial but smaller market shares.
- Innovation Drivers: Technological advancements, such as improved risk assessment algorithms and seamless integration with e-commerce platforms, are major drivers of innovation.
- Regulatory Framework: The evolving regulatory landscape presents both opportunities and challenges, as regulators seek to balance consumer protection with promoting financial innovation.
- M&A Activity: Recent M&A activity reflects the industry's consolidation and expansion efforts, aiming to reach broader customer segments and enhance service offerings.
US Buy Now Pay Later Services Market Market Dynamics & Trends
This section delves into the market dynamics of the US BNPL services market, exploring key factors influencing market growth. We examine the compound annual growth rate (CAGR) and market penetration rate, analyzing the influence of technological disruptions, evolving consumer preferences, and competitive dynamics. The US BNPL market is experiencing robust growth, driven by the increasing adoption of e-commerce, changing consumer spending habits, and the convenience offered by BNPL services. The market is also characterized by intense competition, with both established financial institutions and fintech startups vying for market share. The CAGR during the historical period (2019-2024) was estimated at xx%, with market penetration reaching xx% in 2024. We project a CAGR of xx% for the forecast period (2025-2033). Technological disruptions, such as the rise of embedded finance and the adoption of open banking technologies, are expected to shape the future of the market.
Dominant Regions & Segments in US Buy Now Pay Later Services Market
This section identifies the leading regions, countries, and segments within the US BNPL services market. The analysis focuses on both application (online vs. POS) and product category (kitchen appliances, electronics, fashion, healthcare, and others). The online segment currently holds the dominant market share, due to the rapid growth of e-commerce. However, the POS segment is also exhibiting strong growth as BNPL solutions become increasingly integrated into brick-and-mortar stores.
- Key Drivers – Online Segment: Increased e-commerce penetration, seamless integration with online retailers, and wider consumer adoption.
- Key Drivers – POS Segment: Growing integration with point-of-sale systems, increased merchant adoption, and convenience for in-store purchases.
- Dominant Product Category: Fashion and personal care currently lead in terms of BNPL adoption, followed closely by other electronic appliances. The healthcare segment presents emerging growth potential.
The detailed dominance analysis will further examine geographic variations in BNPL adoption rates, considering factors such as economic conditions, consumer demographics, and regulatory environments.
US Buy Now Pay Later Services Market Product Innovations
The US BNPL market is characterized by continuous product innovation, driven by a need to enhance user experience and attract new customers. Recent innovations include improved risk management tools, more flexible payment options, and enhanced integration with other financial services. These advancements contribute to increased customer acquisition and retention, ultimately driving market growth. The development of embedded finance solutions is revolutionizing the market, allowing BNPL services to be seamlessly integrated into various platforms, improving accessibility and customer reach.
Report Scope & Segmentation Analysis
This report segments the US BNPL services market by application (online and POS) and product category (kitchen appliances, other electronic appliances, fashion and personal care, healthcare, and other product categories). Growth projections, market sizes, and competitive dynamics are analyzed for each segment.
By Application:
- Online: This segment is expected to maintain its strong growth trajectory, driven by rising e-commerce adoption. Market size is projected to reach xx Million by 2033.
- POS: The POS segment is expected to experience significant growth, driven by merchant adoption and integration into existing point-of-sale systems. The market size is projected to reach xx Million by 2033.
By Product Category:
Detailed segment analysis for each product category will be provided in the complete report, including growth projections and market sizes.
Key Drivers of US Buy Now Pay Later Services Market Growth
Several key factors drive the growth of the US BNPL market. Increased e-commerce adoption has substantially increased demand. Changing consumer preferences towards flexible payment options further fuel this growth. Technological advancements enable seamless integration and enhanced risk management. Finally, favorable regulatory frameworks support the growth of the sector.
Challenges in the US Buy Now Pay Later Services Market Sector
The US BNPL market faces challenges, including increasing regulatory scrutiny aimed at protecting consumers from potential debt traps. Competition from established financial institutions and fintech companies also creates pressure on margins and profitability. Supply chain disruptions can indirectly affect the availability of goods purchased using BNPL services. These factors can potentially hinder market growth.
Emerging Opportunities in US Buy Now Pay Later Services Market
Despite the challenges, the US BNPL market presents many growth opportunities. Expansion into new market segments, such as healthcare and education, presents significant potential. Technological advancements, such as artificial intelligence (AI) for risk assessment and improved fraud detection, will enhance efficiency. Finally, adapting to changing consumer preferences, such as personalized payment options, remains crucial for future growth.
Leading Players in the US Buy Now Pay Later Services Market Market
- Afterpay
- American Express
- Ziz/QuadPay
- LatitudePay
- Klarna
- PayPal
- Splitit
- Open Pay
- Sezzle
- Affirm Inc
Key Developments in US Buy Now Pay Later Services Market Industry
- May 2022: Affirm and Fiserv partnered, integrating Affirm into Fiserv's Carat operating system.
- May 2022: Afterpay partnered with Rite Aid, offering BNPL options for online purchases.
Future Outlook for US Buy Now Pay Later Services Market Market
The future of the US BNPL market is promising. Continued e-commerce growth and evolving consumer preferences will drive demand. Technological innovations will enhance the customer experience and efficiency. Strategic partnerships and expansions into new segments will further fuel growth. The market is expected to witness a significant expansion in the coming years, presenting substantial opportunities for both established players and new entrants.
US Buy Now Pay Later Services Market Segmentation
-
1. Application
- 1.1. Online
- 1.2. POS
-
2. Product Category
- 2.1. Kitchen Appliance
- 2.2. Other El
- 2.3. Fashion and Personal Care
- 2.4. Healthcare
- 2.5. Other Product Categories
US Buy Now Pay Later Services Market Segmentation By Geography
-
1. North America
- 1.1. United States
- 1.2. Canada
- 1.3. Mexico
-
2. South America
- 2.1. Brazil
- 2.2. Argentina
- 2.3. Rest of South America
-
3. Europe
- 3.1. United Kingdom
- 3.2. Germany
- 3.3. France
- 3.4. Italy
- 3.5. Spain
- 3.6. Russia
- 3.7. Benelux
- 3.8. Nordics
- 3.9. Rest of Europe
-
4. Middle East & Africa
- 4.1. Turkey
- 4.2. Israel
- 4.3. GCC
- 4.4. North Africa
- 4.5. South Africa
- 4.6. Rest of Middle East & Africa
-
5. Asia Pacific
- 5.1. China
- 5.2. India
- 5.3. Japan
- 5.4. South Korea
- 5.5. ASEAN
- 5.6. Oceania
- 5.7. Rest of Asia Pacific
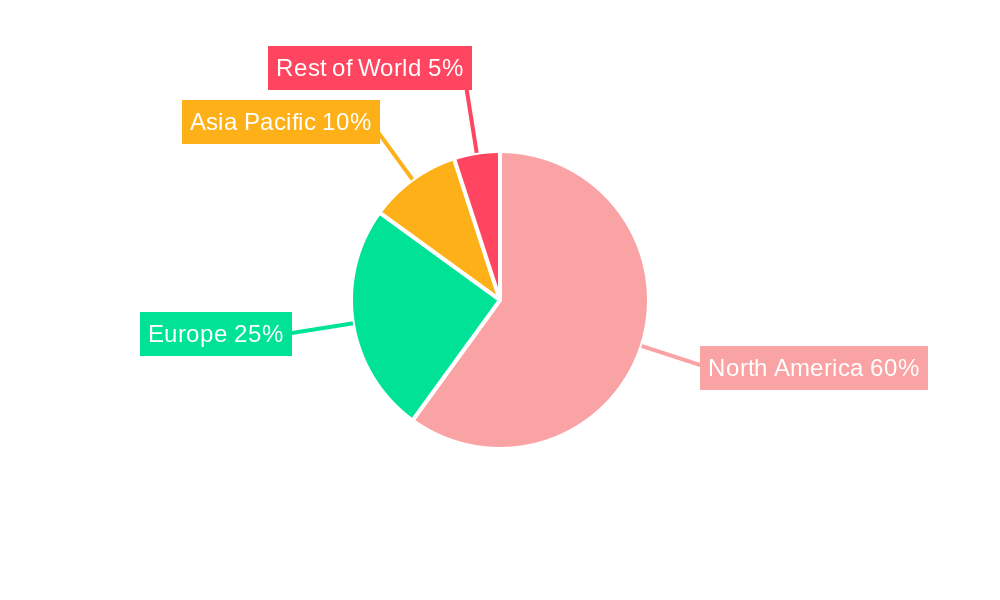
US Buy Now Pay Later Services Market Regional Market Share
Geographic Coverage of US Buy Now Pay Later Services Market
US Buy Now Pay Later Services Market REPORT HIGHLIGHTS
| Aspects | Details |
|---|---|
| Study Period | 2020-2034 |
| Base Year | 2025 |
| Estimated Year | 2026 |
| Forecast Period | 2026-2034 |
| Historical Period | 2020-2025 |
| Growth Rate | CAGR of 12.2% from 2020-2034 |
| Segmentation |
|
Table of Contents
- 1. Introduction
- 1.1. Research Scope
- 1.2. Market Segmentation
- 1.3. Research Objective
- 1.4. Definitions and Assumptions
- 2. Executive Summary
- 2.1. Market Snapshot
- 3. Market Dynamics
- 3.1. Market Drivers
- 3.2. Market Restrains
- 3.3. Market Trends
- 3.4. Market Opportunities
- 4. Market Factor Analysis
- 4.1. Porters Five Forces
- 4.1.1. Bargaining Power of Suppliers
- 4.1.2. Bargaining Power of Buyers
- 4.1.3. Threat of New Entrants
- 4.1.4. Threat of Substitutes
- 4.1.5. Competitive Rivalry
- 4.2. PESTEL analysis
- 4.3. BCG Analysis
- 4.3.1. Stars (High Growth, High Market Share)
- 4.3.2. Cash Cows (Low Growth, High Market Share)
- 4.3.3. Question Mark (High Growth, Low Market Share)
- 4.3.4. Dogs (Low Growth, Low Market Share)
- 4.4. Ansoff Matrix Analysis
- 4.5. Supply Chain Analysis
- 4.6. Regulatory Landscape
- 4.7. Current Market Potential and Opportunity Assessment (TAM–SAM–SOM Framework)
- 4.8. PRI Analyst Note
- 4.1. Porters Five Forces
- 5. Market Analysis, Insights and Forecast 2021-2033
- 5.1. Market Analysis, Insights and Forecast - by Application
- 5.1.1. Online
- 5.1.2. POS
- 5.2. Market Analysis, Insights and Forecast - by Product Category
- 5.2.1. Kitchen Appliance
- 5.2.2. Other El
- 5.2.3. Fashion and Personal Care
- 5.2.4. Healthcare
- 5.2.5. Other Product Categories
- 5.3. Market Analysis, Insights and Forecast - by Region
- 5.3.1. North America
- 5.3.2. South America
- 5.3.3. Europe
- 5.3.4. Middle East & Africa
- 5.3.5. Asia Pacific
- 5.1. Market Analysis, Insights and Forecast - by Application
- 6. Global US Buy Now Pay Later Services Market Analysis, Insights and Forecast, 2021-2033
- 6.1. Market Analysis, Insights and Forecast - by Application
- 6.1.1. Online
- 6.1.2. POS
- 6.2. Market Analysis, Insights and Forecast - by Product Category
- 6.2.1. Kitchen Appliance
- 6.2.2. Other El
- 6.2.3. Fashion and Personal Care
- 6.2.4. Healthcare
- 6.2.5. Other Product Categories
- 6.1. Market Analysis, Insights and Forecast - by Application
- 7. North America US Buy Now Pay Later Services Market Analysis, Insights and Forecast, 2020-2032
- 7.1. Market Analysis, Insights and Forecast - by Application
- 7.1.1. Online
- 7.1.2. POS
- 7.2. Market Analysis, Insights and Forecast - by Product Category
- 7.2.1. Kitchen Appliance
- 7.2.2. Other El
- 7.2.3. Fashion and Personal Care
- 7.2.4. Healthcare
- 7.2.5. Other Product Categories
- 7.1. Market Analysis, Insights and Forecast - by Application
- 8. South America US Buy Now Pay Later Services Market Analysis, Insights and Forecast, 2020-2032
- 8.1. Market Analysis, Insights and Forecast - by Application
- 8.1.1. Online
- 8.1.2. POS
- 8.2. Market Analysis, Insights and Forecast - by Product Category
- 8.2.1. Kitchen Appliance
- 8.2.2. Other El
- 8.2.3. Fashion and Personal Care
- 8.2.4. Healthcare
- 8.2.5. Other Product Categories
- 8.1. Market Analysis, Insights and Forecast - by Application
- 9. Europe US Buy Now Pay Later Services Market Analysis, Insights and Forecast, 2020-2032
- 9.1. Market Analysis, Insights and Forecast - by Application
- 9.1.1. Online
- 9.1.2. POS
- 9.2. Market Analysis, Insights and Forecast - by Product Category
- 9.2.1. Kitchen Appliance
- 9.2.2. Other El
- 9.2.3. Fashion and Personal Care
- 9.2.4. Healthcare
- 9.2.5. Other Product Categories
- 9.1. Market Analysis, Insights and Forecast - by Application
- 10. Middle East & Africa US Buy Now Pay Later Services Market Analysis, Insights and Forecast, 2020-2032
- 10.1. Market Analysis, Insights and Forecast - by Application
- 10.1.1. Online
- 10.1.2. POS
- 10.2. Market Analysis, Insights and Forecast - by Product Category
- 10.2.1. Kitchen Appliance
- 10.2.2. Other El
- 10.2.3. Fashion and Personal Care
- 10.2.4. Healthcare
- 10.2.5. Other Product Categories
- 10.1. Market Analysis, Insights and Forecast - by Application
- 11. Asia Pacific US Buy Now Pay Later Services Market Analysis, Insights and Forecast, 2020-2032
- 11.1. Market Analysis, Insights and Forecast - by Application
- 11.1.1. Online
- 11.1.2. POS
- 11.2. Market Analysis, Insights and Forecast - by Product Category
- 11.2.1. Kitchen Appliance
- 11.2.2. Other El
- 11.2.3. Fashion and Personal Care
- 11.2.4. Healthcare
- 11.2.5. Other Product Categories
- 11.1. Market Analysis, Insights and Forecast - by Application
- 12. Competitive Analysis
- 12.1. Company Profiles
- 12.1.1 Afterpay
- 12.1.1.1. Company Overview
- 12.1.1.2. Products
- 12.1.1.3. Company Financials
- 12.1.1.4. SWOT Analysis
- 12.1.2 Am Ex
- 12.1.2.1. Company Overview
- 12.1.2.2. Products
- 12.1.2.3. Company Financials
- 12.1.2.4. SWOT Analysis
- 12.1.3 Ziz/Quad Pay
- 12.1.3.1. Company Overview
- 12.1.3.2. Products
- 12.1.3.3. Company Financials
- 12.1.3.4. SWOT Analysis
- 12.1.4 Latitude Pay
- 12.1.4.1. Company Overview
- 12.1.4.2. Products
- 12.1.4.3. Company Financials
- 12.1.4.4. SWOT Analysis
- 12.1.5 Klarna
- 12.1.5.1. Company Overview
- 12.1.5.2. Products
- 12.1.5.3. Company Financials
- 12.1.5.4. SWOT Analysis
- 12.1.6 Pay Pal
- 12.1.6.1. Company Overview
- 12.1.6.2. Products
- 12.1.6.3. Company Financials
- 12.1.6.4. SWOT Analysis
- 12.1.7 Splitit**List Not Exhaustive
- 12.1.7.1. Company Overview
- 12.1.7.2. Products
- 12.1.7.3. Company Financials
- 12.1.7.4. SWOT Analysis
- 12.1.8 Open Pay
- 12.1.8.1. Company Overview
- 12.1.8.2. Products
- 12.1.8.3. Company Financials
- 12.1.8.4. SWOT Analysis
- 12.1.9 Sezzle
- 12.1.9.1. Company Overview
- 12.1.9.2. Products
- 12.1.9.3. Company Financials
- 12.1.9.4. SWOT Analysis
- 12.1.10 Affirm Inc
- 12.1.10.1. Company Overview
- 12.1.10.2. Products
- 12.1.10.3. Company Financials
- 12.1.10.4. SWOT Analysis
- 12.1.1 Afterpay
- 12.2. Market Entropy
- 12.2.1 Company's Key Areas Served
- 12.2.2 Recent Developments
- 12.3. Company Market Share Analysis 2025
- 12.3.1 Top 5 Companies Market Share Analysis
- 12.3.2 Top 3 Companies Market Share Analysis
- 12.4. List of Potential Customers
- 13. Research Methodology
List of Figures
- Figure 1: Global US Buy Now Pay Later Services Market Revenue Breakdown (billion, %) by Region 2025 & 2033
- Figure 2: North America US Buy Now Pay Later Services Market Revenue (billion), by Application 2025 & 2033
- Figure 3: North America US Buy Now Pay Later Services Market Revenue Share (%), by Application 2025 & 2033
- Figure 4: North America US Buy Now Pay Later Services Market Revenue (billion), by Product Category 2025 & 2033
- Figure 5: North America US Buy Now Pay Later Services Market Revenue Share (%), by Product Category 2025 & 2033
- Figure 6: North America US Buy Now Pay Later Services Market Revenue (billion), by Country 2025 & 2033
- Figure 7: North America US Buy Now Pay Later Services Market Revenue Share (%), by Country 2025 & 2033
- Figure 8: South America US Buy Now Pay Later Services Market Revenue (billion), by Application 2025 & 2033
- Figure 9: South America US Buy Now Pay Later Services Market Revenue Share (%), by Application 2025 & 2033
- Figure 10: South America US Buy Now Pay Later Services Market Revenue (billion), by Product Category 2025 & 2033
- Figure 11: South America US Buy Now Pay Later Services Market Revenue Share (%), by Product Category 2025 & 2033
- Figure 12: South America US Buy Now Pay Later Services Market Revenue (billion), by Country 2025 & 2033
- Figure 13: South America US Buy Now Pay Later Services Market Revenue Share (%), by Country 2025 & 2033
- Figure 14: Europe US Buy Now Pay Later Services Market Revenue (billion), by Application 2025 & 2033
- Figure 15: Europe US Buy Now Pay Later Services Market Revenue Share (%), by Application 2025 & 2033
- Figure 16: Europe US Buy Now Pay Later Services Market Revenue (billion), by Product Category 2025 & 2033
- Figure 17: Europe US Buy Now Pay Later Services Market Revenue Share (%), by Product Category 2025 & 2033
- Figure 18: Europe US Buy Now Pay Later Services Market Revenue (billion), by Country 2025 & 2033
- Figure 19: Europe US Buy Now Pay Later Services Market Revenue Share (%), by Country 2025 & 2033
- Figure 20: Middle East & Africa US Buy Now Pay Later Services Market Revenue (billion), by Application 2025 & 2033
- Figure 21: Middle East & Africa US Buy Now Pay Later Services Market Revenue Share (%), by Application 2025 & 2033
- Figure 22: Middle East & Africa US Buy Now Pay Later Services Market Revenue (billion), by Product Category 2025 & 2033
- Figure 23: Middle East & Africa US Buy Now Pay Later Services Market Revenue Share (%), by Product Category 2025 & 2033
- Figure 24: Middle East & Africa US Buy Now Pay Later Services Market Revenue (billion), by Country 2025 & 2033
- Figure 25: Middle East & Africa US Buy Now Pay Later Services Market Revenue Share (%), by Country 2025 & 2033
- Figure 26: Asia Pacific US Buy Now Pay Later Services Market Revenue (billion), by Application 2025 & 2033
- Figure 27: Asia Pacific US Buy Now Pay Later Services Market Revenue Share (%), by Application 2025 & 2033
- Figure 28: Asia Pacific US Buy Now Pay Later Services Market Revenue (billion), by Product Category 2025 & 2033
- Figure 29: Asia Pacific US Buy Now Pay Later Services Market Revenue Share (%), by Product Category 2025 & 2033
- Figure 30: Asia Pacific US Buy Now Pay Later Services Market Revenue (billion), by Country 2025 & 2033
- Figure 31: Asia Pacific US Buy Now Pay Later Services Market Revenue Share (%), by Country 2025 & 2033
List of Tables
- Table 1: Global US Buy Now Pay Later Services Market Revenue billion Forecast, by Application 2020 & 2033
- Table 2: Global US Buy Now Pay Later Services Market Revenue billion Forecast, by Product Category 2020 & 2033
- Table 3: Global US Buy Now Pay Later Services Market Revenue billion Forecast, by Region 2020 & 2033
- Table 4: Global US Buy Now Pay Later Services Market Revenue billion Forecast, by Application 2020 & 2033
- Table 5: Global US Buy Now Pay Later Services Market Revenue billion Forecast, by Product Category 2020 & 2033
- Table 6: Global US Buy Now Pay Later Services Market Revenue billion Forecast, by Country 2020 & 2033
- Table 7: United States US Buy Now Pay Later Services Market Revenue (billion) Forecast, by Application 2020 & 2033
- Table 8: Canada US Buy Now Pay Later Services Market Revenue (billion) Forecast, by Application 2020 & 2033
- Table 9: Mexico US Buy Now Pay Later Services Market Revenue (billion) Forecast, by Application 2020 & 2033
- Table 10: Global US Buy Now Pay Later Services Market Revenue billion Forecast, by Application 2020 & 2033
- Table 11: Global US Buy Now Pay Later Services Market Revenue billion Forecast, by Product Category 2020 & 2033
- Table 12: Global US Buy Now Pay Later Services Market Revenue billion Forecast, by Country 2020 & 2033
- Table 13: Brazil US Buy Now Pay Later Services Market Revenue (billion) Forecast, by Application 2020 & 2033
- Table 14: Argentina US Buy Now Pay Later Services Market Revenue (billion) Forecast, by Application 2020 & 2033
- Table 15: Rest of South America US Buy Now Pay Later Services Market Revenue (billion) Forecast, by Application 2020 & 2033
- Table 16: Global US Buy Now Pay Later Services Market Revenue billion Forecast, by Application 2020 & 2033
- Table 17: Global US Buy Now Pay Later Services Market Revenue billion Forecast, by Product Category 2020 & 2033
- Table 18: Global US Buy Now Pay Later Services Market Revenue billion Forecast, by Country 2020 & 2033
- Table 19: United Kingdom US Buy Now Pay Later Services Market Revenue (billion) Forecast, by Application 2020 & 2033
- Table 20: Germany US Buy Now Pay Later Services Market Revenue (billion) Forecast, by Application 2020 & 2033
- Table 21: France US Buy Now Pay Later Services Market Revenue (billion) Forecast, by Application 2020 & 2033
- Table 22: Italy US Buy Now Pay Later Services Market Revenue (billion) Forecast, by Application 2020 & 2033
- Table 23: Spain US Buy Now Pay Later Services Market Revenue (billion) Forecast, by Application 2020 & 2033
- Table 24: Russia US Buy Now Pay Later Services Market Revenue (billion) Forecast, by Application 2020 & 2033
- Table 25: Benelux US Buy Now Pay Later Services Market Revenue (billion) Forecast, by Application 2020 & 2033
- Table 26: Nordics US Buy Now Pay Later Services Market Revenue (billion) Forecast, by Application 2020 & 2033
- Table 27: Rest of Europe US Buy Now Pay Later Services Market Revenue (billion) Forecast, by Application 2020 & 2033
- Table 28: Global US Buy Now Pay Later Services Market Revenue billion Forecast, by Application 2020 & 2033
- Table 29: Global US Buy Now Pay Later Services Market Revenue billion Forecast, by Product Category 2020 & 2033
- Table 30: Global US Buy Now Pay Later Services Market Revenue billion Forecast, by Country 2020 & 2033
- Table 31: Turkey US Buy Now Pay Later Services Market Revenue (billion) Forecast, by Application 2020 & 2033
- Table 32: Israel US Buy Now Pay Later Services Market Revenue (billion) Forecast, by Application 2020 & 2033
- Table 33: GCC US Buy Now Pay Later Services Market Revenue (billion) Forecast, by Application 2020 & 2033
- Table 34: North Africa US Buy Now Pay Later Services Market Revenue (billion) Forecast, by Application 2020 & 2033
- Table 35: South Africa US Buy Now Pay Later Services Market Revenue (billion) Forecast, by Application 2020 & 2033
- Table 36: Rest of Middle East & Africa US Buy Now Pay Later Services Market Revenue (billion) Forecast, by Application 2020 & 2033
- Table 37: Global US Buy Now Pay Later Services Market Revenue billion Forecast, by Application 2020 & 2033
- Table 38: Global US Buy Now Pay Later Services Market Revenue billion Forecast, by Product Category 2020 & 2033
- Table 39: Global US Buy Now Pay Later Services Market Revenue billion Forecast, by Country 2020 & 2033
- Table 40: China US Buy Now Pay Later Services Market Revenue (billion) Forecast, by Application 2020 & 2033
- Table 41: India US Buy Now Pay Later Services Market Revenue (billion) Forecast, by Application 2020 & 2033
- Table 42: Japan US Buy Now Pay Later Services Market Revenue (billion) Forecast, by Application 2020 & 2033
- Table 43: South Korea US Buy Now Pay Later Services Market Revenue (billion) Forecast, by Application 2020 & 2033
- Table 44: ASEAN US Buy Now Pay Later Services Market Revenue (billion) Forecast, by Application 2020 & 2033
- Table 45: Oceania US Buy Now Pay Later Services Market Revenue (billion) Forecast, by Application 2020 & 2033
- Table 46: Rest of Asia Pacific US Buy Now Pay Later Services Market Revenue (billion) Forecast, by Application 2020 & 2033
Frequently Asked Questions
1. What is the projected Compound Annual Growth Rate (CAGR) of the US Buy Now Pay Later Services Market?
The projected CAGR is approximately 12.2%.
2. Which companies are prominent players in the US Buy Now Pay Later Services Market?
Key companies in the market include Afterpay, Am Ex, Ziz/Quad Pay, Latitude Pay, Klarna, Pay Pal, Splitit**List Not Exhaustive, Open Pay, Sezzle, Affirm Inc.
3. What are the main segments of the US Buy Now Pay Later Services Market?
The market segments include Application, Product Category.
4. Can you provide details about the market size?
The market size is estimated to be USD 122.26 billion as of 2022.
5. What are some drivers contributing to market growth?
Increasing Demand for Efficient and Cost-Effective Healthcare Services.
6. What are the notable trends driving market growth?
Income of US Households Affecting the BNPL Market.
7. Are there any restraints impacting market growth?
Increasing Regulatory Scrutiny and Compliance Requirements.
8. Can you provide examples of recent developments in the market?
In May 2022, Affirm and Fiserv announced a partnership to make Affirm available to Fiserv enterprise merchant clients by the end of the year. With this partnership, Affirm will become the first buy now pay later provider fully integrated into the Carat operating system from Fiserv.
9. What pricing options are available for accessing the report?
Pricing options include single-user, multi-user, and enterprise licenses priced at USD 3800, USD 4500, and USD 5800 respectively.
10. Is the market size provided in terms of value or volume?
The market size is provided in terms of value, measured in billion.
11. Are there any specific market keywords associated with the report?
Yes, the market keyword associated with the report is "US Buy Now Pay Later Services Market," which aids in identifying and referencing the specific market segment covered.
12. How do I determine which pricing option suits my needs best?
The pricing options vary based on user requirements and access needs. Individual users may opt for single-user licenses, while businesses requiring broader access may choose multi-user or enterprise licenses for cost-effective access to the report.
13. Are there any additional resources or data provided in the US Buy Now Pay Later Services Market report?
While the report offers comprehensive insights, it's advisable to review the specific contents or supplementary materials provided to ascertain if additional resources or data are available.
14. How can I stay updated on further developments or reports in the US Buy Now Pay Later Services Market?
To stay informed about further developments, trends, and reports in the US Buy Now Pay Later Services Market, consider subscribing to industry newsletters, following relevant companies and organizations, or regularly checking reputable industry news sources and publications.
Methodology
Step 1 - Identification of Relevant Samples Size from Population Database


Step 2 - Approaches for Defining Global Market Size (Value, Volume* & Price*)

Note*: In applicable scenarios
Step 3 - Data Sources
Primary Research
- Web Analytics
- Survey Reports
- Research Institute
- Latest Research Reports
- Opinion Leaders
Secondary Research
- Annual Reports
- White Paper
- Latest Press Release
- Industry Association
- Paid Database
- Investor Presentations

Step 4 - Data Triangulation
Involves using different sources of information in order to increase the validity of a study
These sources are likely to be stakeholders in a program - participants, other researchers, program staff, other community members, and so on.
Then we put all data in single framework & apply various statistical tools to find out the dynamic on the market.
During the analysis stage, feedback from the stakeholder groups would be compared to determine areas of agreement as well as areas of divergence