

Key Insights
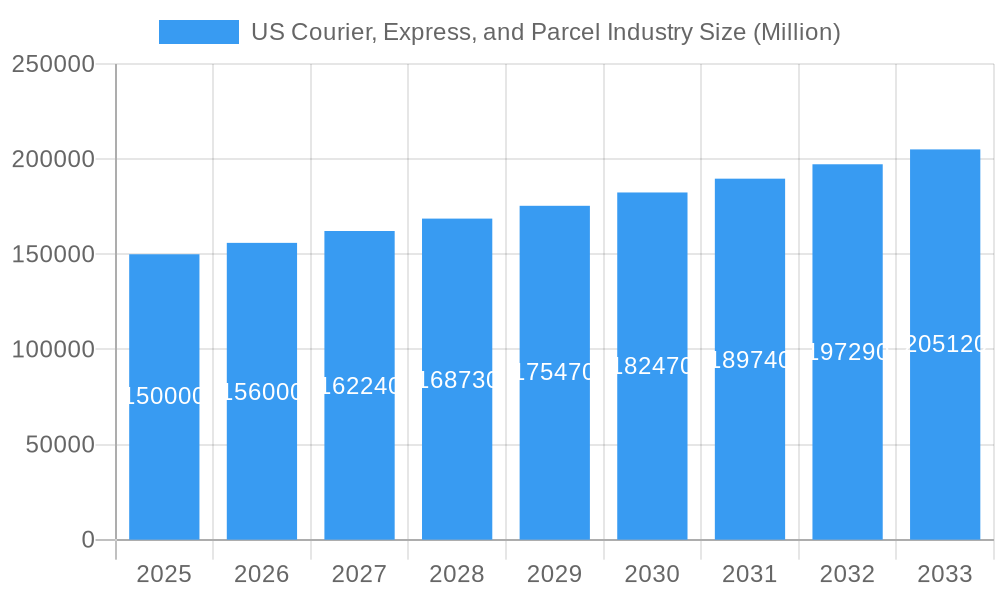
The US courier, express, and parcel (CEP) industry is poised for substantial growth, driven by a robust Compound Annual Growth Rate (CAGR) of 8.6% from 2025 to 2033. Key growth catalysts include the sustained expansion of e-commerce, particularly Business-to-Consumer (B2C) shipments, which necessitates faster and more reliable delivery solutions. Evolving consumer shopping habits underscore the demand for efficient and cost-effective logistics. Technological advancements, such as enhanced tracking, automated sorting, and route optimization, are significantly improving operational efficiency and reducing delivery times. Diversified delivery models, including same-day services and specialized offerings for sectors like healthcare and BFSI, further propel market expansion. While challenges like fluctuating fuel costs and labor shortages persist, the industry outlook remains positive, with B2C and express deliveries demonstrating particularly strong performance. Growth is expected nationwide, with higher potential in densely populated regions such as the Northeast and West Coast.
US Courier, Express, and Parcel Industry Market Size (In Billion)
Market segmentation highlights the significant influence of B2C e-commerce on the US CEP industry, directly reflecting consumer purchasing trends. The increasing demand for expedited services is leading to a greater market share for express delivery solutions. The growing volume of heavier shipments from larger online purchases requires specialized handling capabilities. Furthermore, the evolving needs of the healthcare and BFSI sectors demand that the industry adapt its infrastructure and services to comply with stringent regulatory standards. Continued industry expansion will likely foster consolidation among major players, intensifying competition and spurring innovation in logistics. Opportunities for further growth lie in optimizing last-mile delivery and implementing sustainable transportation initiatives.
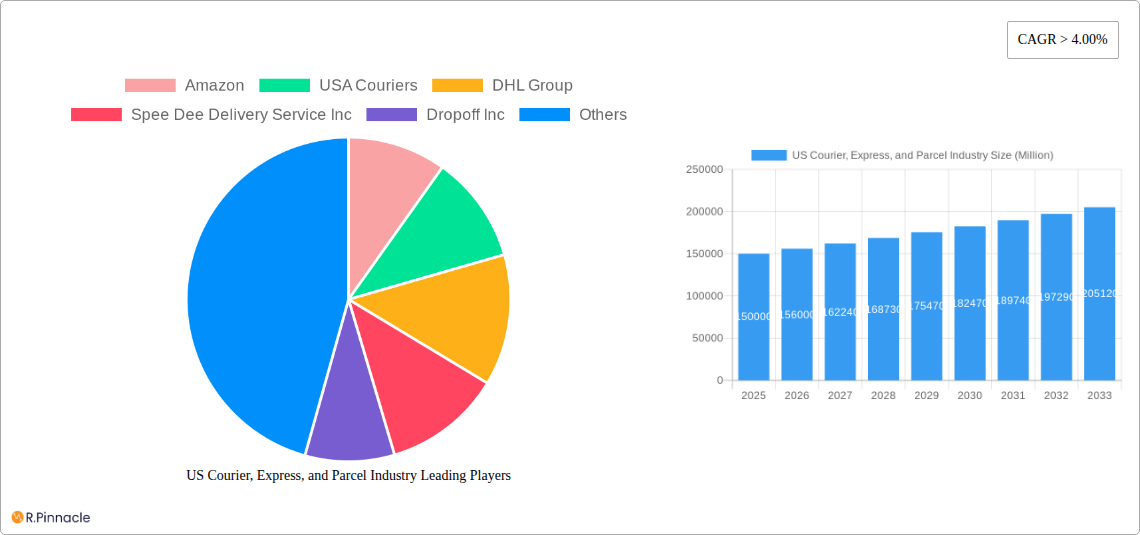
US Courier, Express, and Parcel Industry Company Market Share
US Courier, Express, and Parcel Industry: Market Analysis & Forecast (2025-2033)
This comprehensive report offers critical insights into the US courier, express, and parcel industry, catering to industry professionals, investors, and strategic decision-makers. Spanning the forecast period with a base year of 2025, the analysis delves into market structure, dynamics, key players, and future trends. Benefit from detailed segmentation analysis, growth projections, and a thorough understanding of the competitive landscape. Discover crucial data on market size (130.55 billion), CAGR, and market penetration across various segments.
US Courier, Express, and Parcel Industry Market Structure & Innovation Trends
The US courier, express, and parcel industry is characterized by a dynamic interplay of established giants and emerging players. Market concentration is high, with key players like FedEx, UPS, and USPS holding significant market share. However, the rise of e-commerce and technological advancements have fostered innovation and increased competition. Amazon's aggressive expansion into same-day delivery significantly impacts the market landscape. The regulatory framework, while relatively stable, faces ongoing scrutiny concerning antitrust concerns and environmental regulations. Product substitutes, primarily in the form of alternative delivery models and localized services, exert pressure on traditional players. M&A activity reflects the industry’s ongoing consolidation, with recent deals totaling xx Million USD reflecting attempts to expand geographical reach and service offerings.
- Market Share (Estimated 2025): UPS: xx%, FedEx: xx%, USPS: xx%, Amazon: xx%, Others: xx%
- Recent M&A Activity: DHL's Denver expansion (USD 9.6 Million), other notable deals totaling xx Million USD in the past 5 years.
- Key Innovation Drivers: E-commerce growth, technological advancements (automation, AI), increasing demand for speed and reliability.
US Courier, Express, and Parcel Industry Market Dynamics & Trends
The US courier, express, and parcel market exhibits robust growth, driven primarily by the booming e-commerce sector. The CAGR from 2025-2033 is projected to be xx%. Market penetration in rural areas is increasing, while urban centers show near-saturation. Technological disruptions, such as the adoption of autonomous vehicles and drone delivery, are reshaping operational efficiency and delivery speed. Consumer preferences are shifting towards faster, more convenient, and traceable delivery options, fostering innovation in last-mile delivery solutions. Intense competition is forcing companies to differentiate through pricing strategies, specialized services, and improved customer experience.
Dominant Regions & Segments in US Courier, Express, and Parcel Industry
The US courier, express, and parcel industry demonstrates significant regional variations in growth and market dynamics. While urban areas are currently leading in terms of volume and revenue, significant growth is expected from rural areas due to improved infrastructure and expanding e-commerce reach.
- Dominant Destination: Domestic shipments currently dominate, with international shipping showing strong growth potential.
- Dominant Speed of Delivery: Express delivery continues to be the most lucrative segment, though non-express options cater to cost-sensitive customers.
- Dominant Model: B2C remains the dominant model, followed by B2B. C2C is a smaller but growing segment.
- Dominant Shipment Weight: Medium-weight shipments currently hold the largest share.
- Dominant Mode of Transport: Road transport still dominates due to its flexibility and cost-effectiveness, although air freight is crucial for express deliveries.
- Dominant End-User Industry: E-commerce is the clear leader, followed by wholesale and retail trade (offline) and healthcare.
Key drivers for dominance in these segments include robust e-commerce growth, increasing consumer expectations for fast delivery, and the development of efficient logistics networks.
US Courier, Express, and Parcel Industry Product Innovations
The industry is witnessing significant product innovations, driven by technological advancements. These include automated sorting systems, AI-powered route optimization, real-time tracking capabilities, and the integration of drones and autonomous vehicles for last-mile delivery. These innovations aim to enhance speed, efficiency, and cost-effectiveness, while improving customer satisfaction and creating competitive advantages.
Report Scope & Segmentation Analysis
This report comprehensively analyzes the US courier, express, and parcel industry, segmented by destination (domestic, international), speed of delivery (express, non-express), business model (B2B, B2C, C2C), shipment weight (light, medium, heavy), mode of transport (air, road, others), and end-user industry (e-commerce, BFSI, healthcare, manufacturing, primary industry, wholesale and retail trade, others). Each segment’s growth projections, market sizes, and competitive dynamics are thoroughly examined.
Key Drivers of US Courier, Express, and Parcel Industry Growth
Growth in the US courier, express, and parcel industry is propelled by several factors: the explosive growth of e-commerce, technological advancements leading to automation and efficiency gains, increasing consumer demand for fast and reliable delivery services, and supportive government policies promoting infrastructure development.
Challenges in the US Courier, Express, and Parcel Industry Sector
The industry faces challenges such as rising fuel costs, intense competition, labor shortages, and regulatory hurdles relating to emissions and environmental concerns. These factors impact operational costs and profitability, necessitating strategic adaptations and innovative solutions.
Emerging Opportunities in US Courier, Express, and Parcel Industry
Emerging opportunities exist in the expansion of same-day and next-day delivery services, the integration of advanced technologies like AI and machine learning for route optimization and predictive analytics, and the exploration of new delivery models like drone delivery and autonomous vehicles.
Key Developments in US Courier, Express, and Parcel Industry Industry
- December 2023: Amazon delivered 1 billion packages from Same-Day sites in the US, showcasing its commitment to fast delivery and infrastructure expansion.
- December 2023: Amazon launched a second same-day delivery facility in Massachusetts, expanding its reach and capacity.
- July 2023: DHL Express invested USD 9.6 million in a new Denver facility, enhancing its operational capabilities in a key market.
Future Outlook for US Courier, Express, and Parcel Industry Market
The future outlook for the US courier, express, and parcel industry remains positive. Continued e-commerce growth, technological advancements, and strategic investments in infrastructure will drive significant market expansion. Opportunities for companies focusing on sustainable practices and innovative last-mile delivery solutions will be particularly strong.
US Courier, Express, and Parcel Industry Segmentation
-
1. Destination
- 1.1. Domestic
- 1.2. International
-
2. Speed Of Delivery
- 2.1. Express
- 2.2. Non-Express
-
3. Model
- 3.1. Business-to-Business (B2B)
- 3.2. Business-to-Consumer (B2C)
- 3.3. Consumer-to-Consumer (C2C)
-
4. Shipment Weight
- 4.1. Heavy Weight Shipments
- 4.2. Light Weight Shipments
- 4.3. Medium Weight Shipments
-
5. Mode Of Transport
- 5.1. Air
- 5.2. Road
- 5.3. Others
-
6. End User Industry
- 6.1. E-Commerce
- 6.2. Financial Services (BFSI)
- 6.3. Healthcare
- 6.4. Manufacturing
- 6.5. Primary Industry
- 6.6. Wholesale and Retail Trade (Offline)
- 6.7. Others
US Courier, Express, and Parcel Industry Segmentation By Geography
-
1. North America
- 1.1. United States
- 1.2. Canada
- 1.3. Mexico
-
2. South America
- 2.1. Brazil
- 2.2. Argentina
- 2.3. Rest of South America
-
3. Europe
- 3.1. United Kingdom
- 3.2. Germany
- 3.3. France
- 3.4. Italy
- 3.5. Spain
- 3.6. Russia
- 3.7. Benelux
- 3.8. Nordics
- 3.9. Rest of Europe
-
4. Middle East & Africa
- 4.1. Turkey
- 4.2. Israel
- 4.3. GCC
- 4.4. North Africa
- 4.5. South Africa
- 4.6. Rest of Middle East & Africa
-
5. Asia Pacific
- 5.1. China
- 5.2. India
- 5.3. Japan
- 5.4. South Korea
- 5.5. ASEAN
- 5.6. Oceania
- 5.7. Rest of Asia Pacific
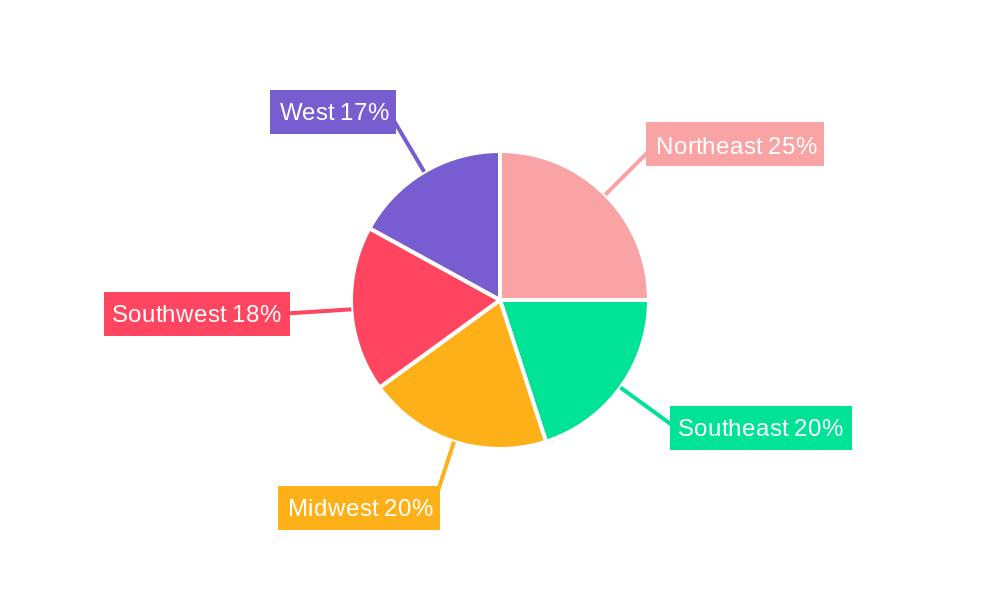
US Courier, Express, and Parcel Industry Regional Market Share
Geographic Coverage of US Courier, Express, and Parcel Industry
US Courier, Express, and Parcel Industry REPORT HIGHLIGHTS
| Aspects | Details |
|---|---|
| Study Period | 2020-2034 |
| Base Year | 2025 |
| Estimated Year | 2026 |
| Forecast Period | 2026-2034 |
| Historical Period | 2020-2025 |
| Growth Rate | CAGR of 8.6% from 2020-2034 |
| Segmentation |
|
Table of Contents
- 1. Introduction
- 1.1. Research Scope
- 1.2. Market Segmentation
- 1.3. Research Objective
- 1.4. Definitions and Assumptions
- 2. Executive Summary
- 2.1. Market Snapshot
- 3. Market Dynamics
- 3.1. Market Drivers
- 3.2. Market Restrains
- 3.3. Market Trends
- 3.4. Market Opportunities
- 4. Market Factor Analysis
- 4.1. Porters Five Forces
- 4.1.1. Bargaining Power of Suppliers
- 4.1.2. Bargaining Power of Buyers
- 4.1.3. Threat of New Entrants
- 4.1.4. Threat of Substitutes
- 4.1.5. Competitive Rivalry
- 4.2. PESTEL analysis
- 4.3. BCG Analysis
- 4.3.1. Stars (High Growth, High Market Share)
- 4.3.2. Cash Cows (Low Growth, High Market Share)
- 4.3.3. Question Mark (High Growth, Low Market Share)
- 4.3.4. Dogs (Low Growth, Low Market Share)
- 4.4. Ansoff Matrix Analysis
- 4.5. Supply Chain Analysis
- 4.6. Regulatory Landscape
- 4.7. Current Market Potential and Opportunity Assessment (TAM–SAM–SOM Framework)
- 4.8. PRI Analyst Note
- 4.1. Porters Five Forces
- 5. Market Analysis, Insights and Forecast 2021-2033
- 5.1. Market Analysis, Insights and Forecast - by Destination
- 5.1.1. Domestic
- 5.1.2. International
- 5.2. Market Analysis, Insights and Forecast - by Speed Of Delivery
- 5.2.1. Express
- 5.2.2. Non-Express
- 5.3. Market Analysis, Insights and Forecast - by Model
- 5.3.1. Business-to-Business (B2B)
- 5.3.2. Business-to-Consumer (B2C)
- 5.3.3. Consumer-to-Consumer (C2C)
- 5.4. Market Analysis, Insights and Forecast - by Shipment Weight
- 5.4.1. Heavy Weight Shipments
- 5.4.2. Light Weight Shipments
- 5.4.3. Medium Weight Shipments
- 5.5. Market Analysis, Insights and Forecast - by Mode Of Transport
- 5.5.1. Air
- 5.5.2. Road
- 5.5.3. Others
- 5.6. Market Analysis, Insights and Forecast - by End User Industry
- 5.6.1. E-Commerce
- 5.6.2. Financial Services (BFSI)
- 5.6.3. Healthcare
- 5.6.4. Manufacturing
- 5.6.5. Primary Industry
- 5.6.6. Wholesale and Retail Trade (Offline)
- 5.6.7. Others
- 5.7. Market Analysis, Insights and Forecast - by Region
- 5.7.1. North America
- 5.7.2. South America
- 5.7.3. Europe
- 5.7.4. Middle East & Africa
- 5.7.5. Asia Pacific
- 5.1. Market Analysis, Insights and Forecast - by Destination
- 6. Global US Courier, Express, and Parcel Industry Analysis, Insights and Forecast, 2021-2033
- 6.1. Market Analysis, Insights and Forecast - by Destination
- 6.1.1. Domestic
- 6.1.2. International
- 6.2. Market Analysis, Insights and Forecast - by Speed Of Delivery
- 6.2.1. Express
- 6.2.2. Non-Express
- 6.3. Market Analysis, Insights and Forecast - by Model
- 6.3.1. Business-to-Business (B2B)
- 6.3.2. Business-to-Consumer (B2C)
- 6.3.3. Consumer-to-Consumer (C2C)
- 6.4. Market Analysis, Insights and Forecast - by Shipment Weight
- 6.4.1. Heavy Weight Shipments
- 6.4.2. Light Weight Shipments
- 6.4.3. Medium Weight Shipments
- 6.5. Market Analysis, Insights and Forecast - by Mode Of Transport
- 6.5.1. Air
- 6.5.2. Road
- 6.5.3. Others
- 6.6. Market Analysis, Insights and Forecast - by End User Industry
- 6.6.1. E-Commerce
- 6.6.2. Financial Services (BFSI)
- 6.6.3. Healthcare
- 6.6.4. Manufacturing
- 6.6.5. Primary Industry
- 6.6.6. Wholesale and Retail Trade (Offline)
- 6.6.7. Others
- 6.1. Market Analysis, Insights and Forecast - by Destination
- 7. North America US Courier, Express, and Parcel Industry Analysis, Insights and Forecast, 2020-2032
- 7.1. Market Analysis, Insights and Forecast - by Destination
- 7.1.1. Domestic
- 7.1.2. International
- 7.2. Market Analysis, Insights and Forecast - by Speed Of Delivery
- 7.2.1. Express
- 7.2.2. Non-Express
- 7.3. Market Analysis, Insights and Forecast - by Model
- 7.3.1. Business-to-Business (B2B)
- 7.3.2. Business-to-Consumer (B2C)
- 7.3.3. Consumer-to-Consumer (C2C)
- 7.4. Market Analysis, Insights and Forecast - by Shipment Weight
- 7.4.1. Heavy Weight Shipments
- 7.4.2. Light Weight Shipments
- 7.4.3. Medium Weight Shipments
- 7.5. Market Analysis, Insights and Forecast - by Mode Of Transport
- 7.5.1. Air
- 7.5.2. Road
- 7.5.3. Others
- 7.6. Market Analysis, Insights and Forecast - by End User Industry
- 7.6.1. E-Commerce
- 7.6.2. Financial Services (BFSI)
- 7.6.3. Healthcare
- 7.6.4. Manufacturing
- 7.6.5. Primary Industry
- 7.6.6. Wholesale and Retail Trade (Offline)
- 7.6.7. Others
- 7.1. Market Analysis, Insights and Forecast - by Destination
- 8. South America US Courier, Express, and Parcel Industry Analysis, Insights and Forecast, 2020-2032
- 8.1. Market Analysis, Insights and Forecast - by Destination
- 8.1.1. Domestic
- 8.1.2. International
- 8.2. Market Analysis, Insights and Forecast - by Speed Of Delivery
- 8.2.1. Express
- 8.2.2. Non-Express
- 8.3. Market Analysis, Insights and Forecast - by Model
- 8.3.1. Business-to-Business (B2B)
- 8.3.2. Business-to-Consumer (B2C)
- 8.3.3. Consumer-to-Consumer (C2C)
- 8.4. Market Analysis, Insights and Forecast - by Shipment Weight
- 8.4.1. Heavy Weight Shipments
- 8.4.2. Light Weight Shipments
- 8.4.3. Medium Weight Shipments
- 8.5. Market Analysis, Insights and Forecast - by Mode Of Transport
- 8.5.1. Air
- 8.5.2. Road
- 8.5.3. Others
- 8.6. Market Analysis, Insights and Forecast - by End User Industry
- 8.6.1. E-Commerce
- 8.6.2. Financial Services (BFSI)
- 8.6.3. Healthcare
- 8.6.4. Manufacturing
- 8.6.5. Primary Industry
- 8.6.6. Wholesale and Retail Trade (Offline)
- 8.6.7. Others
- 8.1. Market Analysis, Insights and Forecast - by Destination
- 9. Europe US Courier, Express, and Parcel Industry Analysis, Insights and Forecast, 2020-2032
- 9.1. Market Analysis, Insights and Forecast - by Destination
- 9.1.1. Domestic
- 9.1.2. International
- 9.2. Market Analysis, Insights and Forecast - by Speed Of Delivery
- 9.2.1. Express
- 9.2.2. Non-Express
- 9.3. Market Analysis, Insights and Forecast - by Model
- 9.3.1. Business-to-Business (B2B)
- 9.3.2. Business-to-Consumer (B2C)
- 9.3.3. Consumer-to-Consumer (C2C)
- 9.4. Market Analysis, Insights and Forecast - by Shipment Weight
- 9.4.1. Heavy Weight Shipments
- 9.4.2. Light Weight Shipments
- 9.4.3. Medium Weight Shipments
- 9.5. Market Analysis, Insights and Forecast - by Mode Of Transport
- 9.5.1. Air
- 9.5.2. Road
- 9.5.3. Others
- 9.6. Market Analysis, Insights and Forecast - by End User Industry
- 9.6.1. E-Commerce
- 9.6.2. Financial Services (BFSI)
- 9.6.3. Healthcare
- 9.6.4. Manufacturing
- 9.6.5. Primary Industry
- 9.6.6. Wholesale and Retail Trade (Offline)
- 9.6.7. Others
- 9.1. Market Analysis, Insights and Forecast - by Destination
- 10. Middle East & Africa US Courier, Express, and Parcel Industry Analysis, Insights and Forecast, 2020-2032
- 10.1. Market Analysis, Insights and Forecast - by Destination
- 10.1.1. Domestic
- 10.1.2. International
- 10.2. Market Analysis, Insights and Forecast - by Speed Of Delivery
- 10.2.1. Express
- 10.2.2. Non-Express
- 10.3. Market Analysis, Insights and Forecast - by Model
- 10.3.1. Business-to-Business (B2B)
- 10.3.2. Business-to-Consumer (B2C)
- 10.3.3. Consumer-to-Consumer (C2C)
- 10.4. Market Analysis, Insights and Forecast - by Shipment Weight
- 10.4.1. Heavy Weight Shipments
- 10.4.2. Light Weight Shipments
- 10.4.3. Medium Weight Shipments
- 10.5. Market Analysis, Insights and Forecast - by Mode Of Transport
- 10.5.1. Air
- 10.5.2. Road
- 10.5.3. Others
- 10.6. Market Analysis, Insights and Forecast - by End User Industry
- 10.6.1. E-Commerce
- 10.6.2. Financial Services (BFSI)
- 10.6.3. Healthcare
- 10.6.4. Manufacturing
- 10.6.5. Primary Industry
- 10.6.6. Wholesale and Retail Trade (Offline)
- 10.6.7. Others
- 10.1. Market Analysis, Insights and Forecast - by Destination
- 11. Asia Pacific US Courier, Express, and Parcel Industry Analysis, Insights and Forecast, 2020-2032
- 11.1. Market Analysis, Insights and Forecast - by Destination
- 11.1.1. Domestic
- 11.1.2. International
- 11.2. Market Analysis, Insights and Forecast - by Speed Of Delivery
- 11.2.1. Express
- 11.2.2. Non-Express
- 11.3. Market Analysis, Insights and Forecast - by Model
- 11.3.1. Business-to-Business (B2B)
- 11.3.2. Business-to-Consumer (B2C)
- 11.3.3. Consumer-to-Consumer (C2C)
- 11.4. Market Analysis, Insights and Forecast - by Shipment Weight
- 11.4.1. Heavy Weight Shipments
- 11.4.2. Light Weight Shipments
- 11.4.3. Medium Weight Shipments
- 11.5. Market Analysis, Insights and Forecast - by Mode Of Transport
- 11.5.1. Air
- 11.5.2. Road
- 11.5.3. Others
- 11.6. Market Analysis, Insights and Forecast - by End User Industry
- 11.6.1. E-Commerce
- 11.6.2. Financial Services (BFSI)
- 11.6.3. Healthcare
- 11.6.4. Manufacturing
- 11.6.5. Primary Industry
- 11.6.6. Wholesale and Retail Trade (Offline)
- 11.6.7. Others
- 11.1. Market Analysis, Insights and Forecast - by Destination
- 12. Competitive Analysis
- 12.1. Company Profiles
- 12.1.1 Amazon
- 12.1.1.1. Company Overview
- 12.1.1.2. Products
- 12.1.1.3. Company Financials
- 12.1.1.4. SWOT Analysis
- 12.1.2 USA Couriers
- 12.1.2.1. Company Overview
- 12.1.2.2. Products
- 12.1.2.3. Company Financials
- 12.1.2.4. SWOT Analysis
- 12.1.3 DHL Group
- 12.1.3.1. Company Overview
- 12.1.3.2. Products
- 12.1.3.3. Company Financials
- 12.1.3.4. SWOT Analysis
- 12.1.4 Spee Dee Delivery Service Inc
- 12.1.4.1. Company Overview
- 12.1.4.2. Products
- 12.1.4.3. Company Financials
- 12.1.4.4. SWOT Analysis
- 12.1.5 Dropoff Inc
- 12.1.5.1. Company Overview
- 12.1.5.2. Products
- 12.1.5.3. Company Financials
- 12.1.5.4. SWOT Analysis
- 12.1.6 Yellow Corporatio
- 12.1.6.1. Company Overview
- 12.1.6.2. Products
- 12.1.6.3. Company Financials
- 12.1.6.4. SWOT Analysis
- 12.1.7 FedEx
- 12.1.7.1. Company Overview
- 12.1.7.2. Products
- 12.1.7.3. Company Financials
- 12.1.7.4. SWOT Analysis
- 12.1.8 United Parcel Service of America Inc (UPS)
- 12.1.8.1. Company Overview
- 12.1.8.2. Products
- 12.1.8.3. Company Financials
- 12.1.8.4. SWOT Analysis
- 12.1.9 USPS
- 12.1.9.1. Company Overview
- 12.1.9.2. Products
- 12.1.9.3. Company Financials
- 12.1.9.4. SWOT Analysis
- 12.1.10 International Distributions Services (including GLS)
- 12.1.10.1. Company Overview
- 12.1.10.2. Products
- 12.1.10.3. Company Financials
- 12.1.10.4. SWOT Analysis
- 12.1.11 OnTrac
- 12.1.11.1. Company Overview
- 12.1.11.2. Products
- 12.1.11.3. Company Financials
- 12.1.11.4. SWOT Analysis
- 12.1.12 Aramex
- 12.1.12.1. Company Overview
- 12.1.12.2. Products
- 12.1.12.3. Company Financials
- 12.1.12.4. SWOT Analysis
- 12.1.1 Amazon
- 12.2. Market Entropy
- 12.2.1 Company's Key Areas Served
- 12.2.2 Recent Developments
- 12.3. Company Market Share Analysis 2025
- 12.3.1 Top 5 Companies Market Share Analysis
- 12.3.2 Top 3 Companies Market Share Analysis
- 12.4. List of Potential Customers
- 13. Research Methodology
List of Figures
- Figure 1: Global US Courier, Express, and Parcel Industry Revenue Breakdown (billion, %) by Region 2025 & 2033
- Figure 2: North America US Courier, Express, and Parcel Industry Revenue (billion), by Destination 2025 & 2033
- Figure 3: North America US Courier, Express, and Parcel Industry Revenue Share (%), by Destination 2025 & 2033
- Figure 4: North America US Courier, Express, and Parcel Industry Revenue (billion), by Speed Of Delivery 2025 & 2033
- Figure 5: North America US Courier, Express, and Parcel Industry Revenue Share (%), by Speed Of Delivery 2025 & 2033
- Figure 6: North America US Courier, Express, and Parcel Industry Revenue (billion), by Model 2025 & 2033
- Figure 7: North America US Courier, Express, and Parcel Industry Revenue Share (%), by Model 2025 & 2033
- Figure 8: North America US Courier, Express, and Parcel Industry Revenue (billion), by Shipment Weight 2025 & 2033
- Figure 9: North America US Courier, Express, and Parcel Industry Revenue Share (%), by Shipment Weight 2025 & 2033
- Figure 10: North America US Courier, Express, and Parcel Industry Revenue (billion), by Mode Of Transport 2025 & 2033
- Figure 11: North America US Courier, Express, and Parcel Industry Revenue Share (%), by Mode Of Transport 2025 & 2033
- Figure 12: North America US Courier, Express, and Parcel Industry Revenue (billion), by End User Industry 2025 & 2033
- Figure 13: North America US Courier, Express, and Parcel Industry Revenue Share (%), by End User Industry 2025 & 2033
- Figure 14: North America US Courier, Express, and Parcel Industry Revenue (billion), by Country 2025 & 2033
- Figure 15: North America US Courier, Express, and Parcel Industry Revenue Share (%), by Country 2025 & 2033
- Figure 16: South America US Courier, Express, and Parcel Industry Revenue (billion), by Destination 2025 & 2033
- Figure 17: South America US Courier, Express, and Parcel Industry Revenue Share (%), by Destination 2025 & 2033
- Figure 18: South America US Courier, Express, and Parcel Industry Revenue (billion), by Speed Of Delivery 2025 & 2033
- Figure 19: South America US Courier, Express, and Parcel Industry Revenue Share (%), by Speed Of Delivery 2025 & 2033
- Figure 20: South America US Courier, Express, and Parcel Industry Revenue (billion), by Model 2025 & 2033
- Figure 21: South America US Courier, Express, and Parcel Industry Revenue Share (%), by Model 2025 & 2033
- Figure 22: South America US Courier, Express, and Parcel Industry Revenue (billion), by Shipment Weight 2025 & 2033
- Figure 23: South America US Courier, Express, and Parcel Industry Revenue Share (%), by Shipment Weight 2025 & 2033
- Figure 24: South America US Courier, Express, and Parcel Industry Revenue (billion), by Mode Of Transport 2025 & 2033
- Figure 25: South America US Courier, Express, and Parcel Industry Revenue Share (%), by Mode Of Transport 2025 & 2033
- Figure 26: South America US Courier, Express, and Parcel Industry Revenue (billion), by End User Industry 2025 & 2033
- Figure 27: South America US Courier, Express, and Parcel Industry Revenue Share (%), by End User Industry 2025 & 2033
- Figure 28: South America US Courier, Express, and Parcel Industry Revenue (billion), by Country 2025 & 2033
- Figure 29: South America US Courier, Express, and Parcel Industry Revenue Share (%), by Country 2025 & 2033
- Figure 30: Europe US Courier, Express, and Parcel Industry Revenue (billion), by Destination 2025 & 2033
- Figure 31: Europe US Courier, Express, and Parcel Industry Revenue Share (%), by Destination 2025 & 2033
- Figure 32: Europe US Courier, Express, and Parcel Industry Revenue (billion), by Speed Of Delivery 2025 & 2033
- Figure 33: Europe US Courier, Express, and Parcel Industry Revenue Share (%), by Speed Of Delivery 2025 & 2033
- Figure 34: Europe US Courier, Express, and Parcel Industry Revenue (billion), by Model 2025 & 2033
- Figure 35: Europe US Courier, Express, and Parcel Industry Revenue Share (%), by Model 2025 & 2033
- Figure 36: Europe US Courier, Express, and Parcel Industry Revenue (billion), by Shipment Weight 2025 & 2033
- Figure 37: Europe US Courier, Express, and Parcel Industry Revenue Share (%), by Shipment Weight 2025 & 2033
- Figure 38: Europe US Courier, Express, and Parcel Industry Revenue (billion), by Mode Of Transport 2025 & 2033
- Figure 39: Europe US Courier, Express, and Parcel Industry Revenue Share (%), by Mode Of Transport 2025 & 2033
- Figure 40: Europe US Courier, Express, and Parcel Industry Revenue (billion), by End User Industry 2025 & 2033
- Figure 41: Europe US Courier, Express, and Parcel Industry Revenue Share (%), by End User Industry 2025 & 2033
- Figure 42: Europe US Courier, Express, and Parcel Industry Revenue (billion), by Country 2025 & 2033
- Figure 43: Europe US Courier, Express, and Parcel Industry Revenue Share (%), by Country 2025 & 2033
- Figure 44: Middle East & Africa US Courier, Express, and Parcel Industry Revenue (billion), by Destination 2025 & 2033
- Figure 45: Middle East & Africa US Courier, Express, and Parcel Industry Revenue Share (%), by Destination 2025 & 2033
- Figure 46: Middle East & Africa US Courier, Express, and Parcel Industry Revenue (billion), by Speed Of Delivery 2025 & 2033
- Figure 47: Middle East & Africa US Courier, Express, and Parcel Industry Revenue Share (%), by Speed Of Delivery 2025 & 2033
- Figure 48: Middle East & Africa US Courier, Express, and Parcel Industry Revenue (billion), by Model 2025 & 2033
- Figure 49: Middle East & Africa US Courier, Express, and Parcel Industry Revenue Share (%), by Model 2025 & 2033
- Figure 50: Middle East & Africa US Courier, Express, and Parcel Industry Revenue (billion), by Shipment Weight 2025 & 2033
- Figure 51: Middle East & Africa US Courier, Express, and Parcel Industry Revenue Share (%), by Shipment Weight 2025 & 2033
- Figure 52: Middle East & Africa US Courier, Express, and Parcel Industry Revenue (billion), by Mode Of Transport 2025 & 2033
- Figure 53: Middle East & Africa US Courier, Express, and Parcel Industry Revenue Share (%), by Mode Of Transport 2025 & 2033
- Figure 54: Middle East & Africa US Courier, Express, and Parcel Industry Revenue (billion), by End User Industry 2025 & 2033
- Figure 55: Middle East & Africa US Courier, Express, and Parcel Industry Revenue Share (%), by End User Industry 2025 & 2033
- Figure 56: Middle East & Africa US Courier, Express, and Parcel Industry Revenue (billion), by Country 2025 & 2033
- Figure 57: Middle East & Africa US Courier, Express, and Parcel Industry Revenue Share (%), by Country 2025 & 2033
- Figure 58: Asia Pacific US Courier, Express, and Parcel Industry Revenue (billion), by Destination 2025 & 2033
- Figure 59: Asia Pacific US Courier, Express, and Parcel Industry Revenue Share (%), by Destination 2025 & 2033
- Figure 60: Asia Pacific US Courier, Express, and Parcel Industry Revenue (billion), by Speed Of Delivery 2025 & 2033
- Figure 61: Asia Pacific US Courier, Express, and Parcel Industry Revenue Share (%), by Speed Of Delivery 2025 & 2033
- Figure 62: Asia Pacific US Courier, Express, and Parcel Industry Revenue (billion), by Model 2025 & 2033
- Figure 63: Asia Pacific US Courier, Express, and Parcel Industry Revenue Share (%), by Model 2025 & 2033
- Figure 64: Asia Pacific US Courier, Express, and Parcel Industry Revenue (billion), by Shipment Weight 2025 & 2033
- Figure 65: Asia Pacific US Courier, Express, and Parcel Industry Revenue Share (%), by Shipment Weight 2025 & 2033
- Figure 66: Asia Pacific US Courier, Express, and Parcel Industry Revenue (billion), by Mode Of Transport 2025 & 2033
- Figure 67: Asia Pacific US Courier, Express, and Parcel Industry Revenue Share (%), by Mode Of Transport 2025 & 2033
- Figure 68: Asia Pacific US Courier, Express, and Parcel Industry Revenue (billion), by End User Industry 2025 & 2033
- Figure 69: Asia Pacific US Courier, Express, and Parcel Industry Revenue Share (%), by End User Industry 2025 & 2033
- Figure 70: Asia Pacific US Courier, Express, and Parcel Industry Revenue (billion), by Country 2025 & 2033
- Figure 71: Asia Pacific US Courier, Express, and Parcel Industry Revenue Share (%), by Country 2025 & 2033
List of Tables
- Table 1: Global US Courier, Express, and Parcel Industry Revenue billion Forecast, by Destination 2020 & 2033
- Table 2: Global US Courier, Express, and Parcel Industry Revenue billion Forecast, by Speed Of Delivery 2020 & 2033
- Table 3: Global US Courier, Express, and Parcel Industry Revenue billion Forecast, by Model 2020 & 2033
- Table 4: Global US Courier, Express, and Parcel Industry Revenue billion Forecast, by Shipment Weight 2020 & 2033
- Table 5: Global US Courier, Express, and Parcel Industry Revenue billion Forecast, by Mode Of Transport 2020 & 2033
- Table 6: Global US Courier, Express, and Parcel Industry Revenue billion Forecast, by End User Industry 2020 & 2033
- Table 7: Global US Courier, Express, and Parcel Industry Revenue billion Forecast, by Region 2020 & 2033
- Table 8: Global US Courier, Express, and Parcel Industry Revenue billion Forecast, by Destination 2020 & 2033
- Table 9: Global US Courier, Express, and Parcel Industry Revenue billion Forecast, by Speed Of Delivery 2020 & 2033
- Table 10: Global US Courier, Express, and Parcel Industry Revenue billion Forecast, by Model 2020 & 2033
- Table 11: Global US Courier, Express, and Parcel Industry Revenue billion Forecast, by Shipment Weight 2020 & 2033
- Table 12: Global US Courier, Express, and Parcel Industry Revenue billion Forecast, by Mode Of Transport 2020 & 2033
- Table 13: Global US Courier, Express, and Parcel Industry Revenue billion Forecast, by End User Industry 2020 & 2033
- Table 14: Global US Courier, Express, and Parcel Industry Revenue billion Forecast, by Country 2020 & 2033
- Table 15: United States US Courier, Express, and Parcel Industry Revenue (billion) Forecast, by Application 2020 & 2033
- Table 16: Canada US Courier, Express, and Parcel Industry Revenue (billion) Forecast, by Application 2020 & 2033
- Table 17: Mexico US Courier, Express, and Parcel Industry Revenue (billion) Forecast, by Application 2020 & 2033
- Table 18: Global US Courier, Express, and Parcel Industry Revenue billion Forecast, by Destination 2020 & 2033
- Table 19: Global US Courier, Express, and Parcel Industry Revenue billion Forecast, by Speed Of Delivery 2020 & 2033
- Table 20: Global US Courier, Express, and Parcel Industry Revenue billion Forecast, by Model 2020 & 2033
- Table 21: Global US Courier, Express, and Parcel Industry Revenue billion Forecast, by Shipment Weight 2020 & 2033
- Table 22: Global US Courier, Express, and Parcel Industry Revenue billion Forecast, by Mode Of Transport 2020 & 2033
- Table 23: Global US Courier, Express, and Parcel Industry Revenue billion Forecast, by End User Industry 2020 & 2033
- Table 24: Global US Courier, Express, and Parcel Industry Revenue billion Forecast, by Country 2020 & 2033
- Table 25: Brazil US Courier, Express, and Parcel Industry Revenue (billion) Forecast, by Application 2020 & 2033
- Table 26: Argentina US Courier, Express, and Parcel Industry Revenue (billion) Forecast, by Application 2020 & 2033
- Table 27: Rest of South America US Courier, Express, and Parcel Industry Revenue (billion) Forecast, by Application 2020 & 2033
- Table 28: Global US Courier, Express, and Parcel Industry Revenue billion Forecast, by Destination 2020 & 2033
- Table 29: Global US Courier, Express, and Parcel Industry Revenue billion Forecast, by Speed Of Delivery 2020 & 2033
- Table 30: Global US Courier, Express, and Parcel Industry Revenue billion Forecast, by Model 2020 & 2033
- Table 31: Global US Courier, Express, and Parcel Industry Revenue billion Forecast, by Shipment Weight 2020 & 2033
- Table 32: Global US Courier, Express, and Parcel Industry Revenue billion Forecast, by Mode Of Transport 2020 & 2033
- Table 33: Global US Courier, Express, and Parcel Industry Revenue billion Forecast, by End User Industry 2020 & 2033
- Table 34: Global US Courier, Express, and Parcel Industry Revenue billion Forecast, by Country 2020 & 2033
- Table 35: United Kingdom US Courier, Express, and Parcel Industry Revenue (billion) Forecast, by Application 2020 & 2033
- Table 36: Germany US Courier, Express, and Parcel Industry Revenue (billion) Forecast, by Application 2020 & 2033
- Table 37: France US Courier, Express, and Parcel Industry Revenue (billion) Forecast, by Application 2020 & 2033
- Table 38: Italy US Courier, Express, and Parcel Industry Revenue (billion) Forecast, by Application 2020 & 2033
- Table 39: Spain US Courier, Express, and Parcel Industry Revenue (billion) Forecast, by Application 2020 & 2033
- Table 40: Russia US Courier, Express, and Parcel Industry Revenue (billion) Forecast, by Application 2020 & 2033
- Table 41: Benelux US Courier, Express, and Parcel Industry Revenue (billion) Forecast, by Application 2020 & 2033
- Table 42: Nordics US Courier, Express, and Parcel Industry Revenue (billion) Forecast, by Application 2020 & 2033
- Table 43: Rest of Europe US Courier, Express, and Parcel Industry Revenue (billion) Forecast, by Application 2020 & 2033
- Table 44: Global US Courier, Express, and Parcel Industry Revenue billion Forecast, by Destination 2020 & 2033
- Table 45: Global US Courier, Express, and Parcel Industry Revenue billion Forecast, by Speed Of Delivery 2020 & 2033
- Table 46: Global US Courier, Express, and Parcel Industry Revenue billion Forecast, by Model 2020 & 2033
- Table 47: Global US Courier, Express, and Parcel Industry Revenue billion Forecast, by Shipment Weight 2020 & 2033
- Table 48: Global US Courier, Express, and Parcel Industry Revenue billion Forecast, by Mode Of Transport 2020 & 2033
- Table 49: Global US Courier, Express, and Parcel Industry Revenue billion Forecast, by End User Industry 2020 & 2033
- Table 50: Global US Courier, Express, and Parcel Industry Revenue billion Forecast, by Country 2020 & 2033
- Table 51: Turkey US Courier, Express, and Parcel Industry Revenue (billion) Forecast, by Application 2020 & 2033
- Table 52: Israel US Courier, Express, and Parcel Industry Revenue (billion) Forecast, by Application 2020 & 2033
- Table 53: GCC US Courier, Express, and Parcel Industry Revenue (billion) Forecast, by Application 2020 & 2033
- Table 54: North Africa US Courier, Express, and Parcel Industry Revenue (billion) Forecast, by Application 2020 & 2033
- Table 55: South Africa US Courier, Express, and Parcel Industry Revenue (billion) Forecast, by Application 2020 & 2033
- Table 56: Rest of Middle East & Africa US Courier, Express, and Parcel Industry Revenue (billion) Forecast, by Application 2020 & 2033
- Table 57: Global US Courier, Express, and Parcel Industry Revenue billion Forecast, by Destination 2020 & 2033
- Table 58: Global US Courier, Express, and Parcel Industry Revenue billion Forecast, by Speed Of Delivery 2020 & 2033
- Table 59: Global US Courier, Express, and Parcel Industry Revenue billion Forecast, by Model 2020 & 2033
- Table 60: Global US Courier, Express, and Parcel Industry Revenue billion Forecast, by Shipment Weight 2020 & 2033
- Table 61: Global US Courier, Express, and Parcel Industry Revenue billion Forecast, by Mode Of Transport 2020 & 2033
- Table 62: Global US Courier, Express, and Parcel Industry Revenue billion Forecast, by End User Industry 2020 & 2033
- Table 63: Global US Courier, Express, and Parcel Industry Revenue billion Forecast, by Country 2020 & 2033
- Table 64: China US Courier, Express, and Parcel Industry Revenue (billion) Forecast, by Application 2020 & 2033
- Table 65: India US Courier, Express, and Parcel Industry Revenue (billion) Forecast, by Application 2020 & 2033
- Table 66: Japan US Courier, Express, and Parcel Industry Revenue (billion) Forecast, by Application 2020 & 2033
- Table 67: South Korea US Courier, Express, and Parcel Industry Revenue (billion) Forecast, by Application 2020 & 2033
- Table 68: ASEAN US Courier, Express, and Parcel Industry Revenue (billion) Forecast, by Application 2020 & 2033
- Table 69: Oceania US Courier, Express, and Parcel Industry Revenue (billion) Forecast, by Application 2020 & 2033
- Table 70: Rest of Asia Pacific US Courier, Express, and Parcel Industry Revenue (billion) Forecast, by Application 2020 & 2033
Frequently Asked Questions
1. What is the projected Compound Annual Growth Rate (CAGR) of the US Courier, Express, and Parcel Industry?
The projected CAGR is approximately 8.6%.
2. Which companies are prominent players in the US Courier, Express, and Parcel Industry?
Key companies in the market include Amazon, USA Couriers, DHL Group, Spee Dee Delivery Service Inc, Dropoff Inc, Yellow Corporatio, FedEx, United Parcel Service of America Inc (UPS), USPS, International Distributions Services (including GLS), OnTrac, Aramex.
3. What are the main segments of the US Courier, Express, and Parcel Industry?
The market segments include Destination, Speed Of Delivery, Model, Shipment Weight, Mode Of Transport, End User Industry.
4. Can you provide details about the market size?
The market size is estimated to be USD 130.55 billion as of 2022.
5. What are some drivers contributing to market growth?
Increasing consumption of canned and frozen food; Growth urbanization and increased adoption of healthy lifestyle.
6. What are the notable trends driving market growth?
OTHER KEY INDUSTRY TRENDS COVERED IN THE REPORT.
7. Are there any restraints impacting market growth?
Limited self-life of frozen food; Growing awareness regarding the consumption of fresh vegetables and fruits.
8. Can you provide examples of recent developments in the market?
December 2023: Amazon has delivered 1 billion packages from Same-Day sites in the United States. The same-day delivery facilities are designed for quick deliveries, fulfillment, and sorting all from one site making delivering customer packages even faster.December 2023: Amazon has launched 2nd same-day delivery facility in Massachusetts for certain towns and cities in Central Massachusetts. It is a 200,000-square-foot, custom-built site launched in Westborough. It was a part of its plan to expand its same-day delivery services in Massachusetts.July 2023: With the USD 9.6 million investment, DHL Express acquired a location closer to the commercial core in downtown Denver. The new DHL Service Point includes nearly 56,000 sq. ft of combined warehouse and office space, along with 60 positions for vehicles to load and unload shipments around its conveyable sorting system.
9. What pricing options are available for accessing the report?
Pricing options include single-user, multi-user, and enterprise licenses priced at USD 3800, USD 4500, and USD 5800 respectively.
10. Is the market size provided in terms of value or volume?
The market size is provided in terms of value, measured in billion.
11. Are there any specific market keywords associated with the report?
Yes, the market keyword associated with the report is "US Courier, Express, and Parcel Industry," which aids in identifying and referencing the specific market segment covered.
12. How do I determine which pricing option suits my needs best?
The pricing options vary based on user requirements and access needs. Individual users may opt for single-user licenses, while businesses requiring broader access may choose multi-user or enterprise licenses for cost-effective access to the report.
13. Are there any additional resources or data provided in the US Courier, Express, and Parcel Industry report?
While the report offers comprehensive insights, it's advisable to review the specific contents or supplementary materials provided to ascertain if additional resources or data are available.
14. How can I stay updated on further developments or reports in the US Courier, Express, and Parcel Industry?
To stay informed about further developments, trends, and reports in the US Courier, Express, and Parcel Industry, consider subscribing to industry newsletters, following relevant companies and organizations, or regularly checking reputable industry news sources and publications.
Methodology
Step 1 - Identification of Relevant Samples Size from Population Database


Step 2 - Approaches for Defining Global Market Size (Value, Volume* & Price*)

Note*: In applicable scenarios
Step 3 - Data Sources
Primary Research
- Web Analytics
- Survey Reports
- Research Institute
- Latest Research Reports
- Opinion Leaders
Secondary Research
- Annual Reports
- White Paper
- Latest Press Release
- Industry Association
- Paid Database
- Investor Presentations

Step 4 - Data Triangulation
Involves using different sources of information in order to increase the validity of a study
These sources are likely to be stakeholders in a program - participants, other researchers, program staff, other community members, and so on.
Then we put all data in single framework & apply various statistical tools to find out the dynamic on the market.
During the analysis stage, feedback from the stakeholder groups would be compared to determine areas of agreement as well as areas of divergence