US Farm Equipment Industry Navigating Dynamics Comprehensive Analysis and Forecasts 2025-2033

US Farm Equipment Industry by Production Analysis, by Consumption Analysis, by Import Market Analysis (Value & Volume), by Export Market Analysis (Value & Volume), by Price Trend Analysis, by North America (United States, Canada, Mexico), by South America (Brazil, Argentina, Rest of South America), by Europe (United Kingdom, Germany, France, Italy, Spain, Russia, Benelux, Nordics, Rest of Europe), by Middle East & Africa (Turkey, Israel, GCC, North Africa, South Africa, Rest of Middle East & Africa), by Asia Pacific (China, India, Japan, South Korea, ASEAN, Oceania, Rest of Asia Pacific) Forecast 2025-2033

Jul 3 2025
Base Year: 2024

150 Pages
Main Logo

US Farm Equipment Industry Navigating Dynamics Comprehensive Analysis and Forecasts 2025-2033


Home
Industries
Agriculture
sponsor image

Tailored for you

  • In-depth Analysis Tailored to Specified Regions or Segments
  • Company Profiles Customized to User Preferences
  • Comprehensive Insights Focused on Specific Segments or Regions
  • Customized Evaluation of Competitive Landscape to Meet Your Needs
  • Tailored Customization to Address Other Specific Requirements
Ask for customization


Key Insights

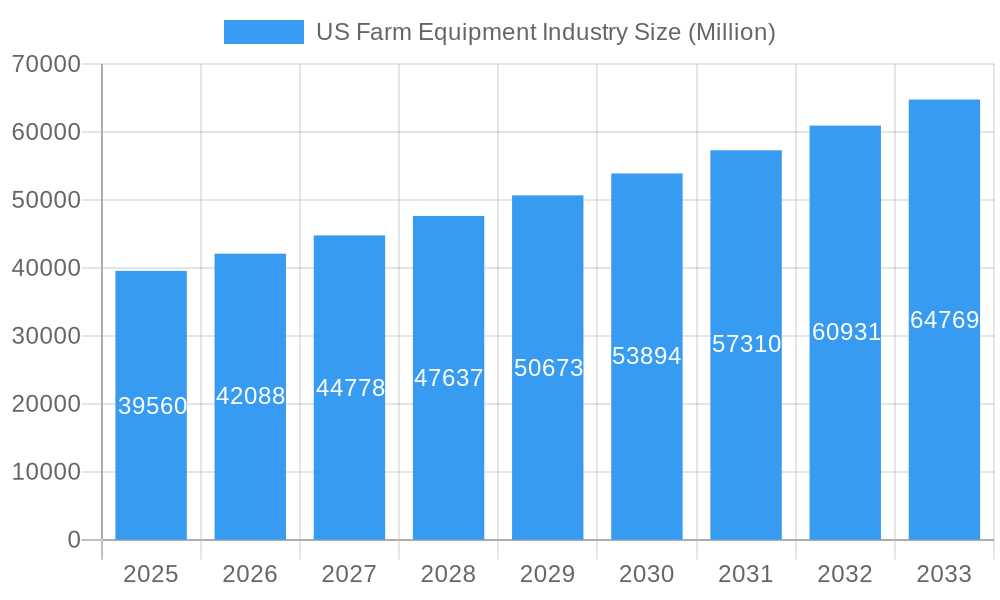
The US farm equipment market, valued at $39.56 billion in 2025, is projected to experience robust growth, driven by several key factors. Increased adoption of precision agriculture technologies, including GPS-guided machinery, automated systems, and data analytics, is significantly boosting efficiency and yields, leading to higher demand for advanced farm equipment. Government initiatives promoting sustainable farming practices and investments in agricultural infrastructure further fuel market expansion. The rising global population and the consequent need for increased food production are also major contributors to this growth. Furthermore, favorable government policies supporting technological advancements in agriculture and encouraging the adoption of modern farming techniques contribute significantly to market expansion.
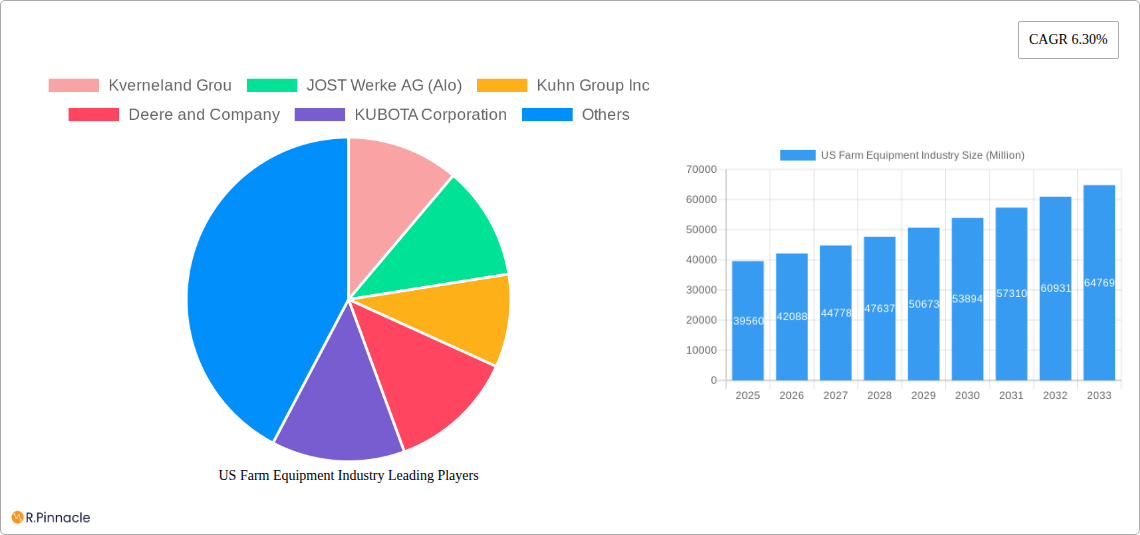
Segment-wise, the harvesting machinery segment, encompassing combine harvesters and forage harvesters, commands a significant market share due to their crucial role in post-harvest operations. The planting machinery segment, including seed drills and planters, also exhibits substantial growth, driven by the increasing adoption of precision planting techniques for optimized seed distribution and germination. However, the market faces certain restraints, including fluctuating commodity prices and the high initial investment costs associated with advanced farm equipment. Nevertheless, the long-term prospects for the US farm equipment market remain positive, with consistent growth expected throughout the forecast period (2025-2033) fueled by technological innovation and the ever-growing demand for efficient and sustainable agricultural practices. Key players like Deere & Company, John Deere, AGCO, and Kubota are actively innovating and expanding their product portfolios to cater to evolving farmer needs, further shaping the market landscape.

US Farm Equipment Industry Research Report - Market Size, Growth & Forecast

US Farm Equipment Industry Report: 2019-2033 Forecast

This comprehensive report provides an in-depth analysis of the US farm equipment industry, offering valuable insights for industry professionals, investors, and stakeholders. We analyze market trends, key players, and future growth prospects, covering the period from 2019 to 2033, with a focus on 2025. This report is crucial for understanding the dynamic landscape of US agriculture and making informed strategic decisions.

US Farm Equipment Industry Market Structure & Innovation Trends

The US farm equipment market is characterized by a moderately concentrated structure, with several major players holding significant market share. Deere & Company, AGCO Corporation, and CNH Industrial are dominant forces, collectively accounting for an estimated xx% of the market in 2025. However, smaller players like Kubota Corporation and Mahindra Agriculture North America are increasingly competitive, particularly in specialized segments. Innovation is driven by the need for increased efficiency, precision agriculture, and sustainable farming practices. Stringent environmental regulations and the growing adoption of automation and autonomy are key drivers. The market is also witnessing significant M&A activity, as evidenced by recent deals with estimated values totaling $xx Million. For instance, AGCO’s acquisition of JCA Industries in May 2022 demonstrates the industry’s focus on enhancing technological capabilities.

  • Market Concentration: High (xx% market share held by top 3 players in 2025).
  • Key Innovation Drivers: Precision agriculture, automation, sustainability, environmental regulations.
  • M&A Activity: Significant, with deals totaling $xx Million in recent years.
  • Product Substitutes: Limited, but alternative farming practices and technologies are emerging.
  • End-User Demographics: Shifting towards larger, more technologically advanced farms.
US Farm Equipment Industry Growth

US Farm Equipment Industry Market Dynamics & Trends

The US farm equipment market is projected to experience a Compound Annual Growth Rate (CAGR) of xx% during the forecast period (2025-2033). Key growth drivers include increasing demand for high-yield crops, technological advancements in precision farming, rising labor costs, and government support for agricultural modernization. However, factors such as economic downturns, commodity price fluctuations, and supply chain disruptions could pose challenges. Market penetration of advanced technologies, such as autonomous tractors and precision planting systems, is expected to increase significantly. The growing adoption of data-driven decision-making and the integration of IoT (Internet of Things) devices are also transforming the industry. Competitive dynamics are characterized by intense rivalry among major players, leading to continuous product innovation and strategic partnerships.

US Farm Equipment Industry Growth

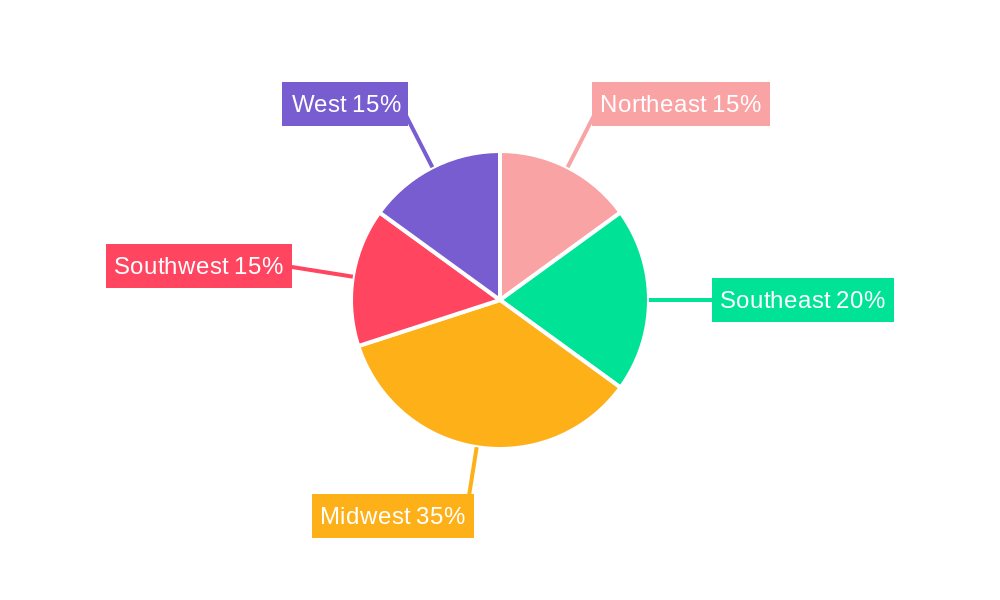
Dominant Regions & Segments in US Farm Equipment Industry

The Midwest region of the US remains the dominant market for farm equipment, driven by its vast agricultural lands and high crop yields. Within segments, planting machinery (seed drills, planters, spreaders) and harvesting machinery (combine harvesters, forage harvesters) represent the largest market shares.

  • Key Drivers for Midwest Dominance:

    • Extensive arable land.
    • High crop production.
    • Established agricultural infrastructure.
    • Favorable government policies.
  • Dominant Segments:

    • Planting Machinery: Strong demand for advanced precision planting technologies.
    • Harvesting Machinery: High adoption of efficient and automated harvesting equipment.

Detailed Dominance Analysis: The Midwest's dominance is due to its historical significance in agriculture, coupled with favorable climate and soil conditions for high-yield crops. This translates into greater demand for advanced machinery compared to other regions.

US Farm Equipment Industry Product Innovations

Recent innovations focus on automation, precision, and data-driven insights. Autonomous tractors, driver-assist harvesting systems, and smart irrigation technologies are gaining traction. These advancements aim to increase efficiency, reduce operational costs, and enhance yields while minimizing environmental impact. The market is witnessing a shift towards modular and interconnected systems that allow for customized solutions based on specific farm needs.

Report Scope & Segmentation Analysis

This report segments the US farm equipment market based on equipment type:

  • Plowing and Cultivating Machinery: Includes ploughs, harrows, cultivators, and tillers. The market size is projected to reach $xx Million by 2033, driven by demand for efficient land preparation techniques.
  • Planting Machinery: Encompasses seed drills, planters, and spreaders. This segment is expected to exhibit strong growth due to precision planting technologies. Projected market size: $xx Million by 2033.
  • Harvesting Machinery: Includes combine harvesters, forage harvesters, and other harvesters. Technological advancements are driving growth in this segment. Projected market size: $xx Million by 2033.
  • Haying and Forage Machinery: Includes mowers and balers. This segment’s growth is tied to livestock farming and the demand for efficient forage harvesting. Projected market size: $xx Million by 2033.
  • Irrigation Machinery: Includes sprinkler and drip irrigation systems. The market is expected to grow due to increasing water scarcity and the need for efficient irrigation techniques. Projected market size: $xx Million by 2033.

Key Drivers of US Farm Equipment Industry Growth

Technological advancements, particularly in precision agriculture and automation, are driving significant growth. Government incentives and subsidies for adopting modern farming technologies also contribute. Furthermore, increasing demand for food production due to population growth and changing dietary preferences bolster market expansion. Finally, the rising cost of labor is compelling farmers to invest in automated equipment.

Challenges in the US Farm Equipment Industry Sector

The industry faces challenges including supply chain disruptions, leading to increased input costs and delays in equipment delivery. Economic downturns impact farmer spending, affecting demand. Furthermore, intense competition among major players creates price pressures. The impact of these challenges is estimated to reduce the overall market growth by xx% in 2025.

Emerging Opportunities in US Farm Equipment Industry

The adoption of data analytics, AI, and IoT technologies presents significant opportunities for growth. Sustainable farming practices are gaining importance, creating demand for eco-friendly equipment. The expansion of precision agriculture techniques presents a large potential market. Finally, the development of autonomous systems offers substantial opportunities for efficiency improvements.

Leading Players in the US Farm Equipment Industry Market

  • Kverneland Group
  • JOST Werke AG (Alo)
  • Kuhn Group Inc
  • Deere and Company
  • KUBOTA Corporation
  • CNH Industrial
  • Farmtrac Tractor Europe
  • AGCO Corporation
  • Deutz-Fahr
  • Mahindra Agriculture North America
  • Claas KGaA mbH

Key Developments in US Farm Equipment Industry Industry

  • December 2022: CNH Industrial launched new automation and autonomy solutions, boosting productivity.
  • May 2022: AGCO acquired JCA Industries to accelerate automation technology development.
  • April 2022: Deere & Company and GUSS Automation formed a joint venture for semi-autonomous sprayers.

Future Outlook for US Farm Equipment Industry Market

The US farm equipment market is poised for continued growth, driven by technological advancements, increasing demand for food, and the growing adoption of sustainable agricultural practices. The focus on precision agriculture, automation, and data-driven decision-making will shape the industry's future. Strategic partnerships and mergers & acquisitions will continue to play a significant role in shaping the competitive landscape.

US Farm Equipment Industry Segmentation

  • 1. Production Analysis
  • 2. Consumption Analysis
  • 3. Import Market Analysis (Value & Volume)
  • 4. Export Market Analysis (Value & Volume)
  • 5. Price Trend Analysis

US Farm Equipment Industry Segmentation By Geography

  • 1. North America
    • 1.1. United States
    • 1.2. Canada
    • 1.3. Mexico
  • 2. South America
    • 2.1. Brazil
    • 2.2. Argentina
    • 2.3. Rest of South America
  • 3. Europe
    • 3.1. United Kingdom
    • 3.2. Germany
    • 3.3. France
    • 3.4. Italy
    • 3.5. Spain
    • 3.6. Russia
    • 3.7. Benelux
    • 3.8. Nordics
    • 3.9. Rest of Europe
  • 4. Middle East & Africa
    • 4.1. Turkey
    • 4.2. Israel
    • 4.3. GCC
    • 4.4. North Africa
    • 4.5. South Africa
    • 4.6. Rest of Middle East & Africa
  • 5. Asia Pacific
    • 5.1. China
    • 5.2. India
    • 5.3. Japan
    • 5.4. South Korea
    • 5.5. ASEAN
    • 5.6. Oceania
    • 5.7. Rest of Asia Pacific
US Farm Equipment Industry Regional Share


US Farm Equipment Industry REPORT HIGHLIGHTS

AspectsDetails
Study Period 2019-2033
Base Year 2024
Estimated Year 2025
Forecast Period2025-2033
Historical Period2019-2024
Growth RateCAGR of 6.30% from 2019-2033
Segmentation
    • By Production Analysis
    • By Consumption Analysis
    • By Import Market Analysis (Value & Volume)
    • By Export Market Analysis (Value & Volume)
    • By Price Trend Analysis
  • By Geography
    • North America
      • United States
      • Canada
      • Mexico
    • South America
      • Brazil
      • Argentina
      • Rest of South America
    • Europe
      • United Kingdom
      • Germany
      • France
      • Italy
      • Spain
      • Russia
      • Benelux
      • Nordics
      • Rest of Europe
    • Middle East & Africa
      • Turkey
      • Israel
      • GCC
      • North Africa
      • South Africa
      • Rest of Middle East & Africa
    • Asia Pacific
      • China
      • India
      • Japan
      • South Korea
      • ASEAN
      • Oceania
      • Rest of Asia Pacific


Table of Contents

  1. 1. Introduction
    • 1.1. Research Scope
    • 1.2. Market Segmentation
    • 1.3. Research Methodology
    • 1.4. Definitions and Assumptions
  2. 2. Executive Summary
    • 2.1. Introduction
  3. 3. Market Dynamics
    • 3.1. Introduction
      • 3.2. Market Drivers
        • 3.2.1. Low Availability of Skilled Labor; Technological Advancements
      • 3.3. Market Restrains
        • 3.3.1. Increasing Farm Expenditure; Security Concerns in Modern Farming Machinery
      • 3.4. Market Trends
        • 3.4.1. Increasing Average Farm Size
  4. 4. Market Factor Analysis
    • 4.1. Porters Five Forces
    • 4.2. Supply/Value Chain
    • 4.3. PESTEL analysis
    • 4.4. Market Entropy
    • 4.5. Patent/Trademark Analysis
  5. 5. Global US Farm Equipment Industry Analysis, Insights and Forecast, 2019-2031
    • 5.1. Market Analysis, Insights and Forecast - by Production Analysis
      • 5.2. Market Analysis, Insights and Forecast - by Consumption Analysis
        • 5.3. Market Analysis, Insights and Forecast - by Import Market Analysis (Value & Volume)
          • 5.4. Market Analysis, Insights and Forecast - by Export Market Analysis (Value & Volume)
            • 5.5. Market Analysis, Insights and Forecast - by Price Trend Analysis
              • 5.6. Market Analysis, Insights and Forecast - by Region
                • 5.6.1. North America
                • 5.6.2. South America
                • 5.6.3. Europe
                • 5.6.4. Middle East & Africa
                • 5.6.5. Asia Pacific
            • 6. North America US Farm Equipment Industry Analysis, Insights and Forecast, 2019-2031
              • 6.1. Market Analysis, Insights and Forecast - by Production Analysis
                • 6.2. Market Analysis, Insights and Forecast - by Consumption Analysis
                  • 6.3. Market Analysis, Insights and Forecast - by Import Market Analysis (Value & Volume)
                    • 6.4. Market Analysis, Insights and Forecast - by Export Market Analysis (Value & Volume)
                      • 6.5. Market Analysis, Insights and Forecast - by Price Trend Analysis
                      • 7. South America US Farm Equipment Industry Analysis, Insights and Forecast, 2019-2031
                        • 7.1. Market Analysis, Insights and Forecast - by Production Analysis
                          • 7.2. Market Analysis, Insights and Forecast - by Consumption Analysis
                            • 7.3. Market Analysis, Insights and Forecast - by Import Market Analysis (Value & Volume)
                              • 7.4. Market Analysis, Insights and Forecast - by Export Market Analysis (Value & Volume)
                                • 7.5. Market Analysis, Insights and Forecast - by Price Trend Analysis
                                • 8. Europe US Farm Equipment Industry Analysis, Insights and Forecast, 2019-2031
                                  • 8.1. Market Analysis, Insights and Forecast - by Production Analysis
                                    • 8.2. Market Analysis, Insights and Forecast - by Consumption Analysis
                                      • 8.3. Market Analysis, Insights and Forecast - by Import Market Analysis (Value & Volume)
                                        • 8.4. Market Analysis, Insights and Forecast - by Export Market Analysis (Value & Volume)
                                          • 8.5. Market Analysis, Insights and Forecast - by Price Trend Analysis
                                          • 9. Middle East & Africa US Farm Equipment Industry Analysis, Insights and Forecast, 2019-2031
                                            • 9.1. Market Analysis, Insights and Forecast - by Production Analysis
                                              • 9.2. Market Analysis, Insights and Forecast - by Consumption Analysis
                                                • 9.3. Market Analysis, Insights and Forecast - by Import Market Analysis (Value & Volume)
                                                  • 9.4. Market Analysis, Insights and Forecast - by Export Market Analysis (Value & Volume)
                                                    • 9.5. Market Analysis, Insights and Forecast - by Price Trend Analysis
                                                    • 10. Asia Pacific US Farm Equipment Industry Analysis, Insights and Forecast, 2019-2031
                                                      • 10.1. Market Analysis, Insights and Forecast - by Production Analysis
                                                        • 10.2. Market Analysis, Insights and Forecast - by Consumption Analysis
                                                          • 10.3. Market Analysis, Insights and Forecast - by Import Market Analysis (Value & Volume)
                                                            • 10.4. Market Analysis, Insights and Forecast - by Export Market Analysis (Value & Volume)
                                                              • 10.5. Market Analysis, Insights and Forecast - by Price Trend Analysis
                                                              • 11. Northeast US Farm Equipment Industry Analysis, Insights and Forecast, 2019-2031
                                                                • 12. Southeast US Farm Equipment Industry Analysis, Insights and Forecast, 2019-2031
                                                                  • 13. Midwest US Farm Equipment Industry Analysis, Insights and Forecast, 2019-2031
                                                                    • 14. Southwest US Farm Equipment Industry Analysis, Insights and Forecast, 2019-2031
                                                                      • 15. West US Farm Equipment Industry Analysis, Insights and Forecast, 2019-2031
                                                                        • 16. Competitive Analysis
                                                                          • 16.1. Global Market Share Analysis 2024
                                                                            • 16.2. Company Profiles
                                                                              • 16.2.1 Kverneland Grou
                                                                                • 16.2.1.1. Overview
                                                                                • 16.2.1.2. Products
                                                                                • 16.2.1.3. SWOT Analysis
                                                                                • 16.2.1.4. Recent Developments
                                                                                • 16.2.1.5. Financials (Based on Availability)
                                                                              • 16.2.2 JOST Werke AG (Alo)
                                                                                • 16.2.2.1. Overview
                                                                                • 16.2.2.2. Products
                                                                                • 16.2.2.3. SWOT Analysis
                                                                                • 16.2.2.4. Recent Developments
                                                                                • 16.2.2.5. Financials (Based on Availability)
                                                                              • 16.2.3 Kuhn Group Inc
                                                                                • 16.2.3.1. Overview
                                                                                • 16.2.3.2. Products
                                                                                • 16.2.3.3. SWOT Analysis
                                                                                • 16.2.3.4. Recent Developments
                                                                                • 16.2.3.5. Financials (Based on Availability)
                                                                              • 16.2.4 Deere and Company
                                                                                • 16.2.4.1. Overview
                                                                                • 16.2.4.2. Products
                                                                                • 16.2.4.3. SWOT Analysis
                                                                                • 16.2.4.4. Recent Developments
                                                                                • 16.2.4.5. Financials (Based on Availability)
                                                                              • 16.2.5 KUBOTA Corporation
                                                                                • 16.2.5.1. Overview
                                                                                • 16.2.5.2. Products
                                                                                • 16.2.5.3. SWOT Analysis
                                                                                • 16.2.5.4. Recent Developments
                                                                                • 16.2.5.5. Financials (Based on Availability)
                                                                              • 16.2.6 CNH Industrial
                                                                                • 16.2.6.1. Overview
                                                                                • 16.2.6.2. Products
                                                                                • 16.2.6.3. SWOT Analysis
                                                                                • 16.2.6.4. Recent Developments
                                                                                • 16.2.6.5. Financials (Based on Availability)
                                                                              • 16.2.7 Farmtrac Tractor Europe
                                                                                • 16.2.7.1. Overview
                                                                                • 16.2.7.2. Products
                                                                                • 16.2.7.3. SWOT Analysis
                                                                                • 16.2.7.4. Recent Developments
                                                                                • 16.2.7.5. Financials (Based on Availability)
                                                                              • 16.2.8 AGCO Corporation
                                                                                • 16.2.8.1. Overview
                                                                                • 16.2.8.2. Products
                                                                                • 16.2.8.3. SWOT Analysis
                                                                                • 16.2.8.4. Recent Developments
                                                                                • 16.2.8.5. Financials (Based on Availability)
                                                                              • 16.2.9 Deutz-Fahr
                                                                                • 16.2.9.1. Overview
                                                                                • 16.2.9.2. Products
                                                                                • 16.2.9.3. SWOT Analysis
                                                                                • 16.2.9.4. Recent Developments
                                                                                • 16.2.9.5. Financials (Based on Availability)
                                                                              • 16.2.10 Mahindra Agriculture North America
                                                                                • 16.2.10.1. Overview
                                                                                • 16.2.10.2. Products
                                                                                • 16.2.10.3. SWOT Analysis
                                                                                • 16.2.10.4. Recent Developments
                                                                                • 16.2.10.5. Financials (Based on Availability)
                                                                              • 16.2.11 Claas KGaA mbH
                                                                                • 16.2.11.1. Overview
                                                                                • 16.2.11.2. Products
                                                                                • 16.2.11.3. SWOT Analysis
                                                                                • 16.2.11.4. Recent Developments
                                                                                • 16.2.11.5. Financials (Based on Availability)

                                                                        List of Figures

                                                                        1. Figure 1: Global US Farm Equipment Industry Revenue Breakdown (Million, %) by Region 2024 & 2032
                                                                        2. Figure 2: United states US Farm Equipment Industry Revenue (Million), by Country 2024 & 2032
                                                                        3. Figure 3: United states US Farm Equipment Industry Revenue Share (%), by Country 2024 & 2032
                                                                        4. Figure 4: North America US Farm Equipment Industry Revenue (Million), by Production Analysis 2024 & 2032
                                                                        5. Figure 5: North America US Farm Equipment Industry Revenue Share (%), by Production Analysis 2024 & 2032
                                                                        6. Figure 6: North America US Farm Equipment Industry Revenue (Million), by Consumption Analysis 2024 & 2032
                                                                        7. Figure 7: North America US Farm Equipment Industry Revenue Share (%), by Consumption Analysis 2024 & 2032
                                                                        8. Figure 8: North America US Farm Equipment Industry Revenue (Million), by Import Market Analysis (Value & Volume) 2024 & 2032
                                                                        9. Figure 9: North America US Farm Equipment Industry Revenue Share (%), by Import Market Analysis (Value & Volume) 2024 & 2032
                                                                        10. Figure 10: North America US Farm Equipment Industry Revenue (Million), by Export Market Analysis (Value & Volume) 2024 & 2032
                                                                        11. Figure 11: North America US Farm Equipment Industry Revenue Share (%), by Export Market Analysis (Value & Volume) 2024 & 2032
                                                                        12. Figure 12: North America US Farm Equipment Industry Revenue (Million), by Price Trend Analysis 2024 & 2032
                                                                        13. Figure 13: North America US Farm Equipment Industry Revenue Share (%), by Price Trend Analysis 2024 & 2032
                                                                        14. Figure 14: North America US Farm Equipment Industry Revenue (Million), by Country 2024 & 2032
                                                                        15. Figure 15: North America US Farm Equipment Industry Revenue Share (%), by Country 2024 & 2032
                                                                        16. Figure 16: South America US Farm Equipment Industry Revenue (Million), by Production Analysis 2024 & 2032
                                                                        17. Figure 17: South America US Farm Equipment Industry Revenue Share (%), by Production Analysis 2024 & 2032
                                                                        18. Figure 18: South America US Farm Equipment Industry Revenue (Million), by Consumption Analysis 2024 & 2032
                                                                        19. Figure 19: South America US Farm Equipment Industry Revenue Share (%), by Consumption Analysis 2024 & 2032
                                                                        20. Figure 20: South America US Farm Equipment Industry Revenue (Million), by Import Market Analysis (Value & Volume) 2024 & 2032
                                                                        21. Figure 21: South America US Farm Equipment Industry Revenue Share (%), by Import Market Analysis (Value & Volume) 2024 & 2032
                                                                        22. Figure 22: South America US Farm Equipment Industry Revenue (Million), by Export Market Analysis (Value & Volume) 2024 & 2032
                                                                        23. Figure 23: South America US Farm Equipment Industry Revenue Share (%), by Export Market Analysis (Value & Volume) 2024 & 2032
                                                                        24. Figure 24: South America US Farm Equipment Industry Revenue (Million), by Price Trend Analysis 2024 & 2032
                                                                        25. Figure 25: South America US Farm Equipment Industry Revenue Share (%), by Price Trend Analysis 2024 & 2032
                                                                        26. Figure 26: South America US Farm Equipment Industry Revenue (Million), by Country 2024 & 2032
                                                                        27. Figure 27: South America US Farm Equipment Industry Revenue Share (%), by Country 2024 & 2032
                                                                        28. Figure 28: Europe US Farm Equipment Industry Revenue (Million), by Production Analysis 2024 & 2032
                                                                        29. Figure 29: Europe US Farm Equipment Industry Revenue Share (%), by Production Analysis 2024 & 2032
                                                                        30. Figure 30: Europe US Farm Equipment Industry Revenue (Million), by Consumption Analysis 2024 & 2032
                                                                        31. Figure 31: Europe US Farm Equipment Industry Revenue Share (%), by Consumption Analysis 2024 & 2032
                                                                        32. Figure 32: Europe US Farm Equipment Industry Revenue (Million), by Import Market Analysis (Value & Volume) 2024 & 2032
                                                                        33. Figure 33: Europe US Farm Equipment Industry Revenue Share (%), by Import Market Analysis (Value & Volume) 2024 & 2032
                                                                        34. Figure 34: Europe US Farm Equipment Industry Revenue (Million), by Export Market Analysis (Value & Volume) 2024 & 2032
                                                                        35. Figure 35: Europe US Farm Equipment Industry Revenue Share (%), by Export Market Analysis (Value & Volume) 2024 & 2032
                                                                        36. Figure 36: Europe US Farm Equipment Industry Revenue (Million), by Price Trend Analysis 2024 & 2032
                                                                        37. Figure 37: Europe US Farm Equipment Industry Revenue Share (%), by Price Trend Analysis 2024 & 2032
                                                                        38. Figure 38: Europe US Farm Equipment Industry Revenue (Million), by Country 2024 & 2032
                                                                        39. Figure 39: Europe US Farm Equipment Industry Revenue Share (%), by Country 2024 & 2032
                                                                        40. Figure 40: Middle East & Africa US Farm Equipment Industry Revenue (Million), by Production Analysis 2024 & 2032
                                                                        41. Figure 41: Middle East & Africa US Farm Equipment Industry Revenue Share (%), by Production Analysis 2024 & 2032
                                                                        42. Figure 42: Middle East & Africa US Farm Equipment Industry Revenue (Million), by Consumption Analysis 2024 & 2032
                                                                        43. Figure 43: Middle East & Africa US Farm Equipment Industry Revenue Share (%), by Consumption Analysis 2024 & 2032
                                                                        44. Figure 44: Middle East & Africa US Farm Equipment Industry Revenue (Million), by Import Market Analysis (Value & Volume) 2024 & 2032
                                                                        45. Figure 45: Middle East & Africa US Farm Equipment Industry Revenue Share (%), by Import Market Analysis (Value & Volume) 2024 & 2032
                                                                        46. Figure 46: Middle East & Africa US Farm Equipment Industry Revenue (Million), by Export Market Analysis (Value & Volume) 2024 & 2032
                                                                        47. Figure 47: Middle East & Africa US Farm Equipment Industry Revenue Share (%), by Export Market Analysis (Value & Volume) 2024 & 2032
                                                                        48. Figure 48: Middle East & Africa US Farm Equipment Industry Revenue (Million), by Price Trend Analysis 2024 & 2032
                                                                        49. Figure 49: Middle East & Africa US Farm Equipment Industry Revenue Share (%), by Price Trend Analysis 2024 & 2032
                                                                        50. Figure 50: Middle East & Africa US Farm Equipment Industry Revenue (Million), by Country 2024 & 2032
                                                                        51. Figure 51: Middle East & Africa US Farm Equipment Industry Revenue Share (%), by Country 2024 & 2032
                                                                        52. Figure 52: Asia Pacific US Farm Equipment Industry Revenue (Million), by Production Analysis 2024 & 2032
                                                                        53. Figure 53: Asia Pacific US Farm Equipment Industry Revenue Share (%), by Production Analysis 2024 & 2032
                                                                        54. Figure 54: Asia Pacific US Farm Equipment Industry Revenue (Million), by Consumption Analysis 2024 & 2032
                                                                        55. Figure 55: Asia Pacific US Farm Equipment Industry Revenue Share (%), by Consumption Analysis 2024 & 2032
                                                                        56. Figure 56: Asia Pacific US Farm Equipment Industry Revenue (Million), by Import Market Analysis (Value & Volume) 2024 & 2032
                                                                        57. Figure 57: Asia Pacific US Farm Equipment Industry Revenue Share (%), by Import Market Analysis (Value & Volume) 2024 & 2032
                                                                        58. Figure 58: Asia Pacific US Farm Equipment Industry Revenue (Million), by Export Market Analysis (Value & Volume) 2024 & 2032
                                                                        59. Figure 59: Asia Pacific US Farm Equipment Industry Revenue Share (%), by Export Market Analysis (Value & Volume) 2024 & 2032
                                                                        60. Figure 60: Asia Pacific US Farm Equipment Industry Revenue (Million), by Price Trend Analysis 2024 & 2032
                                                                        61. Figure 61: Asia Pacific US Farm Equipment Industry Revenue Share (%), by Price Trend Analysis 2024 & 2032
                                                                        62. Figure 62: Asia Pacific US Farm Equipment Industry Revenue (Million), by Country 2024 & 2032
                                                                        63. Figure 63: Asia Pacific US Farm Equipment Industry Revenue Share (%), by Country 2024 & 2032

                                                                        List of Tables

                                                                        1. Table 1: Global US Farm Equipment Industry Revenue Million Forecast, by Region 2019 & 2032
                                                                        2. Table 2: Global US Farm Equipment Industry Revenue Million Forecast, by Production Analysis 2019 & 2032
                                                                        3. Table 3: Global US Farm Equipment Industry Revenue Million Forecast, by Consumption Analysis 2019 & 2032
                                                                        4. Table 4: Global US Farm Equipment Industry Revenue Million Forecast, by Import Market Analysis (Value & Volume) 2019 & 2032
                                                                        5. Table 5: Global US Farm Equipment Industry Revenue Million Forecast, by Export Market Analysis (Value & Volume) 2019 & 2032
                                                                        6. Table 6: Global US Farm Equipment Industry Revenue Million Forecast, by Price Trend Analysis 2019 & 2032
                                                                        7. Table 7: Global US Farm Equipment Industry Revenue Million Forecast, by Region 2019 & 2032
                                                                        8. Table 8: Global US Farm Equipment Industry Revenue Million Forecast, by Country 2019 & 2032
                                                                        9. Table 9: Northeast US Farm Equipment Industry Revenue (Million) Forecast, by Application 2019 & 2032
                                                                        10. Table 10: Southeast US Farm Equipment Industry Revenue (Million) Forecast, by Application 2019 & 2032
                                                                        11. Table 11: Midwest US Farm Equipment Industry Revenue (Million) Forecast, by Application 2019 & 2032
                                                                        12. Table 12: Southwest US Farm Equipment Industry Revenue (Million) Forecast, by Application 2019 & 2032
                                                                        13. Table 13: West US Farm Equipment Industry Revenue (Million) Forecast, by Application 2019 & 2032
                                                                        14. Table 14: Global US Farm Equipment Industry Revenue Million Forecast, by Production Analysis 2019 & 2032
                                                                        15. Table 15: Global US Farm Equipment Industry Revenue Million Forecast, by Consumption Analysis 2019 & 2032
                                                                        16. Table 16: Global US Farm Equipment Industry Revenue Million Forecast, by Import Market Analysis (Value & Volume) 2019 & 2032
                                                                        17. Table 17: Global US Farm Equipment Industry Revenue Million Forecast, by Export Market Analysis (Value & Volume) 2019 & 2032
                                                                        18. Table 18: Global US Farm Equipment Industry Revenue Million Forecast, by Price Trend Analysis 2019 & 2032
                                                                        19. Table 19: Global US Farm Equipment Industry Revenue Million Forecast, by Country 2019 & 2032
                                                                        20. Table 20: United States US Farm Equipment Industry Revenue (Million) Forecast, by Application 2019 & 2032
                                                                        21. Table 21: Canada US Farm Equipment Industry Revenue (Million) Forecast, by Application 2019 & 2032
                                                                        22. Table 22: Mexico US Farm Equipment Industry Revenue (Million) Forecast, by Application 2019 & 2032
                                                                        23. Table 23: Global US Farm Equipment Industry Revenue Million Forecast, by Production Analysis 2019 & 2032
                                                                        24. Table 24: Global US Farm Equipment Industry Revenue Million Forecast, by Consumption Analysis 2019 & 2032
                                                                        25. Table 25: Global US Farm Equipment Industry Revenue Million Forecast, by Import Market Analysis (Value & Volume) 2019 & 2032
                                                                        26. Table 26: Global US Farm Equipment Industry Revenue Million Forecast, by Export Market Analysis (Value & Volume) 2019 & 2032
                                                                        27. Table 27: Global US Farm Equipment Industry Revenue Million Forecast, by Price Trend Analysis 2019 & 2032
                                                                        28. Table 28: Global US Farm Equipment Industry Revenue Million Forecast, by Country 2019 & 2032
                                                                        29. Table 29: Brazil US Farm Equipment Industry Revenue (Million) Forecast, by Application 2019 & 2032
                                                                        30. Table 30: Argentina US Farm Equipment Industry Revenue (Million) Forecast, by Application 2019 & 2032
                                                                        31. Table 31: Rest of South America US Farm Equipment Industry Revenue (Million) Forecast, by Application 2019 & 2032
                                                                        32. Table 32: Global US Farm Equipment Industry Revenue Million Forecast, by Production Analysis 2019 & 2032
                                                                        33. Table 33: Global US Farm Equipment Industry Revenue Million Forecast, by Consumption Analysis 2019 & 2032
                                                                        34. Table 34: Global US Farm Equipment Industry Revenue Million Forecast, by Import Market Analysis (Value & Volume) 2019 & 2032
                                                                        35. Table 35: Global US Farm Equipment Industry Revenue Million Forecast, by Export Market Analysis (Value & Volume) 2019 & 2032
                                                                        36. Table 36: Global US Farm Equipment Industry Revenue Million Forecast, by Price Trend Analysis 2019 & 2032
                                                                        37. Table 37: Global US Farm Equipment Industry Revenue Million Forecast, by Country 2019 & 2032
                                                                        38. Table 38: United Kingdom US Farm Equipment Industry Revenue (Million) Forecast, by Application 2019 & 2032
                                                                        39. Table 39: Germany US Farm Equipment Industry Revenue (Million) Forecast, by Application 2019 & 2032
                                                                        40. Table 40: France US Farm Equipment Industry Revenue (Million) Forecast, by Application 2019 & 2032
                                                                        41. Table 41: Italy US Farm Equipment Industry Revenue (Million) Forecast, by Application 2019 & 2032
                                                                        42. Table 42: Spain US Farm Equipment Industry Revenue (Million) Forecast, by Application 2019 & 2032
                                                                        43. Table 43: Russia US Farm Equipment Industry Revenue (Million) Forecast, by Application 2019 & 2032
                                                                        44. Table 44: Benelux US Farm Equipment Industry Revenue (Million) Forecast, by Application 2019 & 2032
                                                                        45. Table 45: Nordics US Farm Equipment Industry Revenue (Million) Forecast, by Application 2019 & 2032
                                                                        46. Table 46: Rest of Europe US Farm Equipment Industry Revenue (Million) Forecast, by Application 2019 & 2032
                                                                        47. Table 47: Global US Farm Equipment Industry Revenue Million Forecast, by Production Analysis 2019 & 2032
                                                                        48. Table 48: Global US Farm Equipment Industry Revenue Million Forecast, by Consumption Analysis 2019 & 2032
                                                                        49. Table 49: Global US Farm Equipment Industry Revenue Million Forecast, by Import Market Analysis (Value & Volume) 2019 & 2032
                                                                        50. Table 50: Global US Farm Equipment Industry Revenue Million Forecast, by Export Market Analysis (Value & Volume) 2019 & 2032
                                                                        51. Table 51: Global US Farm Equipment Industry Revenue Million Forecast, by Price Trend Analysis 2019 & 2032
                                                                        52. Table 52: Global US Farm Equipment Industry Revenue Million Forecast, by Country 2019 & 2032
                                                                        53. Table 53: Turkey US Farm Equipment Industry Revenue (Million) Forecast, by Application 2019 & 2032
                                                                        54. Table 54: Israel US Farm Equipment Industry Revenue (Million) Forecast, by Application 2019 & 2032
                                                                        55. Table 55: GCC US Farm Equipment Industry Revenue (Million) Forecast, by Application 2019 & 2032
                                                                        56. Table 56: North Africa US Farm Equipment Industry Revenue (Million) Forecast, by Application 2019 & 2032
                                                                        57. Table 57: South Africa US Farm Equipment Industry Revenue (Million) Forecast, by Application 2019 & 2032
                                                                        58. Table 58: Rest of Middle East & Africa US Farm Equipment Industry Revenue (Million) Forecast, by Application 2019 & 2032
                                                                        59. Table 59: Global US Farm Equipment Industry Revenue Million Forecast, by Production Analysis 2019 & 2032
                                                                        60. Table 60: Global US Farm Equipment Industry Revenue Million Forecast, by Consumption Analysis 2019 & 2032
                                                                        61. Table 61: Global US Farm Equipment Industry Revenue Million Forecast, by Import Market Analysis (Value & Volume) 2019 & 2032
                                                                        62. Table 62: Global US Farm Equipment Industry Revenue Million Forecast, by Export Market Analysis (Value & Volume) 2019 & 2032
                                                                        63. Table 63: Global US Farm Equipment Industry Revenue Million Forecast, by Price Trend Analysis 2019 & 2032
                                                                        64. Table 64: Global US Farm Equipment Industry Revenue Million Forecast, by Country 2019 & 2032
                                                                        65. Table 65: China US Farm Equipment Industry Revenue (Million) Forecast, by Application 2019 & 2032
                                                                        66. Table 66: India US Farm Equipment Industry Revenue (Million) Forecast, by Application 2019 & 2032
                                                                        67. Table 67: Japan US Farm Equipment Industry Revenue (Million) Forecast, by Application 2019 & 2032
                                                                        68. Table 68: South Korea US Farm Equipment Industry Revenue (Million) Forecast, by Application 2019 & 2032
                                                                        69. Table 69: ASEAN US Farm Equipment Industry Revenue (Million) Forecast, by Application 2019 & 2032
                                                                        70. Table 70: Oceania US Farm Equipment Industry Revenue (Million) Forecast, by Application 2019 & 2032
                                                                        71. Table 71: Rest of Asia Pacific US Farm Equipment Industry Revenue (Million) Forecast, by Application 2019 & 2032


                                                                        Frequently Asked Questions

                                                                        1. What is the projected Compound Annual Growth Rate (CAGR) of the US Farm Equipment Industry?

                                                                        The projected CAGR is approximately 6.30%.

                                                                        2. Which companies are prominent players in the US Farm Equipment Industry?

                                                                        Key companies in the market include Kverneland Grou, JOST Werke AG (Alo), Kuhn Group Inc, Deere and Company, KUBOTA Corporation, CNH Industrial, Farmtrac Tractor Europe, AGCO Corporation, Deutz-Fahr, Mahindra Agriculture North America, Claas KGaA mbH.

                                                                        3. What are the main segments of the US Farm Equipment Industry?

                                                                        The market segments include Production Analysis, Consumption Analysis, Import Market Analysis (Value & Volume), Export Market Analysis (Value & Volume), Price Trend Analysis.

                                                                        4. Can you provide details about the market size?

                                                                        The market size is estimated to be USD 39.56 Million as of 2022.

                                                                        5. What are some drivers contributing to market growth?

                                                                        Low Availability of Skilled Labor; Technological Advancements.

                                                                        6. What are the notable trends driving market growth?

                                                                        Increasing Average Farm Size.

                                                                        7. Are there any restraints impacting market growth?

                                                                        Increasing Farm Expenditure; Security Concerns in Modern Farming Machinery.

                                                                        8. Can you provide examples of recent developments in the market?

                                                                        December 2022: CNH Industrial added new Automation and Autonomy Solutions to the Ag Tech portfolio in Phoenix, Arizona, and the USA. These New Driverless Tillage and Driver Assist Harvest solutions from Raven, and Baler Automation from Case IH and New Holland, can deliver automation and autonomous equipment enhancements and help solve farmers' most significant challenges to increasing productivity.

                                                                        9. What pricing options are available for accessing the report?

                                                                        Pricing options include single-user, multi-user, and enterprise licenses priced at USD 3800, USD 4500, and USD 5800 respectively.

                                                                        10. Is the market size provided in terms of value or volume?

                                                                        The market size is provided in terms of value, measured in Million.

                                                                        11. Are there any specific market keywords associated with the report?

                                                                        Yes, the market keyword associated with the report is "US Farm Equipment Industry," which aids in identifying and referencing the specific market segment covered.

                                                                        12. How do I determine which pricing option suits my needs best?

                                                                        The pricing options vary based on user requirements and access needs. Individual users may opt for single-user licenses, while businesses requiring broader access may choose multi-user or enterprise licenses for cost-effective access to the report.

                                                                        13. Are there any additional resources or data provided in the US Farm Equipment Industry report?

                                                                        While the report offers comprehensive insights, it's advisable to review the specific contents or supplementary materials provided to ascertain if additional resources or data are available.

                                                                        14. How can I stay updated on further developments or reports in the US Farm Equipment Industry?

                                                                        To stay informed about further developments, trends, and reports in the US Farm Equipment Industry, consider subscribing to industry newsletters, following relevant companies and organizations, or regularly checking reputable industry news sources and publications.


                                                                        Methodology

                                                                        Step 1 - Identification of Relevant Samples Size from Population Database

                                                                        Step Chart
                                                                        Bar Chart
                                                                        Method Chart

                                                                        Step 2 - Approaches for Defining Global Market Size (Value, Volume* & Price*)

                                                                        Approach Chart
                                                                        Top-down and bottom-up approaches are used to validate the global market size and estimate the market size for manufactures, regional segments, product, and application.

                                                                        Note*: In applicable scenarios

                                                                        Step 3 - Data Sources

                                                                        Primary Research

                                                                        • Web Analytics
                                                                        • Survey Reports
                                                                        • Research Institute
                                                                        • Latest Research Reports
                                                                        • Opinion Leaders

                                                                        Secondary Research

                                                                        • Annual Reports
                                                                        • White Paper
                                                                        • Latest Press Release
                                                                        • Industry Association
                                                                        • Paid Database
                                                                        • Investor Presentations
                                                                        Analyst Chart

                                                                        Step 4 - Data Triangulation

                                                                        Involves using different sources of information in order to increase the validity of a study

                                                                        These sources are likely to be stakeholders in a program - participants, other researchers, program staff, other community members, and so on.

                                                                        Then we put all data in single framework & apply various statistical tools to find out the dynamic on the market.

                                                                        During the analysis stage, feedback from the stakeholder groups would be compared to determine areas of agreement as well as areas of divergence

                                                                        Additionally, after gathering mixed and scattered data from a wide range of sources, data is triangulated and correlated to come up with estimated figures which are further validated through primary mediums or industry experts, opinion leaders.

                                                                        About Report Pinnacle

                                                                        Report Pinnacle provides top-tier market research, industry intelligence, and actionable insights for finance, technology, healthcare, and consumer sectors. Our reports empower you to make informed decisions and achieve business success.

                                                                        Our expert team combines primary research, data analytics, and industry knowledge to deliver insights you can trust. We offer syndicated reports, custom research, and consulting services tailored to your unique business needs.

                                                                        At Report Pinnacle, we are committed to quality, transparency, and client satisfaction. Every report is rigorously validated to ensure accuracy and relevance. Our global perspective and local expertise help you understand both broad trends and detailed market shifts.

                                                                        Stay ahead with Report Pinnacle. Subscribe to our newsletter for the latest insights and research highlights, and follow us on social media for real-time updates.

                                                                        Report Pinnacle – Your Partner for Reaching the Top in Market Intelligence.

                                                                        artwork spiralartwork spiralRelated Reports
                                                                        artwork underline

                                                                        Regional Growth Projections for US Turf and Ornamental Protection Market Industry

                                                                        Discover the booming US Turf & Ornamental Protection Market! Explore market size, CAGR, key players (Syngenta, BASF, FMC), and regional trends (Northeast, Southeast, etc.) in this detailed analysis projecting growth to $3.5B by 2033. Learn about driving factors, restraints, and the rise of eco-friendly solutions.

                                                                        July 2025
                                                                        Base Year: 2024
                                                                        No Of Pages: 197
                                                                        Price: $3800

                                                                        Growth Roadmap for Pesticide Industry in India Market 2025-2033

                                                                        Discover the booming Indian pesticide market, projected to reach ₹226.5 billion by 2033 with a CAGR of 5.31%. This in-depth analysis explores market drivers, trends, restraints, key players (Sumitomo, Bayer, Syngenta, etc.), and regional breakdowns. Learn about the surging demand across various crop types and application methods.

                                                                        July 2025
                                                                        Base Year: 2024
                                                                        No Of Pages: 150
                                                                        Price: $3800

                                                                        Plant Growth Chamber Market Market Valuation to Hit XXX Million by 2033

                                                                        Discover the booming plant growth chamber market! This in-depth analysis reveals a $486.6M market in 2025, projected to grow at a 4.7% CAGR through 2033. Learn about key drivers, restraints, and regional trends shaping this vital sector for agriculture, research, and controlled environment agriculture (CEA). Explore market segmentation by equipment type, application, and function.

                                                                        July 2025
                                                                        Base Year: 2024
                                                                        No Of Pages: 150
                                                                        Price: $4750

                                                                        North America Agricultural Equipment Market Comprehensive Market Study: Trends and Predictions 2025-2033

                                                                        Discover the booming North American agricultural equipment market! This in-depth analysis reveals a projected $XX million market in 2025, growing at a 7.90% CAGR through 2033. Learn about key drivers, trends, restraints, and leading companies shaping this dynamic sector. Explore market segmentation and regional data for a comprehensive overview.

                                                                        July 2025
                                                                        Base Year: 2024
                                                                        No Of Pages: 234
                                                                        Price: $4750

                                                                        Consumer-Driven Trends in Agricultural Inoculants Market Market

                                                                        Discover the booming Agricultural Inoculants Market! This comprehensive analysis reveals a CAGR of 10.50%, driven by sustainable farming trends and technological advancements. Explore market segments, key players (Bioceres, Novozymes, BASF), and regional growth projections (North America, Europe, Asia-Pacific) for 2025-2033.

                                                                        July 2025
                                                                        Base Year: 2024
                                                                        No Of Pages: 150
                                                                        Price: $4750

                                                                        Growth Catalysts in Global SDHI Fungicide Market Market

                                                                        The global SDHI fungicide market is booming, projected to reach \$XX million by 2033 with a CAGR of 7.70%. This comprehensive analysis explores market drivers, trends, restraints, and key players like FMC, Bayer, and Syngenta, covering regional breakdowns and crop applications. Discover insights into this vital sector for crop protection and food security.

                                                                        July 2025
                                                                        Base Year: 2024
                                                                        No Of Pages: 234
                                                                        Price: $4750

                                                                        Exploring Innovation in Digital Agriculture Market Industry

                                                                        The Digital Agriculture Market is booming, projected to reach [estimated 2033 market size] by 2033, driven by precision farming, AI, and drone technology. This in-depth analysis explores market size, growth, key players (AGCO, Deere, Microsoft), regional trends (North America, Asia-Pacific), and emerging technologies shaping the future of farming.

                                                                        July 2025
                                                                        Base Year: 2024
                                                                        No Of Pages: 150
                                                                        Price: $4750

                                                                        Kuwait Vegetables and Fruits Market Market’s Drivers and Challenges: Strategic Overview 2025-2033

                                                                        Discover the booming Kuwait vegetables and fruits market! This comprehensive analysis reveals a $134.7M market expanding at a 10.11% CAGR (2025-2033). Learn about key drivers, trends, and leading companies like Al-Khayyat and KNFC. Explore market size projections and insightful segmentation data for fruits and vegetables in Kuwait.

                                                                        July 2025
                                                                        Base Year: 2024
                                                                        No Of Pages: 180
                                                                        Price: $3800

                                                                        Asia-Pacific Agricultural Tractors Market Growth Pathways: Strategic Analysis and Forecasts 2025-2033

                                                                        Discover the booming Asia-Pacific Agricultural Tractors market! This comprehensive analysis reveals key trends, growth drivers (rising agricultural demands, government initiatives), and forecasts for 2025-2033. Learn about market size, CAGR, and regional breakdowns for India, China, and other key nations. Get insights into future opportunities and challenges.

                                                                        July 2025
                                                                        Base Year: 2024
                                                                        No Of Pages: 197
                                                                        Price: $3800

                                                                        Europe Vegetable Seed Market Future-Proofing Growth: Strategic Insights and Analysis 2025-2033

                                                                        Discover the booming European vegetable seed market! This comprehensive analysis reveals a CAGR of 8.60% through 2033, driven by hybrid seed adoption, protected cultivation, and rising consumer demand. Learn about key players, market segmentation, and regional trends.

                                                                        July 2025
                                                                        Base Year: 2024
                                                                        No Of Pages: 150
                                                                        Price: $3800

                                                                        Growth Roadmap for South America Micronutrient Fertilizer Industry Market 2025-2033

                                                                        Discover the booming South American micronutrient fertilizer market! This analysis reveals a 9.02% CAGR, driven by intensive farming, growing awareness, and government support. Explore market trends, key players (Nortox, Mosaic, Yara), and future projections for Brazil, Argentina & beyond. Invest wisely in this dynamic sector.

                                                                        July 2025
                                                                        Base Year: 2024
                                                                        No Of Pages: 150
                                                                        Price: $3800

                                                                        Regional Growth Projections for Seed Industry in Pakistan Industry

                                                                        Discover the booming Pakistani seed industry! This in-depth market analysis reveals a $880 million market (2025) projected to reach $1.36 billion by 2033, driven by high-yielding crops, transgenic seeds, and government initiatives. Learn about key players, market segments, and future growth opportunities.

                                                                        July 2025
                                                                        Base Year: 2024
                                                                        No Of Pages: 150
                                                                        Price: $3800

                                                                        China Seed Treatments Market: Disruptive Technologies Driving Market Growth 2025-2033

                                                                        Discover the booming China seed treatments market. This comprehensive analysis reveals key drivers, trends, and challenges, including insights into chemical vs. non-chemical treatments, application techniques, and leading companies like Syngenta and BASF. Explore market size projections and growth opportunities until 2033.

                                                                        July 2025
                                                                        Base Year: 2024
                                                                        No Of Pages: 150
                                                                        Price: $3800

                                                                        Thailand Fertilizers Market Future-Proofing Growth: Strategic Insights and Analysis 2025-2033

                                                                        Discover the thriving Thailand Fertilizers Market! This in-depth analysis reveals a 6.4% CAGR, driven by growing agricultural needs & sustainable farming initiatives. Explore market size, segmentation, key players (ICL, Yara, Chai Thai), and future growth projections until 2033.

                                                                        July 2025
                                                                        Base Year: 2024
                                                                        No Of Pages: 150
                                                                        Price: $3800

                                                                        Understanding Growth Challenges in Chinese Farm Tractors Market Market 2025-2033

                                                                        Discover the booming Chinese farm tractor market! This comprehensive analysis reveals key trends, growth drivers, and challenges impacting this dynamic sector from 2019-2033, including market size, CAGR, key players, and regional breakdowns. Learn about the opportunities and challenges in this rapidly evolving market.

                                                                        July 2025
                                                                        Base Year: 2024
                                                                        No Of Pages: 150
                                                                        Price: $3800

                                                                        Growth Catalysts in Europe Pea Industry Market

                                                                        Discover the booming European pea industry! This comprehensive market analysis reveals a €14.5B market projected to reach €26.5B by 2033, driven by plant-based food trends & sustainable agriculture. Explore key players, regional insights, and future growth projections.

                                                                        July 2025
                                                                        Base Year: 2024
                                                                        No Of Pages: 180
                                                                        Price: $4750

                                                                        Agriculture Films Industry Market Expansion: Growth Outlook 2025-2033

                                                                        Discover the booming agriculture films market! This comprehensive analysis reveals a CAGR of 6.40%, driven by precision farming & sustainable practices. Explore market size, segmentation (LDPE, HDPE, EVA, etc.), key players (Novamont, BASF, etc.), and regional trends (North America, Europe, Asia Pacific). Project your strategy with our insightful forecast to 2033.

                                                                        July 2025
                                                                        Base Year: 2024
                                                                        No Of Pages: 234
                                                                        Price: $4750

                                                                        South America Agricultual Films Market Insightful Analysis: Trends, Competitor Dynamics, and Opportunities 2025-2033

                                                                        Discover the booming South American agricultural films market! This in-depth analysis reveals a CAGR of 6.10% through 2033, driven by growing demand for efficient farming solutions and sustainable materials. Explore market size, key players (Dow, Agroflex, etc.), and regional trends in Brazil, Argentina, and beyond.

                                                                        July 2025
                                                                        Base Year: 2024
                                                                        No Of Pages: 150
                                                                        Price: $4750

                                                                        Europe Chemical Seed Treatment Market Market Disruption Trends and Insights

                                                                        Discover the latest insights on the booming European chemical seed treatment market. This comprehensive analysis reveals a €2.5 billion market in 2025 projected to grow at a CAGR of 5.20% until 2033, driven by food security demands and pest control needs. Explore key trends, challenges, and leading companies shaping this dynamic sector.

                                                                        July 2025
                                                                        Base Year: 2024
                                                                        No Of Pages: 197
                                                                        Price: $3800

                                                                        US Fungicide Market Market Predictions: Growth and Size Trends to 2033

                                                                        Discover the booming US Fungicide Market! This comprehensive analysis reveals market size, CAGR (4.34%), key drivers, trends, and restraints through 2033. Explore regional data, leading companies (FMC, Sumitomo, Bayer, etc.), and application modes. Maximize your understanding of this dynamic sector.

                                                                        July 2025
                                                                        Base Year: 2024
                                                                        No Of Pages: 180
                                                                        Price: $3800
                                                                        • Home
                                                                        • About Us
                                                                        • Industries
                                                                          • Aerospace & Defense
                                                                          • Agriculture
                                                                          • Animal Nutrition & Wellness
                                                                          • Automotive
                                                                          • Chemicals & Materials
                                                                          • Consumer Goods and Services
                                                                          • Energy & Power
                                                                          • Financial Services and Investment Intelligence
                                                                          • Food & Beverage
                                                                          • Home and Property Improvement
                                                                          • Hospitality and Tourism
                                                                          • Logistics
                                                                          • Manufacturing Products and Services
                                                                          • Packaging
                                                                          • Professional and Commercial Services
                                                                          • Real Estate and Construction
                                                                          • Retail
                                                                          • Technology, Media and Telecom
                                                                          • Healthcare
                                                                        • Services
                                                                        • Contact
                                                                        Main Logo
                                                                        • Home
                                                                        • About Us
                                                                        • Industries
                                                                          • Aerospace & Defense
                                                                          • Agriculture
                                                                          • Animal Nutrition & Wellness
                                                                          • Automotive
                                                                          • Chemicals & Materials
                                                                          • Consumer Goods and Services
                                                                          • Energy & Power
                                                                          • Financial Services and Investment Intelligence
                                                                          • Food & Beverage
                                                                          • Home and Property Improvement
                                                                          • Hospitality and Tourism
                                                                          • Logistics
                                                                          • Manufacturing Products and Services
                                                                          • Packaging
                                                                          • Professional and Commercial Services
                                                                          • Real Estate and Construction
                                                                          • Retail
                                                                          • Technology, Media and Telecom
                                                                          • Healthcare
                                                                        • Services
                                                                        • Contact
                                                                        +17162654855
                                                                        [email protected]

                                                                        +17162654855

                                                                        [email protected]

                                                                        Business Address

                                                                        Head Office

                                                                        Office no. A 5010, fifth floor, Solitaire Business Hub, Near Phoenix mall, Pune, Maharashtra 411014

                                                                        Contact Information

                                                                        Craig Francis

                                                                        Business Development Head

                                                                        +17162654855

                                                                        [email protected]

                                                                        Connect With Us

                                                                        Secure Payment Partners

                                                                        payment image
                                                                        RetailLogisticsPackagingAutomotiveHealthcareAgricultureEnergy & PowerFood & BeverageAerospace & DefenseChemicals & MaterialsHospitality and TourismAnimal Nutrition & WellnessConsumer Goods and ServicesReal Estate and ConstructionHome and Property ImprovementTechnology, Media and TelecomManufacturing Products and ServicesFinancial Services and Investment Intelligence

                                                                        © 2025 All rights reserved


                                                                        Privacy Policy
                                                                        Terms and Conditions
                                                                        FAQ