

Key Insights
The US luxury goods market, including apparel, footwear, accessories, and cosmetics, offers a substantial investment opportunity. With a projected market size of $274.8 billion in the base year 2025, the sector is poised for significant expansion, forecasting a Compound Annual Growth Rate (CAGR) of 5.8% from 2025 to 2033. Key growth drivers include the expanding base of high-net-worth individuals, a growing preference for experiential luxury, and the strong allure of aspirational brands. The increasing adoption of e-commerce, particularly among younger demographics, is also reshaping distribution strategies and market dynamics. Potential challenges include economic downturns and geopolitical instability, which could impact discretionary spending. Market segmentation indicates strong performance in apparel and accessories, followed by premium cosmetics and timepieces. While online sales are expected to dominate, brick-and-mortar retail, especially single-brand boutiques offering enhanced customer experiences, will remain vital for brand building and revenue generation.
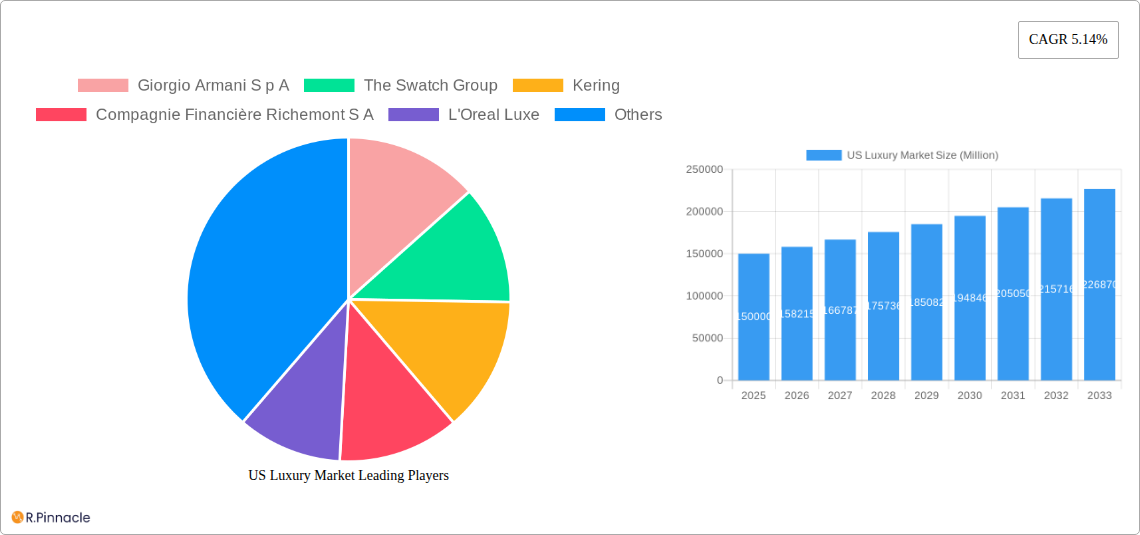
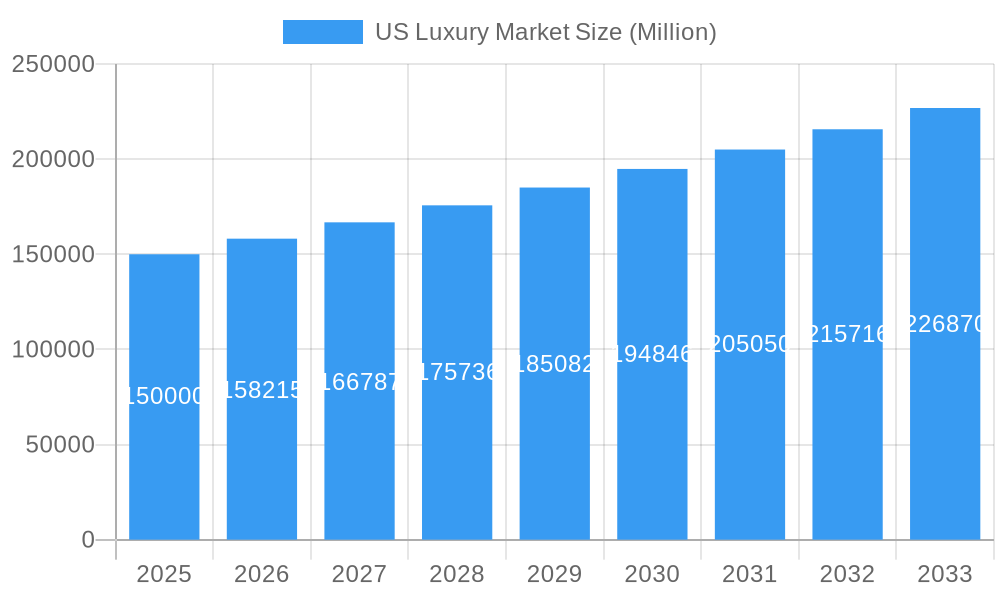
US Luxury Market Market Size (In Billion)
The competitive arena features established conglomerates such as LVMH, Kering, Richemont, and Estee Lauder, alongside prominent independent brands like Rolex and Armani. These entities actively engage in brand development and product innovation, utilizing exclusive collaborations and celebrity endorsements to maintain their competitive advantage. Regional analysis within the US market reveals growth potential across diverse areas. While the Northeast and West Coast traditionally lead in market share, the Midwest and South are experiencing escalating demand due to rising disposable incomes and shifting consumer preferences. The forecast anticipates sustained growth, though subject to potential macroeconomic fluctuations. Strategic investments in digital marketing, personalized customer experiences, and sustainable practices are paramount for success in this dynamic market. Comprehending regional nuances and adapting to evolving consumer behaviors are critical for companies aiming to leverage the significant growth potential of the US luxury market.
US Luxury Market Company Market Share
US Luxury Market Report: 2019-2033 Forecast
This comprehensive report provides a detailed analysis of the US luxury market, offering invaluable insights for industry professionals, investors, and strategic decision-makers. The report covers the period from 2019 to 2033, with a focus on the estimated year 2025. We project a robust market driven by evolving consumer preferences and technological advancements, providing a clear picture of the opportunities and challenges facing this dynamic sector. The report values are expressed in Millions USD.
US Luxury Market Market Structure & Innovation Trends
This section analyzes the competitive landscape of the US luxury market, examining market concentration, key innovation drivers, regulatory influences, product substitution trends, end-user demographics, and significant M&A activities. The historical period (2019-2024) reveals a market share distribution indicating LVMH Moët Hennessy Louis Vuitton as the leading player, holding approximately xx% of the market, followed by Kering at xx% and others. The total market size in 2024 was estimated at $xx Million.
- Market Concentration: High concentration with a few major players dominating.
- Innovation Drivers: Sustainability initiatives, personalization, technological integration (e.g., NFTs, metaverse experiences), and experiential retail.
- Regulatory Frameworks: Tariffs, import/export regulations, and consumer protection laws influence market dynamics.
- Product Substitutes: The rise of affordable luxury brands and accessible designer collaborations presents competition.
- End-User Demographics: High-net-worth individuals (HNWIs) and affluent millennials and Gen Z are key customer segments.
- M&A Activities: Significant M&A activity has reshaped the market landscape. The total value of M&A deals between 2019-2024 reached approximately $xx Million with several significant acquisitions driving market consolidation. For example, [insert specific example of a major M&A deal and its impact].
US Luxury Market Market Dynamics & Trends
This section delves into the key factors driving market growth, technological disruptions, evolving consumer preferences, and competitive dynamics within the US luxury market. The compound annual growth rate (CAGR) during the historical period (2019-2024) was approximately xx%, with the market expected to reach $xx Million in 2025. Market penetration remains high amongst target demographics, but increasing competition from emerging luxury brands is impacting market share.
The rise of e-commerce has significantly reshaped distribution channels and consumer behavior. The changing consumer landscape, particularly among younger generations, is driving demand for sustainable and ethically sourced products. Growing interest in personalization and experiences is leading to innovative retail strategies, such as pop-up shops and immersive brand events. The continued economic growth and rising disposable incomes within key demographics are fueling market growth. Competitive dynamics are highly influenced by brand image, product innovation, and effective marketing campaigns.
Dominant Regions & Segments in US Luxury Market
This section identifies the leading regions, countries, and product segments within the US luxury market. The analysis is based on segmentations by type (Clothing and Apparel, Footwear, Bags, Jewelry, Watches, Other Accessories) and distribution channel (Single-brand Stores, Multi-brand Stores, Online Stores, Other Distribution Channels). New York City and Los Angeles stand out as primary regions, driven by higher concentrations of HNWIs and affluent consumers.
- By Type: Jewelry and watches maintain a high market share due to their enduring appeal as luxury goods with a substantial luxury brand presence, followed by Clothing and Apparel and Bags.
- By Distribution Channel: Single-brand stores remain the dominant distribution channel, offering a controlled brand experience, while online stores are experiencing significant growth, driven by increasing digital adoption among luxury consumers.
Key Drivers:
- Economic Factors: High disposable incomes, increasing tourism, and a strong US dollar drive market growth.
- Infrastructure: Well-developed retail infrastructure and logistics networks support the sector.
- Consumer Preferences: Desire for exclusivity, craftsmanship, and brand heritage.
US Luxury Market Product Innovations
Recent years have witnessed significant product innovations in the US luxury market, driven primarily by technological advancements and evolving consumer preferences. Brands are increasingly leveraging technology to enhance product personalization, create immersive shopping experiences, and develop new product categories, such as luxury NFTs. The emphasis is on sustainability, ethically sourced materials, and enhanced craftsmanship. Luxury brands are collaborating with tech companies to introduce innovative features in products and services, boosting their competitive advantages.
Report Scope & Segmentation Analysis
This report provides a comprehensive analysis of the US luxury market, segmented by product type (Clothing and Apparel, Footwear, Bags, Jewelry, Watches, Other Accessories) and distribution channel (Single-brand Stores, Multi-brand Stores, Online Stores, Other Distribution Channels).
By Type: Each segment demonstrates varying growth trajectories based on consumer demand and fashion trends. For instance, the Jewelry segment projects a CAGR of xx% from 2025-2033, due to increasing demand for high-value items.
By Distribution Channel: The Single-brand store segment commands a significant market share, and while the Online Stores segment is exhibiting strong growth, Multi-brand stores retain a substantial presence catering to diverse consumer preferences.
Key Drivers of US Luxury Market Growth
The US luxury market growth is driven by several key factors:
- Rising Disposable Incomes: The increasing affluence of high-net-worth individuals and millennials fuels demand.
- Technological Advancements: Innovation in materials, design, and retail experiences enhances the luxury shopping experience.
- Favorable Economic Conditions: A robust economy supports luxury spending.
Challenges in the US Luxury Market Sector
The US luxury market faces challenges including:
- Economic Uncertainty: Global economic downturns can impact luxury spending.
- Supply Chain Disruptions: Global supply chain issues can affect product availability.
- Increased Competition: Growing competition from both established and emerging luxury brands intensifies rivalry.
Emerging Opportunities in US Luxury Market
Opportunities exist in:
- Personalization: Tailoring products and experiences to individual customer preferences.
- Sustainability: Growing demand for environmentally and ethically conscious luxury goods.
- E-commerce Expansion: Leveraging digital channels to reach new customers and enhance the shopping experience.
Leading Players in the US Luxury Market Market
Key Developments in US Luxury Market Industry
- May 2022: Gucci (Kering) and Adidas launched a collaborative luxury goods collection online and in select stores.
- March 2022: De Beers launched a new haute couture jewelry collection, "The Alchemist of Light."
- March 2021: Swatch released limited-edition MoMA-designed wristwatches.
Future Outlook for US Luxury Market Market
The US luxury market is poised for continued growth, driven by technological innovation, evolving consumer preferences, and a resilient economy. Strategic investments in personalization, sustainability, and digital experiences will be crucial for success. The market's future will be shaped by its ability to adapt to changing consumer demands and maintain its position as a symbol of exclusivity and aspirational lifestyle.
US Luxury Market Segmentation
-
1. Type
- 1.1. Clothing and Apparel
- 1.2. Footwear
- 1.3. Bags
- 1.4. Jewelry
- 1.5. Watches
- 1.6. Other Accessories
-
2. Distribution Channel
- 2.1. Single-brand Stores
- 2.2. Multi-brand Stores
- 2.3. Online Stores
- 2.4. Other Distribution Channels
US Luxury Market Segmentation By Geography
-
1. North America
- 1.1. United States
- 1.2. Canada
- 1.3. Mexico
-
2. South America
- 2.1. Brazil
- 2.2. Argentina
- 2.3. Rest of South America
-
3. Europe
- 3.1. United Kingdom
- 3.2. Germany
- 3.3. France
- 3.4. Italy
- 3.5. Spain
- 3.6. Russia
- 3.7. Benelux
- 3.8. Nordics
- 3.9. Rest of Europe
-
4. Middle East & Africa
- 4.1. Turkey
- 4.2. Israel
- 4.3. GCC
- 4.4. North Africa
- 4.5. South Africa
- 4.6. Rest of Middle East & Africa
-
5. Asia Pacific
- 5.1. China
- 5.2. India
- 5.3. Japan
- 5.4. South Korea
- 5.5. ASEAN
- 5.6. Oceania
- 5.7. Rest of Asia Pacific
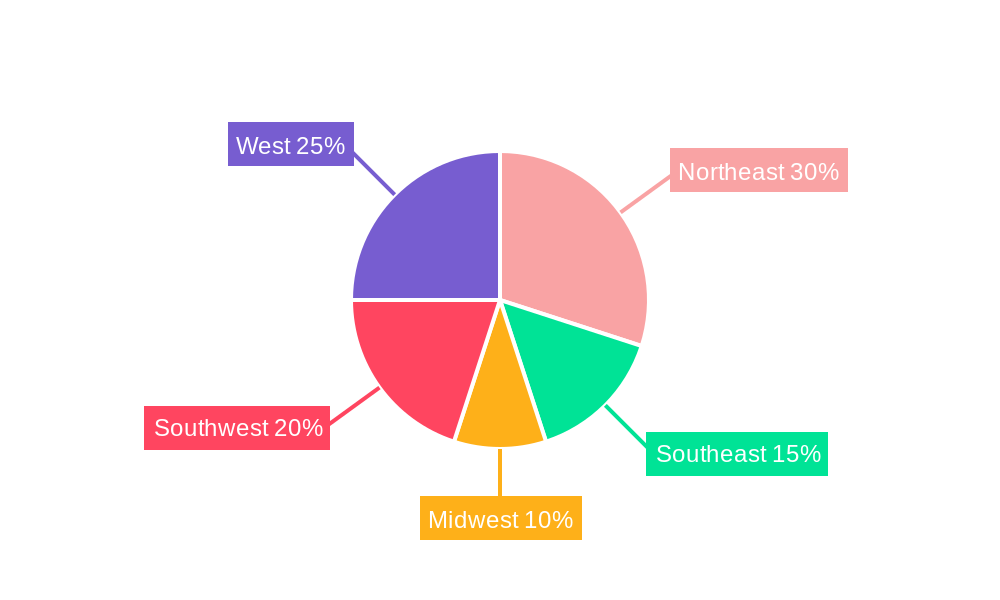
US Luxury Market Regional Market Share
Geographic Coverage of US Luxury Market
US Luxury Market REPORT HIGHLIGHTS
| Aspects | Details |
|---|---|
| Study Period | 2020-2034 |
| Base Year | 2025 |
| Estimated Year | 2026 |
| Forecast Period | 2026-2034 |
| Historical Period | 2020-2025 |
| Growth Rate | CAGR of 5.8% from 2020-2034 |
| Segmentation |
|
Table of Contents
- 1. Introduction
- 1.1. Research Scope
- 1.2. Market Segmentation
- 1.3. Research Objective
- 1.4. Definitions and Assumptions
- 2. Executive Summary
- 2.1. Market Snapshot
- 3. Market Dynamics
- 3.1. Market Drivers
- 3.2. Market Restrains
- 3.3. Market Trends
- 3.4. Market Opportunities
- 4. Market Factor Analysis
- 4.1. Porters Five Forces
- 4.1.1. Bargaining Power of Suppliers
- 4.1.2. Bargaining Power of Buyers
- 4.1.3. Threat of New Entrants
- 4.1.4. Threat of Substitutes
- 4.1.5. Competitive Rivalry
- 4.2. PESTEL analysis
- 4.3. BCG Analysis
- 4.3.1. Stars (High Growth, High Market Share)
- 4.3.2. Cash Cows (Low Growth, High Market Share)
- 4.3.3. Question Mark (High Growth, Low Market Share)
- 4.3.4. Dogs (Low Growth, Low Market Share)
- 4.4. Ansoff Matrix Analysis
- 4.5. Supply Chain Analysis
- 4.6. Regulatory Landscape
- 4.7. Current Market Potential and Opportunity Assessment (TAM–SAM–SOM Framework)
- 4.8. PRI Analyst Note
- 4.1. Porters Five Forces
- 5. Market Analysis, Insights and Forecast 2021-2033
- 5.1. Market Analysis, Insights and Forecast - by Type
- 5.1.1. Clothing and Apparel
- 5.1.2. Footwear
- 5.1.3. Bags
- 5.1.4. Jewelry
- 5.1.5. Watches
- 5.1.6. Other Accessories
- 5.2. Market Analysis, Insights and Forecast - by Distribution Channel
- 5.2.1. Single-brand Stores
- 5.2.2. Multi-brand Stores
- 5.2.3. Online Stores
- 5.2.4. Other Distribution Channels
- 5.3. Market Analysis, Insights and Forecast - by Region
- 5.3.1. North America
- 5.3.2. South America
- 5.3.3. Europe
- 5.3.4. Middle East & Africa
- 5.3.5. Asia Pacific
- 5.1. Market Analysis, Insights and Forecast - by Type
- 6. Global US Luxury Market Analysis, Insights and Forecast, 2021-2033
- 6.1. Market Analysis, Insights and Forecast - by Type
- 6.1.1. Clothing and Apparel
- 6.1.2. Footwear
- 6.1.3. Bags
- 6.1.4. Jewelry
- 6.1.5. Watches
- 6.1.6. Other Accessories
- 6.2. Market Analysis, Insights and Forecast - by Distribution Channel
- 6.2.1. Single-brand Stores
- 6.2.2. Multi-brand Stores
- 6.2.3. Online Stores
- 6.2.4. Other Distribution Channels
- 6.1. Market Analysis, Insights and Forecast - by Type
- 7. North America US Luxury Market Analysis, Insights and Forecast, 2020-2032
- 7.1. Market Analysis, Insights and Forecast - by Type
- 7.1.1. Clothing and Apparel
- 7.1.2. Footwear
- 7.1.3. Bags
- 7.1.4. Jewelry
- 7.1.5. Watches
- 7.1.6. Other Accessories
- 7.2. Market Analysis, Insights and Forecast - by Distribution Channel
- 7.2.1. Single-brand Stores
- 7.2.2. Multi-brand Stores
- 7.2.3. Online Stores
- 7.2.4. Other Distribution Channels
- 7.1. Market Analysis, Insights and Forecast - by Type
- 8. South America US Luxury Market Analysis, Insights and Forecast, 2020-2032
- 8.1. Market Analysis, Insights and Forecast - by Type
- 8.1.1. Clothing and Apparel
- 8.1.2. Footwear
- 8.1.3. Bags
- 8.1.4. Jewelry
- 8.1.5. Watches
- 8.1.6. Other Accessories
- 8.2. Market Analysis, Insights and Forecast - by Distribution Channel
- 8.2.1. Single-brand Stores
- 8.2.2. Multi-brand Stores
- 8.2.3. Online Stores
- 8.2.4. Other Distribution Channels
- 8.1. Market Analysis, Insights and Forecast - by Type
- 9. Europe US Luxury Market Analysis, Insights and Forecast, 2020-2032
- 9.1. Market Analysis, Insights and Forecast - by Type
- 9.1.1. Clothing and Apparel
- 9.1.2. Footwear
- 9.1.3. Bags
- 9.1.4. Jewelry
- 9.1.5. Watches
- 9.1.6. Other Accessories
- 9.2. Market Analysis, Insights and Forecast - by Distribution Channel
- 9.2.1. Single-brand Stores
- 9.2.2. Multi-brand Stores
- 9.2.3. Online Stores
- 9.2.4. Other Distribution Channels
- 9.1. Market Analysis, Insights and Forecast - by Type
- 10. Middle East & Africa US Luxury Market Analysis, Insights and Forecast, 2020-2032
- 10.1. Market Analysis, Insights and Forecast - by Type
- 10.1.1. Clothing and Apparel
- 10.1.2. Footwear
- 10.1.3. Bags
- 10.1.4. Jewelry
- 10.1.5. Watches
- 10.1.6. Other Accessories
- 10.2. Market Analysis, Insights and Forecast - by Distribution Channel
- 10.2.1. Single-brand Stores
- 10.2.2. Multi-brand Stores
- 10.2.3. Online Stores
- 10.2.4. Other Distribution Channels
- 10.1. Market Analysis, Insights and Forecast - by Type
- 11. Asia Pacific US Luxury Market Analysis, Insights and Forecast, 2020-2032
- 11.1. Market Analysis, Insights and Forecast - by Type
- 11.1.1. Clothing and Apparel
- 11.1.2. Footwear
- 11.1.3. Bags
- 11.1.4. Jewelry
- 11.1.5. Watches
- 11.1.6. Other Accessories
- 11.2. Market Analysis, Insights and Forecast - by Distribution Channel
- 11.2.1. Single-brand Stores
- 11.2.2. Multi-brand Stores
- 11.2.3. Online Stores
- 11.2.4. Other Distribution Channels
- 11.1. Market Analysis, Insights and Forecast - by Type
- 12. Competitive Analysis
- 12.1. Company Profiles
- 12.1.1 Giorgio Armani S p A
- 12.1.1.1. Company Overview
- 12.1.1.2. Products
- 12.1.1.3. Company Financials
- 12.1.1.4. SWOT Analysis
- 12.1.2 The Swatch Group
- 12.1.2.1. Company Overview
- 12.1.2.2. Products
- 12.1.2.3. Company Financials
- 12.1.2.4. SWOT Analysis
- 12.1.3 Kering
- 12.1.3.1. Company Overview
- 12.1.3.2. Products
- 12.1.3.3. Company Financials
- 12.1.3.4. SWOT Analysis
- 12.1.4 Compagnie Financière Richemont S A
- 12.1.4.1. Company Overview
- 12.1.4.2. Products
- 12.1.4.3. Company Financials
- 12.1.4.4. SWOT Analysis
- 12.1.5 L'Oreal Luxe
- 12.1.5.1. Company Overview
- 12.1.5.2. Products
- 12.1.5.3. Company Financials
- 12.1.5.4. SWOT Analysis
- 12.1.6 Rolex SA
- 12.1.6.1. Company Overview
- 12.1.6.2. Products
- 12.1.6.3. Company Financials
- 12.1.6.4. SWOT Analysis
- 12.1.7 PVH Corp
- 12.1.7.1. Company Overview
- 12.1.7.2. Products
- 12.1.7.3. Company Financials
- 12.1.7.4. SWOT Analysis
- 12.1.8 The Estee Lauder Companies
- 12.1.8.1. Company Overview
- 12.1.8.2. Products
- 12.1.8.3. Company Financials
- 12.1.8.4. SWOT Analysis
- 12.1.9 LVMH Moët Hennessy Louis Vuitton
- 12.1.9.1. Company Overview
- 12.1.9.2. Products
- 12.1.9.3. Company Financials
- 12.1.9.4. SWOT Analysis
- 12.1.10 Burberry*List Not Exhaustive
- 12.1.10.1. Company Overview
- 12.1.10.2. Products
- 12.1.10.3. Company Financials
- 12.1.10.4. SWOT Analysis
- 12.1.1 Giorgio Armani S p A
- 12.2. Market Entropy
- 12.2.1 Company's Key Areas Served
- 12.2.2 Recent Developments
- 12.3. Company Market Share Analysis 2025
- 12.3.1 Top 5 Companies Market Share Analysis
- 12.3.2 Top 3 Companies Market Share Analysis
- 12.4. List of Potential Customers
- 13. Research Methodology
List of Figures
- Figure 1: Global US Luxury Market Revenue Breakdown (billion, %) by Region 2025 & 2033
- Figure 2: North America US Luxury Market Revenue (billion), by Type 2025 & 2033
- Figure 3: North America US Luxury Market Revenue Share (%), by Type 2025 & 2033
- Figure 4: North America US Luxury Market Revenue (billion), by Distribution Channel 2025 & 2033
- Figure 5: North America US Luxury Market Revenue Share (%), by Distribution Channel 2025 & 2033
- Figure 6: North America US Luxury Market Revenue (billion), by Country 2025 & 2033
- Figure 7: North America US Luxury Market Revenue Share (%), by Country 2025 & 2033
- Figure 8: South America US Luxury Market Revenue (billion), by Type 2025 & 2033
- Figure 9: South America US Luxury Market Revenue Share (%), by Type 2025 & 2033
- Figure 10: South America US Luxury Market Revenue (billion), by Distribution Channel 2025 & 2033
- Figure 11: South America US Luxury Market Revenue Share (%), by Distribution Channel 2025 & 2033
- Figure 12: South America US Luxury Market Revenue (billion), by Country 2025 & 2033
- Figure 13: South America US Luxury Market Revenue Share (%), by Country 2025 & 2033
- Figure 14: Europe US Luxury Market Revenue (billion), by Type 2025 & 2033
- Figure 15: Europe US Luxury Market Revenue Share (%), by Type 2025 & 2033
- Figure 16: Europe US Luxury Market Revenue (billion), by Distribution Channel 2025 & 2033
- Figure 17: Europe US Luxury Market Revenue Share (%), by Distribution Channel 2025 & 2033
- Figure 18: Europe US Luxury Market Revenue (billion), by Country 2025 & 2033
- Figure 19: Europe US Luxury Market Revenue Share (%), by Country 2025 & 2033
- Figure 20: Middle East & Africa US Luxury Market Revenue (billion), by Type 2025 & 2033
- Figure 21: Middle East & Africa US Luxury Market Revenue Share (%), by Type 2025 & 2033
- Figure 22: Middle East & Africa US Luxury Market Revenue (billion), by Distribution Channel 2025 & 2033
- Figure 23: Middle East & Africa US Luxury Market Revenue Share (%), by Distribution Channel 2025 & 2033
- Figure 24: Middle East & Africa US Luxury Market Revenue (billion), by Country 2025 & 2033
- Figure 25: Middle East & Africa US Luxury Market Revenue Share (%), by Country 2025 & 2033
- Figure 26: Asia Pacific US Luxury Market Revenue (billion), by Type 2025 & 2033
- Figure 27: Asia Pacific US Luxury Market Revenue Share (%), by Type 2025 & 2033
- Figure 28: Asia Pacific US Luxury Market Revenue (billion), by Distribution Channel 2025 & 2033
- Figure 29: Asia Pacific US Luxury Market Revenue Share (%), by Distribution Channel 2025 & 2033
- Figure 30: Asia Pacific US Luxury Market Revenue (billion), by Country 2025 & 2033
- Figure 31: Asia Pacific US Luxury Market Revenue Share (%), by Country 2025 & 2033
List of Tables
- Table 1: Global US Luxury Market Revenue billion Forecast, by Type 2020 & 2033
- Table 2: Global US Luxury Market Revenue billion Forecast, by Distribution Channel 2020 & 2033
- Table 3: Global US Luxury Market Revenue billion Forecast, by Region 2020 & 2033
- Table 4: Global US Luxury Market Revenue billion Forecast, by Type 2020 & 2033
- Table 5: Global US Luxury Market Revenue billion Forecast, by Distribution Channel 2020 & 2033
- Table 6: Global US Luxury Market Revenue billion Forecast, by Country 2020 & 2033
- Table 7: United States US Luxury Market Revenue (billion) Forecast, by Application 2020 & 2033
- Table 8: Canada US Luxury Market Revenue (billion) Forecast, by Application 2020 & 2033
- Table 9: Mexico US Luxury Market Revenue (billion) Forecast, by Application 2020 & 2033
- Table 10: Global US Luxury Market Revenue billion Forecast, by Type 2020 & 2033
- Table 11: Global US Luxury Market Revenue billion Forecast, by Distribution Channel 2020 & 2033
- Table 12: Global US Luxury Market Revenue billion Forecast, by Country 2020 & 2033
- Table 13: Brazil US Luxury Market Revenue (billion) Forecast, by Application 2020 & 2033
- Table 14: Argentina US Luxury Market Revenue (billion) Forecast, by Application 2020 & 2033
- Table 15: Rest of South America US Luxury Market Revenue (billion) Forecast, by Application 2020 & 2033
- Table 16: Global US Luxury Market Revenue billion Forecast, by Type 2020 & 2033
- Table 17: Global US Luxury Market Revenue billion Forecast, by Distribution Channel 2020 & 2033
- Table 18: Global US Luxury Market Revenue billion Forecast, by Country 2020 & 2033
- Table 19: United Kingdom US Luxury Market Revenue (billion) Forecast, by Application 2020 & 2033
- Table 20: Germany US Luxury Market Revenue (billion) Forecast, by Application 2020 & 2033
- Table 21: France US Luxury Market Revenue (billion) Forecast, by Application 2020 & 2033
- Table 22: Italy US Luxury Market Revenue (billion) Forecast, by Application 2020 & 2033
- Table 23: Spain US Luxury Market Revenue (billion) Forecast, by Application 2020 & 2033
- Table 24: Russia US Luxury Market Revenue (billion) Forecast, by Application 2020 & 2033
- Table 25: Benelux US Luxury Market Revenue (billion) Forecast, by Application 2020 & 2033
- Table 26: Nordics US Luxury Market Revenue (billion) Forecast, by Application 2020 & 2033
- Table 27: Rest of Europe US Luxury Market Revenue (billion) Forecast, by Application 2020 & 2033
- Table 28: Global US Luxury Market Revenue billion Forecast, by Type 2020 & 2033
- Table 29: Global US Luxury Market Revenue billion Forecast, by Distribution Channel 2020 & 2033
- Table 30: Global US Luxury Market Revenue billion Forecast, by Country 2020 & 2033
- Table 31: Turkey US Luxury Market Revenue (billion) Forecast, by Application 2020 & 2033
- Table 32: Israel US Luxury Market Revenue (billion) Forecast, by Application 2020 & 2033
- Table 33: GCC US Luxury Market Revenue (billion) Forecast, by Application 2020 & 2033
- Table 34: North Africa US Luxury Market Revenue (billion) Forecast, by Application 2020 & 2033
- Table 35: South Africa US Luxury Market Revenue (billion) Forecast, by Application 2020 & 2033
- Table 36: Rest of Middle East & Africa US Luxury Market Revenue (billion) Forecast, by Application 2020 & 2033
- Table 37: Global US Luxury Market Revenue billion Forecast, by Type 2020 & 2033
- Table 38: Global US Luxury Market Revenue billion Forecast, by Distribution Channel 2020 & 2033
- Table 39: Global US Luxury Market Revenue billion Forecast, by Country 2020 & 2033
- Table 40: China US Luxury Market Revenue (billion) Forecast, by Application 2020 & 2033
- Table 41: India US Luxury Market Revenue (billion) Forecast, by Application 2020 & 2033
- Table 42: Japan US Luxury Market Revenue (billion) Forecast, by Application 2020 & 2033
- Table 43: South Korea US Luxury Market Revenue (billion) Forecast, by Application 2020 & 2033
- Table 44: ASEAN US Luxury Market Revenue (billion) Forecast, by Application 2020 & 2033
- Table 45: Oceania US Luxury Market Revenue (billion) Forecast, by Application 2020 & 2033
- Table 46: Rest of Asia Pacific US Luxury Market Revenue (billion) Forecast, by Application 2020 & 2033
Frequently Asked Questions
1. What is the projected Compound Annual Growth Rate (CAGR) of the US Luxury Market?
The projected CAGR is approximately 5.8%.
2. Which companies are prominent players in the US Luxury Market?
Key companies in the market include Giorgio Armani S p A, The Swatch Group, Kering, Compagnie Financière Richemont S A, L'Oreal Luxe, Rolex SA, PVH Corp, The Estee Lauder Companies, LVMH Moët Hennessy Louis Vuitton, Burberry*List Not Exhaustive.
3. What are the main segments of the US Luxury Market?
The market segments include Type, Distribution Channel.
4. Can you provide details about the market size?
The market size is estimated to be USD 274.8 billion as of 2022.
5. What are some drivers contributing to market growth?
Demand for Smartwatches; Popularity of Luxury Watches.
6. What are the notable trends driving market growth?
High Prevalence of Fashion-Conscious Consumers.
7. Are there any restraints impacting market growth?
Presence of Fake Brands in the Market.
8. Can you provide examples of recent developments in the market?
In May 2022, Kering group's brand Gucci collaborated with Adidas in launching their new luxury goods through an online platform along with a few selected stores. With this launch, the brands focused on launching hybrid pattern ready-to-wear clothes and accessories in the region.
9. What pricing options are available for accessing the report?
Pricing options include single-user, multi-user, and enterprise licenses priced at USD 3800, USD 4500, and USD 5800 respectively.
10. Is the market size provided in terms of value or volume?
The market size is provided in terms of value, measured in billion.
11. Are there any specific market keywords associated with the report?
Yes, the market keyword associated with the report is "US Luxury Market," which aids in identifying and referencing the specific market segment covered.
12. How do I determine which pricing option suits my needs best?
The pricing options vary based on user requirements and access needs. Individual users may opt for single-user licenses, while businesses requiring broader access may choose multi-user or enterprise licenses for cost-effective access to the report.
13. Are there any additional resources or data provided in the US Luxury Market report?
While the report offers comprehensive insights, it's advisable to review the specific contents or supplementary materials provided to ascertain if additional resources or data are available.
14. How can I stay updated on further developments or reports in the US Luxury Market?
To stay informed about further developments, trends, and reports in the US Luxury Market, consider subscribing to industry newsletters, following relevant companies and organizations, or regularly checking reputable industry news sources and publications.
Methodology
Step 1 - Identification of Relevant Samples Size from Population Database


Step 2 - Approaches for Defining Global Market Size (Value, Volume* & Price*)

Note*: In applicable scenarios
Step 3 - Data Sources
Primary Research
- Web Analytics
- Survey Reports
- Research Institute
- Latest Research Reports
- Opinion Leaders
Secondary Research
- Annual Reports
- White Paper
- Latest Press Release
- Industry Association
- Paid Database
- Investor Presentations

Step 4 - Data Triangulation
Involves using different sources of information in order to increase the validity of a study
These sources are likely to be stakeholders in a program - participants, other researchers, program staff, other community members, and so on.
Then we put all data in single framework & apply various statistical tools to find out the dynamic on the market.
During the analysis stage, feedback from the stakeholder groups would be compared to determine areas of agreement as well as areas of divergence