

Key Insights
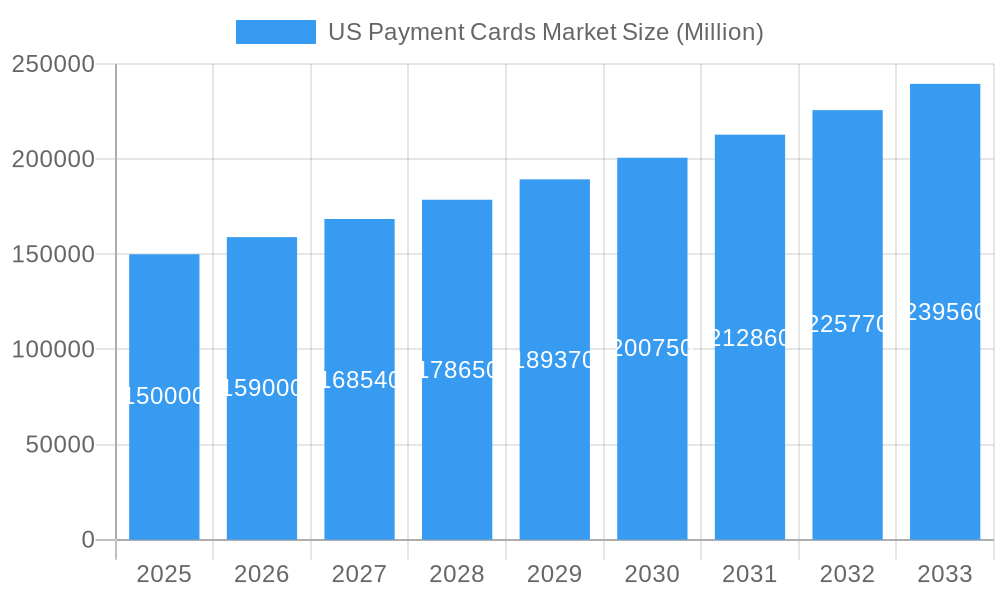
The US payment cards market is poised for substantial expansion, driven by the accelerating adoption of digital payment solutions and the burgeoning e-commerce landscape. The market, estimated at $6.48 billion in 2025, is projected to achieve a Compound Annual Growth Rate (CAGR) of 16.13% through 2033. This robust growth trajectory is underpinned by several critical drivers. The sustained shift towards contactless payments, amplified by recent global events, is fueling demand for virtual cards across both business-to-business (B2B) and business-to-consumer (B2C) transactions. Additionally, the proliferation of embedded finance, which seamlessly integrates payment functionalities into diverse platforms and applications, significantly bolsters market expansion. The increasing consumer preference for online shopping and subscription-based services further stimulates the demand for secure and convenient digital payment alternatives. Market segmentation highlights robust growth in B2C remote payment virtual cards and B2C Point of Sale (POS) virtual cards, reflecting a clear consumer emphasis on ease of use and security. The business segment is also demonstrating strong performance, propelled by the imperative for efficient expense management and enhanced financial control within organizations. Leading industry players, including Visa, Mastercard, and American Express, alongside innovative fintech companies like Stripe and Abine, are actively influencing market dynamics through continuous innovation and strategic alliances.
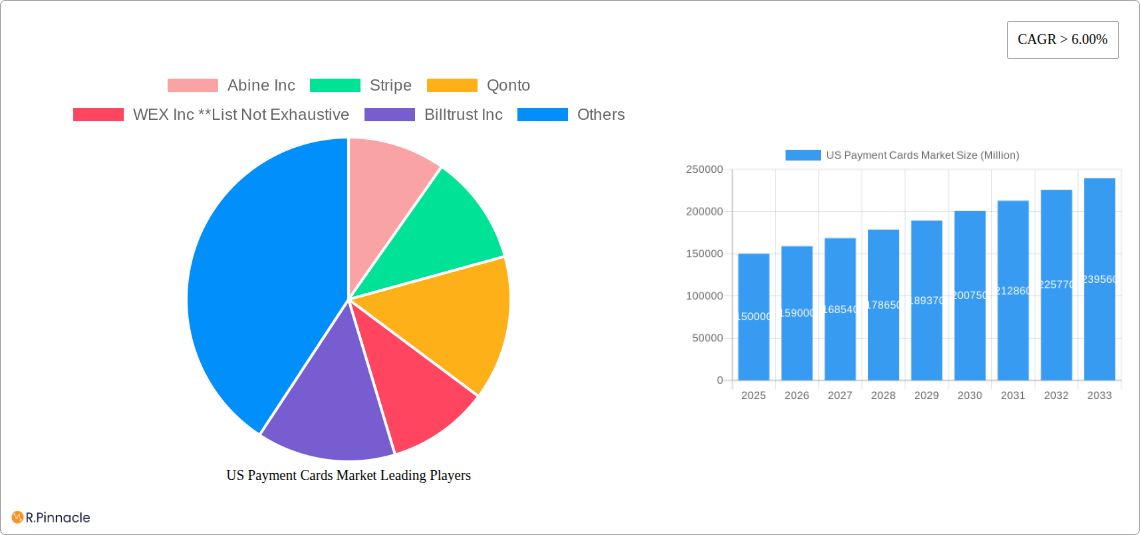
US Payment Cards Market Market Size (In Billion)
Despite the positive growth outlook, the US payment cards market faces certain challenges. Stringent regulatory compliance mandates and persistent concerns regarding data security and fraud prevention represent significant constraints. Intensifying competition among established market leaders and emerging fintech entities necessitates continuous innovation and strategic adaptation to sustain market share. Nevertheless, the long-term prospects for the US payment cards market remain highly favorable, presenting substantial growth opportunities fueled by ongoing technological advancements and evolving consumer behaviors. The widespread adoption of virtual cards across various market segments and the continuous development of sophisticated payment security measures will be instrumental in shaping the market's future trajectory. Future growth will be contingent upon economic conditions, technological innovation, and evolving regulatory frameworks.
US Payment Cards Market Company Market Share
US Payment Cards Market: A Comprehensive Report (2019-2033)
This in-depth report provides a comprehensive analysis of the US Payment Cards Market, offering invaluable insights for industry professionals, investors, and strategic planners. Covering the period from 2019 to 2033, with a focus on 2025, this report dissects market dynamics, identifies key players, and forecasts future growth trajectories. The report leverages extensive data analysis and industry expertise to provide actionable intelligence for informed decision-making.
US Payment Cards Market Market Structure & Innovation Trends
The US payment cards market exhibits a dynamic interplay of established giants and innovative fintechs. Market concentration is moderately high, with a few dominant players commanding significant market share (estimated at xx% for the top 3 players in 2025). Innovation is driven primarily by the increasing adoption of digital payment technologies, evolving consumer preferences, and the regulatory push towards enhanced security and financial inclusion. Regulatory frameworks like PCI DSS and the Dodd-Frank Act significantly impact market operations. Key product substitutes include mobile wallets and other digital payment solutions. End-user demographics are shifting towards younger, tech-savvy populations, driving the adoption of contactless and mobile payment methods. Significant M&A activity has been observed in recent years, with deal values exceeding xx Million in 2024.
- Market Share: Top 3 players hold xx% combined market share (2025 est.)
- M&A Activity: Total deal value exceeding xx Million in 2024.
- Innovation Drivers: Digitalization, consumer preferences, regulatory changes.
- Regulatory Framework: PCI DSS, Dodd-Frank Act.
US Payment Cards Market Market Dynamics & Trends
The US payment cards market is experiencing robust growth, fueled by several key factors. The increasing penetration of smartphones and internet access, coupled with rising e-commerce transactions, is a major driver. Technological advancements, particularly in areas like contactless payments, mobile wallets, and biometric authentication, are reshaping the market landscape. Consumer preferences are shifting towards seamless, secure, and convenient payment experiences. Competitive dynamics are characterized by intense rivalry among established players and the emergence of innovative fintech companies. The Compound Annual Growth Rate (CAGR) is projected to be xx% during the forecast period (2025-2033), with market penetration reaching xx% by 2033.
Dominant Regions & Segments in US Payment Cards Market
The US payment cards market is geographically diverse, with significant variations in growth rates and adoption patterns across regions. However, the analysis shows that the Northeast and West Coast regions are expected to lead the market throughout the forecast period (2025-2033).
By Product Type:
- B2B Virtual Cards: High growth driven by increasing corporate adoption of streamlined payment solutions.
- B2C Remote Payment Virtual Cards: Rapid expansion fueled by the surge in online shopping and digital transactions.
- B2C POS Virtual Cards: Steady growth driven by the widespread adoption of contactless payment technologies at point-of-sale terminals.
By End-User:
- Business Use: Strong growth trajectory due to the rising need for efficient B2B payment solutions.
- Consumer Use: Sustained growth powered by the increasing preference for digital and contactless payments.
Key Drivers:
- Robust e-commerce growth.
- Expanding digital infrastructure.
- Favorable regulatory environment.
US Payment Cards Market Product Innovations
The market is witnessing continuous innovation in payment card technologies, encompassing advanced security features, contactless payment capabilities, and embedded financial services. The integration of blockchain technology and artificial intelligence is enhancing security and transaction efficiency. These innovations are driving market expansion by catering to the evolving needs of consumers and businesses, creating a competitive landscape characterized by rapid product evolution and enhanced user experiences.
Report Scope & Segmentation Analysis
This report offers a detailed segmentation of the US payment cards market based on product type (B2B Virtual Cards, B2C Remote Payment Virtual Cards, B2C POS Virtual Cards) and end-user (Consumer Use, Business Use). Each segment’s market size, growth projections, and competitive dynamics are thoroughly examined. For example, the B2B Virtual Card segment is expected to experience significant growth due to increasing demand for efficient and secure business payment solutions.
Key Drivers of US Payment Cards Market Growth
The US payment cards market's growth is driven by a confluence of factors: the widespread adoption of digital technologies, expanding e-commerce, increasing consumer preference for contactless payments, and supportive government regulations promoting financial inclusion. These drivers are creating a robust and dynamic environment for payment card providers.
Challenges in the US Payment Cards Market Sector
The US payment cards market faces challenges such as increasing fraud and cyber security threats, stringent regulatory compliance requirements, and the need for continuous innovation to stay ahead of the competition. These challenges pose significant hurdles for market players and necessitate proactive strategies for mitigation and adaptation.
Emerging Opportunities in US Payment Cards Market
Emerging opportunities lie in the integration of new technologies like AI and blockchain, expansion into underserved markets, and the development of innovative payment solutions tailored to niche customer segments. The growth of the mobile payments sector also presents substantial opportunities for market expansion and diversification.
Key Developments in US Payment Cards Market Industry
- June 2022: Visa and Safaricom launch a virtual card, enabling 30 Million M-Pesa users to make global digital payments, significantly impacting the market's reach and adoption of digital payments in the US region.
- April 2022: American Express partners with Billtrust to streamline the acceptance of American Express virtual cards by suppliers, improving B2B payment efficiency and automation.
Future Outlook for US Payment Cards Market Market
The future of the US payment cards market is bright, with continued growth projected across all segments. Technological advancements, evolving consumer preferences, and strategic partnerships will shape the market's trajectory. The focus on enhancing security, improving user experience, and expanding into new markets will drive innovation and expansion in the coming years.
US Payment Cards Market Segmentation
-
1. Product Type
- 1.1. B2B Virtual Cards
- 1.2. B2C Remote Payment Virtual Cards
- 1.3. B2C POS Virtual Cards
-
2. End-User
- 2.1. Consumer Use
- 2.2. Business Use
US Payment Cards Market Segmentation By Geography
-
1. North America
- 1.1. United States
- 1.2. Canada
- 1.3. Mexico
-
2. South America
- 2.1. Brazil
- 2.2. Argentina
- 2.3. Rest of South America
-
3. Europe
- 3.1. United Kingdom
- 3.2. Germany
- 3.3. France
- 3.4. Italy
- 3.5. Spain
- 3.6. Russia
- 3.7. Benelux
- 3.8. Nordics
- 3.9. Rest of Europe
-
4. Middle East & Africa
- 4.1. Turkey
- 4.2. Israel
- 4.3. GCC
- 4.4. North Africa
- 4.5. South Africa
- 4.6. Rest of Middle East & Africa
-
5. Asia Pacific
- 5.1. China
- 5.2. India
- 5.3. Japan
- 5.4. South Korea
- 5.5. ASEAN
- 5.6. Oceania
- 5.7. Rest of Asia Pacific
US Payment Cards Market Regional Market Share
Geographic Coverage of US Payment Cards Market
US Payment Cards Market REPORT HIGHLIGHTS
| Aspects | Details |
|---|---|
| Study Period | 2020-2034 |
| Base Year | 2025 |
| Estimated Year | 2026 |
| Forecast Period | 2026-2034 |
| Historical Period | 2020-2025 |
| Growth Rate | CAGR of 16.13% from 2020-2034 |
| Segmentation |
|
Table of Contents
- 1. Introduction
- 1.1. Research Scope
- 1.2. Market Segmentation
- 1.3. Research Objective
- 1.4. Definitions and Assumptions
- 2. Executive Summary
- 2.1. Market Snapshot
- 3. Market Dynamics
- 3.1. Market Drivers
- 3.2. Market Restrains
- 3.3. Market Trends
- 3.4. Market Opportunities
- 4. Market Factor Analysis
- 4.1. Porters Five Forces
- 4.1.1. Bargaining Power of Suppliers
- 4.1.2. Bargaining Power of Buyers
- 4.1.3. Threat of New Entrants
- 4.1.4. Threat of Substitutes
- 4.1.5. Competitive Rivalry
- 4.2. PESTEL analysis
- 4.3. BCG Analysis
- 4.3.1. Stars (High Growth, High Market Share)
- 4.3.2. Cash Cows (Low Growth, High Market Share)
- 4.3.3. Question Mark (High Growth, Low Market Share)
- 4.3.4. Dogs (Low Growth, Low Market Share)
- 4.4. Ansoff Matrix Analysis
- 4.5. Supply Chain Analysis
- 4.6. Regulatory Landscape
- 4.7. Current Market Potential and Opportunity Assessment (TAM–SAM–SOM Framework)
- 4.8. PRI Analyst Note
- 4.1. Porters Five Forces
- 5. Market Analysis, Insights and Forecast 2021-2033
- 5.1. Market Analysis, Insights and Forecast - by Product Type
- 5.1.1. B2B Virtual Cards
- 5.1.2. B2C Remote Payment Virtual Cards
- 5.1.3. B2C POS Virtual Cards
- 5.2. Market Analysis, Insights and Forecast - by End-User
- 5.2.1. Consumer Use
- 5.2.2. Business Use
- 5.3. Market Analysis, Insights and Forecast - by Region
- 5.3.1. North America
- 5.3.2. South America
- 5.3.3. Europe
- 5.3.4. Middle East & Africa
- 5.3.5. Asia Pacific
- 5.1. Market Analysis, Insights and Forecast - by Product Type
- 6. Global US Payment Cards Market Analysis, Insights and Forecast, 2021-2033
- 6.1. Market Analysis, Insights and Forecast - by Product Type
- 6.1.1. B2B Virtual Cards
- 6.1.2. B2C Remote Payment Virtual Cards
- 6.1.3. B2C POS Virtual Cards
- 6.2. Market Analysis, Insights and Forecast - by End-User
- 6.2.1. Consumer Use
- 6.2.2. Business Use
- 6.1. Market Analysis, Insights and Forecast - by Product Type
- 7. North America US Payment Cards Market Analysis, Insights and Forecast, 2020-2032
- 7.1. Market Analysis, Insights and Forecast - by Product Type
- 7.1.1. B2B Virtual Cards
- 7.1.2. B2C Remote Payment Virtual Cards
- 7.1.3. B2C POS Virtual Cards
- 7.2. Market Analysis, Insights and Forecast - by End-User
- 7.2.1. Consumer Use
- 7.2.2. Business Use
- 7.1. Market Analysis, Insights and Forecast - by Product Type
- 8. South America US Payment Cards Market Analysis, Insights and Forecast, 2020-2032
- 8.1. Market Analysis, Insights and Forecast - by Product Type
- 8.1.1. B2B Virtual Cards
- 8.1.2. B2C Remote Payment Virtual Cards
- 8.1.3. B2C POS Virtual Cards
- 8.2. Market Analysis, Insights and Forecast - by End-User
- 8.2.1. Consumer Use
- 8.2.2. Business Use
- 8.1. Market Analysis, Insights and Forecast - by Product Type
- 9. Europe US Payment Cards Market Analysis, Insights and Forecast, 2020-2032
- 9.1. Market Analysis, Insights and Forecast - by Product Type
- 9.1.1. B2B Virtual Cards
- 9.1.2. B2C Remote Payment Virtual Cards
- 9.1.3. B2C POS Virtual Cards
- 9.2. Market Analysis, Insights and Forecast - by End-User
- 9.2.1. Consumer Use
- 9.2.2. Business Use
- 9.1. Market Analysis, Insights and Forecast - by Product Type
- 10. Middle East & Africa US Payment Cards Market Analysis, Insights and Forecast, 2020-2032
- 10.1. Market Analysis, Insights and Forecast - by Product Type
- 10.1.1. B2B Virtual Cards
- 10.1.2. B2C Remote Payment Virtual Cards
- 10.1.3. B2C POS Virtual Cards
- 10.2. Market Analysis, Insights and Forecast - by End-User
- 10.2.1. Consumer Use
- 10.2.2. Business Use
- 10.1. Market Analysis, Insights and Forecast - by Product Type
- 11. Asia Pacific US Payment Cards Market Analysis, Insights and Forecast, 2020-2032
- 11.1. Market Analysis, Insights and Forecast - by Product Type
- 11.1.1. B2B Virtual Cards
- 11.1.2. B2C Remote Payment Virtual Cards
- 11.1.3. B2C POS Virtual Cards
- 11.2. Market Analysis, Insights and Forecast - by End-User
- 11.2.1. Consumer Use
- 11.2.2. Business Use
- 11.1. Market Analysis, Insights and Forecast - by Product Type
- 12. Competitive Analysis
- 12.1. Company Profiles
- 12.1.1 Abine Inc
- 12.1.1.1. Company Overview
- 12.1.1.2. Products
- 12.1.1.3. Company Financials
- 12.1.1.4. SWOT Analysis
- 12.1.2 Stripe
- 12.1.2.1. Company Overview
- 12.1.2.2. Products
- 12.1.2.3. Company Financials
- 12.1.2.4. SWOT Analysis
- 12.1.3 Qonto
- 12.1.3.1. Company Overview
- 12.1.3.2. Products
- 12.1.3.3. Company Financials
- 12.1.3.4. SWOT Analysis
- 12.1.4 WEX Inc **List Not Exhaustive
- 12.1.4.1. Company Overview
- 12.1.4.2. Products
- 12.1.4.3. Company Financials
- 12.1.4.4. SWOT Analysis
- 12.1.5 Billtrust Inc
- 12.1.5.1. Company Overview
- 12.1.5.2. Products
- 12.1.5.3. Company Financials
- 12.1.5.4. SWOT Analysis
- 12.1.6 JP Morgan Chase
- 12.1.6.1. Company Overview
- 12.1.6.2. Products
- 12.1.6.3. Company Financials
- 12.1.6.4. SWOT Analysis
- 12.1.7 American Express
- 12.1.7.1. Company Overview
- 12.1.7.2. Products
- 12.1.7.3. Company Financials
- 12.1.7.4. SWOT Analysis
- 12.1.8 Skrill
- 12.1.8.1. Company Overview
- 12.1.8.2. Products
- 12.1.8.3. Company Financials
- 12.1.8.4. SWOT Analysis
- 12.1.9 VISA
- 12.1.9.1. Company Overview
- 12.1.9.2. Products
- 12.1.9.3. Company Financials
- 12.1.9.4. SWOT Analysis
- 12.1.10 Vanguard
- 12.1.10.1. Company Overview
- 12.1.10.2. Products
- 12.1.10.3. Company Financials
- 12.1.10.4. SWOT Analysis
- 12.1.1 Abine Inc
- 12.2. Market Entropy
- 12.2.1 Company's Key Areas Served
- 12.2.2 Recent Developments
- 12.3. Company Market Share Analysis 2025
- 12.3.1 Top 5 Companies Market Share Analysis
- 12.3.2 Top 3 Companies Market Share Analysis
- 12.4. List of Potential Customers
- 13. Research Methodology
List of Figures
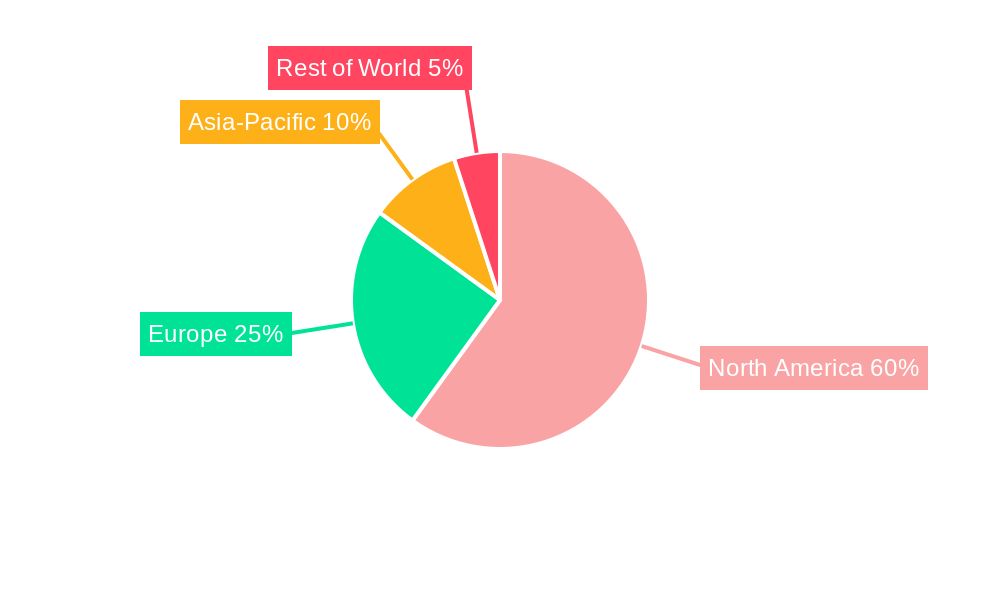
- Figure 1: Global US Payment Cards Market Revenue Breakdown (billion, %) by Region 2025 & 2033
- Figure 2: North America US Payment Cards Market Revenue (billion), by Product Type 2025 & 2033
- Figure 3: North America US Payment Cards Market Revenue Share (%), by Product Type 2025 & 2033
- Figure 4: North America US Payment Cards Market Revenue (billion), by End-User 2025 & 2033
- Figure 5: North America US Payment Cards Market Revenue Share (%), by End-User 2025 & 2033
- Figure 6: North America US Payment Cards Market Revenue (billion), by Country 2025 & 2033
- Figure 7: North America US Payment Cards Market Revenue Share (%), by Country 2025 & 2033
- Figure 8: South America US Payment Cards Market Revenue (billion), by Product Type 2025 & 2033
- Figure 9: South America US Payment Cards Market Revenue Share (%), by Product Type 2025 & 2033
- Figure 10: South America US Payment Cards Market Revenue (billion), by End-User 2025 & 2033
- Figure 11: South America US Payment Cards Market Revenue Share (%), by End-User 2025 & 2033
- Figure 12: South America US Payment Cards Market Revenue (billion), by Country 2025 & 2033
- Figure 13: South America US Payment Cards Market Revenue Share (%), by Country 2025 & 2033
- Figure 14: Europe US Payment Cards Market Revenue (billion), by Product Type 2025 & 2033
- Figure 15: Europe US Payment Cards Market Revenue Share (%), by Product Type 2025 & 2033
- Figure 16: Europe US Payment Cards Market Revenue (billion), by End-User 2025 & 2033
- Figure 17: Europe US Payment Cards Market Revenue Share (%), by End-User 2025 & 2033
- Figure 18: Europe US Payment Cards Market Revenue (billion), by Country 2025 & 2033
- Figure 19: Europe US Payment Cards Market Revenue Share (%), by Country 2025 & 2033
- Figure 20: Middle East & Africa US Payment Cards Market Revenue (billion), by Product Type 2025 & 2033
- Figure 21: Middle East & Africa US Payment Cards Market Revenue Share (%), by Product Type 2025 & 2033
- Figure 22: Middle East & Africa US Payment Cards Market Revenue (billion), by End-User 2025 & 2033
- Figure 23: Middle East & Africa US Payment Cards Market Revenue Share (%), by End-User 2025 & 2033
- Figure 24: Middle East & Africa US Payment Cards Market Revenue (billion), by Country 2025 & 2033
- Figure 25: Middle East & Africa US Payment Cards Market Revenue Share (%), by Country 2025 & 2033
- Figure 26: Asia Pacific US Payment Cards Market Revenue (billion), by Product Type 2025 & 2033
- Figure 27: Asia Pacific US Payment Cards Market Revenue Share (%), by Product Type 2025 & 2033
- Figure 28: Asia Pacific US Payment Cards Market Revenue (billion), by End-User 2025 & 2033
- Figure 29: Asia Pacific US Payment Cards Market Revenue Share (%), by End-User 2025 & 2033
- Figure 30: Asia Pacific US Payment Cards Market Revenue (billion), by Country 2025 & 2033
- Figure 31: Asia Pacific US Payment Cards Market Revenue Share (%), by Country 2025 & 2033
List of Tables
- Table 1: Global US Payment Cards Market Revenue billion Forecast, by Product Type 2020 & 2033
- Table 2: Global US Payment Cards Market Revenue billion Forecast, by End-User 2020 & 2033
- Table 3: Global US Payment Cards Market Revenue billion Forecast, by Region 2020 & 2033
- Table 4: Global US Payment Cards Market Revenue billion Forecast, by Product Type 2020 & 2033
- Table 5: Global US Payment Cards Market Revenue billion Forecast, by End-User 2020 & 2033
- Table 6: Global US Payment Cards Market Revenue billion Forecast, by Country 2020 & 2033
- Table 7: United States US Payment Cards Market Revenue (billion) Forecast, by Application 2020 & 2033
- Table 8: Canada US Payment Cards Market Revenue (billion) Forecast, by Application 2020 & 2033
- Table 9: Mexico US Payment Cards Market Revenue (billion) Forecast, by Application 2020 & 2033
- Table 10: Global US Payment Cards Market Revenue billion Forecast, by Product Type 2020 & 2033
- Table 11: Global US Payment Cards Market Revenue billion Forecast, by End-User 2020 & 2033
- Table 12: Global US Payment Cards Market Revenue billion Forecast, by Country 2020 & 2033
- Table 13: Brazil US Payment Cards Market Revenue (billion) Forecast, by Application 2020 & 2033
- Table 14: Argentina US Payment Cards Market Revenue (billion) Forecast, by Application 2020 & 2033
- Table 15: Rest of South America US Payment Cards Market Revenue (billion) Forecast, by Application 2020 & 2033
- Table 16: Global US Payment Cards Market Revenue billion Forecast, by Product Type 2020 & 2033
- Table 17: Global US Payment Cards Market Revenue billion Forecast, by End-User 2020 & 2033
- Table 18: Global US Payment Cards Market Revenue billion Forecast, by Country 2020 & 2033
- Table 19: United Kingdom US Payment Cards Market Revenue (billion) Forecast, by Application 2020 & 2033
- Table 20: Germany US Payment Cards Market Revenue (billion) Forecast, by Application 2020 & 2033
- Table 21: France US Payment Cards Market Revenue (billion) Forecast, by Application 2020 & 2033
- Table 22: Italy US Payment Cards Market Revenue (billion) Forecast, by Application 2020 & 2033
- Table 23: Spain US Payment Cards Market Revenue (billion) Forecast, by Application 2020 & 2033
- Table 24: Russia US Payment Cards Market Revenue (billion) Forecast, by Application 2020 & 2033
- Table 25: Benelux US Payment Cards Market Revenue (billion) Forecast, by Application 2020 & 2033
- Table 26: Nordics US Payment Cards Market Revenue (billion) Forecast, by Application 2020 & 2033
- Table 27: Rest of Europe US Payment Cards Market Revenue (billion) Forecast, by Application 2020 & 2033
- Table 28: Global US Payment Cards Market Revenue billion Forecast, by Product Type 2020 & 2033
- Table 29: Global US Payment Cards Market Revenue billion Forecast, by End-User 2020 & 2033
- Table 30: Global US Payment Cards Market Revenue billion Forecast, by Country 2020 & 2033
- Table 31: Turkey US Payment Cards Market Revenue (billion) Forecast, by Application 2020 & 2033
- Table 32: Israel US Payment Cards Market Revenue (billion) Forecast, by Application 2020 & 2033
- Table 33: GCC US Payment Cards Market Revenue (billion) Forecast, by Application 2020 & 2033
- Table 34: North Africa US Payment Cards Market Revenue (billion) Forecast, by Application 2020 & 2033
- Table 35: South Africa US Payment Cards Market Revenue (billion) Forecast, by Application 2020 & 2033
- Table 36: Rest of Middle East & Africa US Payment Cards Market Revenue (billion) Forecast, by Application 2020 & 2033
- Table 37: Global US Payment Cards Market Revenue billion Forecast, by Product Type 2020 & 2033
- Table 38: Global US Payment Cards Market Revenue billion Forecast, by End-User 2020 & 2033
- Table 39: Global US Payment Cards Market Revenue billion Forecast, by Country 2020 & 2033
- Table 40: China US Payment Cards Market Revenue (billion) Forecast, by Application 2020 & 2033
- Table 41: India US Payment Cards Market Revenue (billion) Forecast, by Application 2020 & 2033
- Table 42: Japan US Payment Cards Market Revenue (billion) Forecast, by Application 2020 & 2033
- Table 43: South Korea US Payment Cards Market Revenue (billion) Forecast, by Application 2020 & 2033
- Table 44: ASEAN US Payment Cards Market Revenue (billion) Forecast, by Application 2020 & 2033
- Table 45: Oceania US Payment Cards Market Revenue (billion) Forecast, by Application 2020 & 2033
- Table 46: Rest of Asia Pacific US Payment Cards Market Revenue (billion) Forecast, by Application 2020 & 2033
Frequently Asked Questions
1. What is the projected Compound Annual Growth Rate (CAGR) of the US Payment Cards Market?
The projected CAGR is approximately 16.13%.
2. Which companies are prominent players in the US Payment Cards Market?
Key companies in the market include Abine Inc, Stripe, Qonto, WEX Inc **List Not Exhaustive, Billtrust Inc, JP Morgan Chase, American Express, Skrill, VISA, Vanguard.
3. What are the main segments of the US Payment Cards Market?
The market segments include Product Type, End-User.
4. Can you provide details about the market size?
The market size is estimated to be USD 6.48 billion as of 2022.
5. What are some drivers contributing to market growth?
Usage of Credit Card give the bonus and reward points.
6. What are the notable trends driving market growth?
Increase in the Penetration of Internet in the USA.
7. Are there any restraints impacting market growth?
Interest rates on Credit Card.
8. Can you provide examples of recent developments in the market?
On June 2022, Global digital payments firm Visa and Safaricom, the operator of the M-Pesa mobile money product, have today launched a virtual card, enabling millions of M-Pesa users to make digital payments globally including the US region. The virtual card will enable 30 million M-Pesa users to make cashless payments at Visa's global network of merchants. Users can activate the virtual card through the M-Pesa mobile app or by USSD.
9. What pricing options are available for accessing the report?
Pricing options include single-user, multi-user, and enterprise licenses priced at USD 3800, USD 4500, and USD 5800 respectively.
10. Is the market size provided in terms of value or volume?
The market size is provided in terms of value, measured in billion.
11. Are there any specific market keywords associated with the report?
Yes, the market keyword associated with the report is "US Payment Cards Market," which aids in identifying and referencing the specific market segment covered.
12. How do I determine which pricing option suits my needs best?
The pricing options vary based on user requirements and access needs. Individual users may opt for single-user licenses, while businesses requiring broader access may choose multi-user or enterprise licenses for cost-effective access to the report.
13. Are there any additional resources or data provided in the US Payment Cards Market report?
While the report offers comprehensive insights, it's advisable to review the specific contents or supplementary materials provided to ascertain if additional resources or data are available.
14. How can I stay updated on further developments or reports in the US Payment Cards Market?
To stay informed about further developments, trends, and reports in the US Payment Cards Market, consider subscribing to industry newsletters, following relevant companies and organizations, or regularly checking reputable industry news sources and publications.
Methodology
Step 1 - Identification of Relevant Samples Size from Population Database


Step 2 - Approaches for Defining Global Market Size (Value, Volume* & Price*)

Note*: In applicable scenarios
Step 3 - Data Sources
Primary Research
- Web Analytics
- Survey Reports
- Research Institute
- Latest Research Reports
- Opinion Leaders
Secondary Research
- Annual Reports
- White Paper
- Latest Press Release
- Industry Association
- Paid Database
- Investor Presentations

Step 4 - Data Triangulation
Involves using different sources of information in order to increase the validity of a study
These sources are likely to be stakeholders in a program - participants, other researchers, program staff, other community members, and so on.
Then we put all data in single framework & apply various statistical tools to find out the dynamic on the market.
During the analysis stage, feedback from the stakeholder groups would be compared to determine areas of agreement as well as areas of divergence