

Key Insights
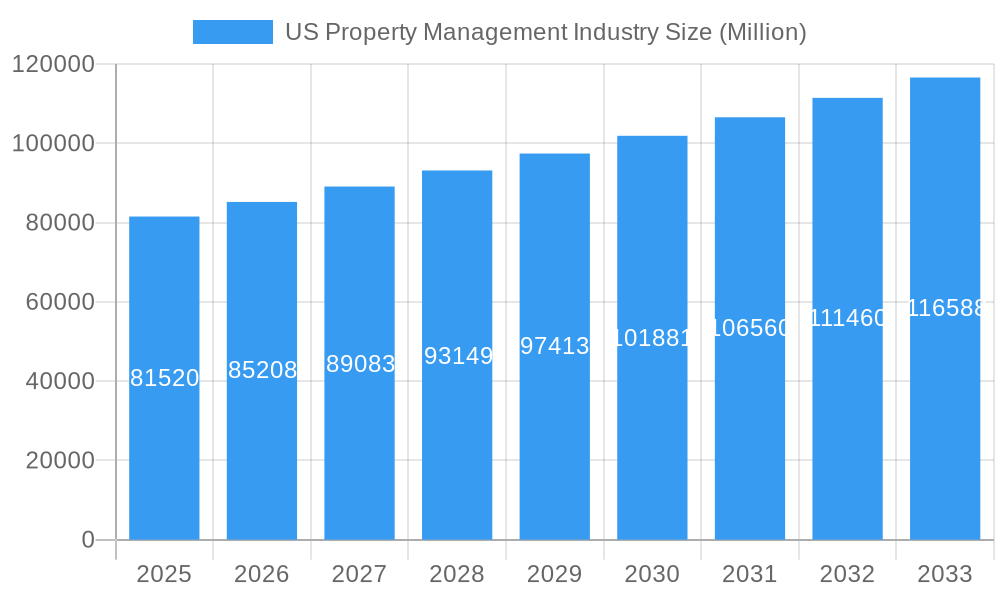
The US property management industry, currently valued at $81.52 billion (2025), is projected to experience robust growth, driven by several key factors. The increasing urbanization and population growth in major US cities fuel demand for rental properties, particularly in high-density urban centers. Simultaneously, the expanding commercial real estate sector, encompassing office spaces, retail properties, and industrial facilities, necessitates professional property management services. Technological advancements, such as property management software and online tenant portals, are streamlining operations and enhancing efficiency, further stimulating market expansion. Furthermore, the rise of institutional investors in the real estate market contributes to the increased need for specialized property management expertise. While economic fluctuations can present challenges, the long-term outlook for the industry remains positive, underpinned by sustained demand for rental housing and commercial spaces across various regions.
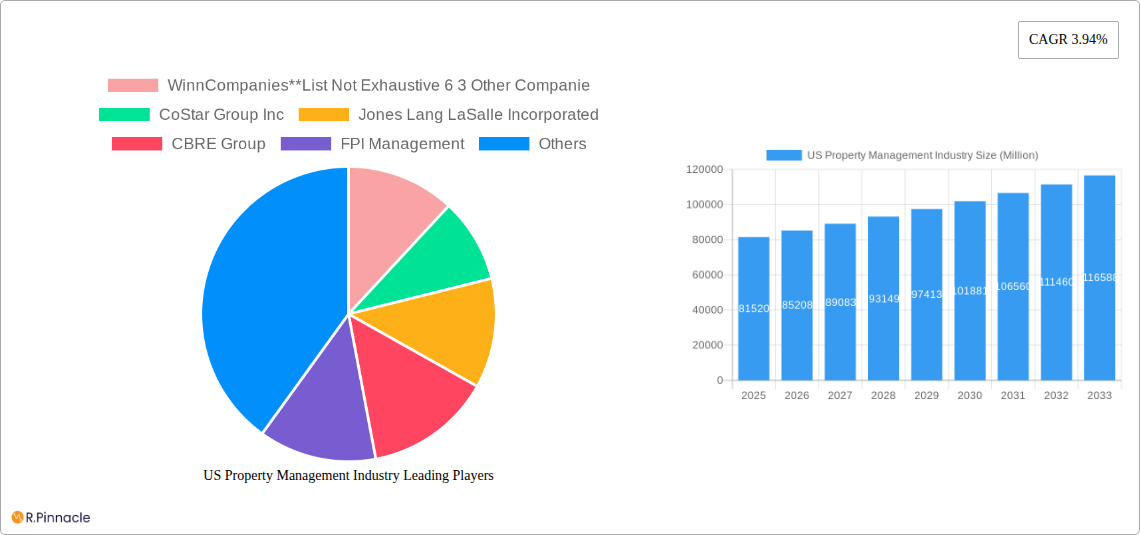
US Property Management Industry Market Size (In Billion)
Segment-wise, the residential sector remains dominant, fueled by a growing renter population and increasing demand for managed apartments and condos. However, the commercial segment is witnessing significant growth driven by the expansion of businesses and the increasing complexity of managing large-scale commercial properties. Within services, property evaluation and tenant services are rapidly evolving, with a growing emphasis on data-driven decision-making and enhanced customer experience. Maintenance services continue to be a critical component, influenced by the need to maintain property value and tenant satisfaction. The geographic distribution sees strong performance across all regions, with the Northeast and West potentially exhibiting slightly faster growth due to their concentration of major metropolitan areas with high property values and rental demand. Competition is intense, with established players like CBRE Group, Jones Lang LaSalle, and CoStar Group vying for market share alongside regional and specialized firms. The industry's continued growth will depend on effectively adapting to evolving technological trends, meeting evolving tenant expectations, and navigating potential economic shifts.
US Property Management Industry Company Market Share
US Property Management Industry Report: 2019-2033
This comprehensive report provides an in-depth analysis of the US Property Management industry, offering valuable insights for industry professionals, investors, and stakeholders. Covering the period 2019-2033, with a focus on 2025, this report reveals market trends, growth drivers, competitive landscapes, and future opportunities within this dynamic sector. The $xx Million market is poised for significant growth, presenting both challenges and exciting potential.
US Property Management Industry Market Structure & Innovation Trends
The US property management industry is characterized by a mix of large, publicly traded companies and smaller, regional firms. Market concentration is moderate, with a few dominant players controlling significant market share. For instance, Greystar Real Estate Partners holds a leading position, further solidified by its recent acquisition of Wood Partners' property management arm. Other key players include CBRE Group, Jones Lang LaSalle Incorporated, and Equity Residential, each commanding substantial market segments. However, numerous smaller firms contribute to a fragmented landscape. The industry is driven by innovation in property technology (PropTech), including smart building technologies, data analytics for predictive maintenance, and online tenant portals. Regulatory frameworks, particularly concerning fair housing and tenant rights, significantly influence operations. Product substitutes, such as individual property owners managing their own properties, represent a niche but persistent competitive force. The market is witnessing increased M&A activity, exemplified by RealPage Inc.'s USD 250 Million acquisition of On-site Managers Inc. in November 2023. This reflects the consolidation trend and the pursuit of technological synergies.
- Market Leaders: Greystar, CBRE Group, Jones Lang LaSalle, Equity Residential
- Key Innovation Drivers: PropTech, Data Analytics, Smart Building Technologies
- M&A Activity: USD 250 Million RealPage acquisition of On-site Managers Inc. (November 2023), Wood Partners sale to Greystar (February 2024) - signifying increasing consolidation.
- Estimated 2025 Market Size: $xx Million
US Property Management Industry Market Dynamics & Trends
The US property management market exhibits robust growth, driven primarily by urbanization, population growth, and the increasing demand for rental housing. The market is experiencing a significant technological disruption, with PropTech solutions transforming operations and enhancing tenant experiences. Consumer preferences are shifting towards convenience, transparency, and technology-driven services. Competition is fierce, with companies vying for market share through innovation, service differentiation, and strategic acquisitions. The Compound Annual Growth Rate (CAGR) for the forecast period (2025-2033) is estimated at xx%, driven by sustained demand, technological advancements, and increasing urbanization. Market penetration of PropTech solutions is expected to reach xx% by 2033, significantly impacting operational efficiency and customer engagement.
Dominant Regions & Segments in US Property Management Industry
The US property management industry is geographically diverse, with significant activity in major metropolitan areas across the country. However, the Sun Belt region consistently demonstrates robust growth, driven by population migration and economic expansion. Within segments, the Residential sector dominates in terms of revenue and transaction volume, fueled by increasing rental demand and limited homeownership affordability in certain areas. Within services, Property Evaluation and Tenant Services are experiencing notable growth driven by increasing demand for professional expertise and enhanced customer experiences. Maintenance services continue to be a core function, while marketing services are becoming increasingly sophisticated and technology-driven.
- Key Drivers for Residential Dominance: Population growth, urbanization, affordability challenges in homeownership.
- Key Drivers for Sun Belt Growth: Population migration, economic expansion, favorable climate.
- High-Growth Service Segments: Property Evaluation, Tenant Services, Marketing
US Property Management Industry Product Innovations
Technological advancements are revolutionizing the property management industry. Smart home technology, integrated platforms for tenant communication and maintenance requests, and data analytics for optimizing operations are transforming how properties are managed. These innovations enhance efficiency, improve tenant satisfaction, and offer competitive advantages to firms that effectively integrate them. The market increasingly favors companies that leverage data-driven insights to optimize pricing, predict maintenance needs, and personalize tenant experiences.
Report Scope & Segmentation Analysis
This report segments the US property management market by end-user (Commercial and Residential) and service type (Marketing, Property Evaluation, Tenant Services, Maintenance, and Other Services). Each segment is analyzed in terms of market size, growth projections, and competitive dynamics. The Residential segment is the largest, exhibiting consistent growth, while Commercial is expected to grow steadily, driven by factors like the expansion of office and retail spaces. In the service segment, Tenant Services and Maintenance show continued growth driven by high demand and technological integration.
Key Drivers of US Property Management Industry Growth
Several factors fuel the growth of the US property management industry: increasing urbanization and population density, the rising demand for rental housing, technological advancements in PropTech, and favorable economic conditions in many regions. Government policies supporting affordable housing initiatives also play a crucial role, while regulatory frameworks ensure fair practices.
Challenges in the US Property Management Industry Sector
The industry faces challenges including fluctuating interest rates, potential economic downturns that impact rental demand, and rising operating costs. Supply chain disruptions can affect maintenance and repair operations, while intense competition necessitates continuous innovation and service improvements to maintain a competitive edge. Regulatory compliance also presents ongoing challenges.
Emerging Opportunities in US Property Management Industry
Emerging opportunities include expanding into niche markets such as senior living or student housing. The adoption of advanced technologies like AI and machine learning for predictive maintenance and tenant engagement presents substantial growth potential. Focusing on sustainable property management practices and meeting growing environmental concerns also offers competitive advantages and access to new revenue streams.
Leading Players in the US Property Management Industry Market
- WinnCompanies
- List Not Exhaustive 6 3 Other Companies
- CoStar Group Inc
- Jones Lang LaSalle Incorporated
- CBRE Group
- FPI Management
- Equity Residential
- Greystar Real Estate Partners
- Pinnacle Property Management
- AvalonBay Communities
- Lincoln Property Company
Key Developments in US Property Management Industry
- February 2024: Wood Partners sold its property management business (38,000+ units) to Greystar, significantly increasing Greystar's market share.
- November 2023: RealPage Inc. acquired On-site Managers Inc. for USD 250 Million, strengthening its position in the PropTech space.
Future Outlook for US Property Management Industry Market
The US property management industry is poised for continued growth, driven by long-term trends like urbanization and technological innovation. Strategic investments in PropTech, a focus on sustainability, and expansion into emerging market segments will be key factors for success in the years to come. The industry will continue to see consolidation as larger firms acquire smaller players, leading to a more concentrated market.
US Property Management Industry Segmentation
-
1. End User
- 1.1. Commercial
- 1.2. Residential
-
2. Service
- 2.1. Marketing
- 2.2. Property Evaluation
- 2.3. Tenant Services
- 2.4. Maintenance
- 2.5. Other Services
US Property Management Industry Segmentation By Geography
-
1. North America
- 1.1. United States
- 1.2. Canada
- 1.3. Mexico
-
2. South America
- 2.1. Brazil
- 2.2. Argentina
- 2.3. Rest of South America
-
3. Europe
- 3.1. United Kingdom
- 3.2. Germany
- 3.3. France
- 3.4. Italy
- 3.5. Spain
- 3.6. Russia
- 3.7. Benelux
- 3.8. Nordics
- 3.9. Rest of Europe
-
4. Middle East & Africa
- 4.1. Turkey
- 4.2. Israel
- 4.3. GCC
- 4.4. North Africa
- 4.5. South Africa
- 4.6. Rest of Middle East & Africa
-
5. Asia Pacific
- 5.1. China
- 5.2. India
- 5.3. Japan
- 5.4. South Korea
- 5.5. ASEAN
- 5.6. Oceania
- 5.7. Rest of Asia Pacific
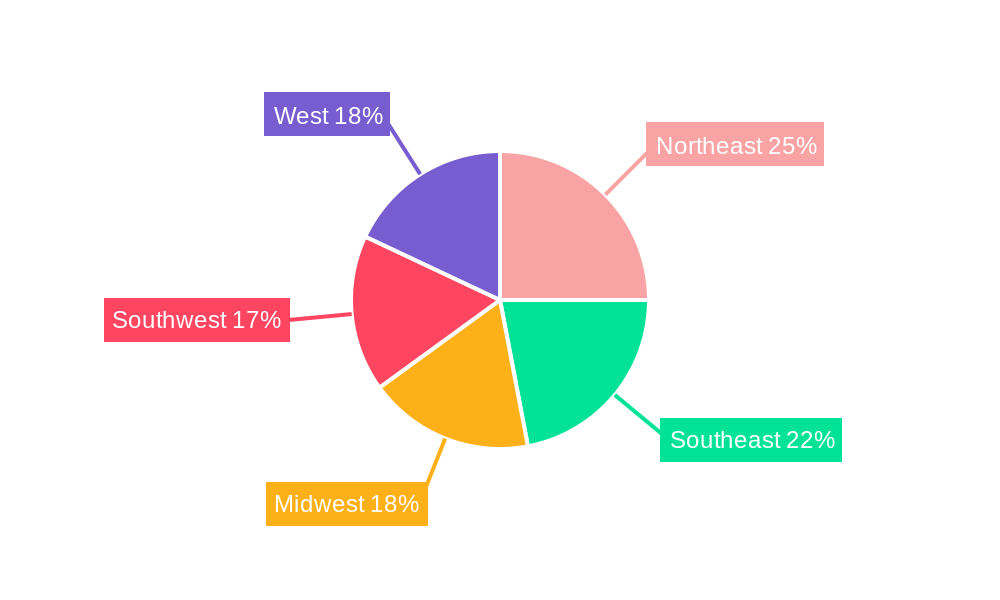
US Property Management Industry Regional Market Share
Geographic Coverage of US Property Management Industry
US Property Management Industry REPORT HIGHLIGHTS
| Aspects | Details |
|---|---|
| Study Period | 2020-2034 |
| Base Year | 2025 |
| Estimated Year | 2026 |
| Forecast Period | 2026-2034 |
| Historical Period | 2020-2025 |
| Growth Rate | CAGR of 3.94% from 2020-2034 |
| Segmentation |
|
Table of Contents
- 1. Introduction
- 1.1. Research Scope
- 1.2. Market Segmentation
- 1.3. Research Objective
- 1.4. Definitions and Assumptions
- 2. Executive Summary
- 2.1. Market Snapshot
- 3. Market Dynamics
- 3.1. Market Drivers
- 3.2. Market Restrains
- 3.3. Market Trends
- 3.4. Market Opportunities
- 4. Market Factor Analysis
- 4.1. Porters Five Forces
- 4.1.1. Bargaining Power of Suppliers
- 4.1.2. Bargaining Power of Buyers
- 4.1.3. Threat of New Entrants
- 4.1.4. Threat of Substitutes
- 4.1.5. Competitive Rivalry
- 4.2. PESTEL analysis
- 4.3. BCG Analysis
- 4.3.1. Stars (High Growth, High Market Share)
- 4.3.2. Cash Cows (Low Growth, High Market Share)
- 4.3.3. Question Mark (High Growth, Low Market Share)
- 4.3.4. Dogs (Low Growth, Low Market Share)
- 4.4. Ansoff Matrix Analysis
- 4.5. Supply Chain Analysis
- 4.6. Regulatory Landscape
- 4.7. Current Market Potential and Opportunity Assessment (TAM–SAM–SOM Framework)
- 4.8. PRI Analyst Note
- 4.1. Porters Five Forces
- 5. Market Analysis, Insights and Forecast 2021-2033
- 5.1. Market Analysis, Insights and Forecast - by End User
- 5.1.1. Commercial
- 5.1.2. Residential
- 5.2. Market Analysis, Insights and Forecast - by Service
- 5.2.1. Marketing
- 5.2.2. Property Evaluation
- 5.2.3. Tenant Services
- 5.2.4. Maintenance
- 5.2.5. Other Services
- 5.3. Market Analysis, Insights and Forecast - by Region
- 5.3.1. North America
- 5.3.2. South America
- 5.3.3. Europe
- 5.3.4. Middle East & Africa
- 5.3.5. Asia Pacific
- 5.1. Market Analysis, Insights and Forecast - by End User
- 6. Global US Property Management Industry Analysis, Insights and Forecast, 2021-2033
- 6.1. Market Analysis, Insights and Forecast - by End User
- 6.1.1. Commercial
- 6.1.2. Residential
- 6.2. Market Analysis, Insights and Forecast - by Service
- 6.2.1. Marketing
- 6.2.2. Property Evaluation
- 6.2.3. Tenant Services
- 6.2.4. Maintenance
- 6.2.5. Other Services
- 6.1. Market Analysis, Insights and Forecast - by End User
- 7. North America US Property Management Industry Analysis, Insights and Forecast, 2020-2032
- 7.1. Market Analysis, Insights and Forecast - by End User
- 7.1.1. Commercial
- 7.1.2. Residential
- 7.2. Market Analysis, Insights and Forecast - by Service
- 7.2.1. Marketing
- 7.2.2. Property Evaluation
- 7.2.3. Tenant Services
- 7.2.4. Maintenance
- 7.2.5. Other Services
- 7.1. Market Analysis, Insights and Forecast - by End User
- 8. South America US Property Management Industry Analysis, Insights and Forecast, 2020-2032
- 8.1. Market Analysis, Insights and Forecast - by End User
- 8.1.1. Commercial
- 8.1.2. Residential
- 8.2. Market Analysis, Insights and Forecast - by Service
- 8.2.1. Marketing
- 8.2.2. Property Evaluation
- 8.2.3. Tenant Services
- 8.2.4. Maintenance
- 8.2.5. Other Services
- 8.1. Market Analysis, Insights and Forecast - by End User
- 9. Europe US Property Management Industry Analysis, Insights and Forecast, 2020-2032
- 9.1. Market Analysis, Insights and Forecast - by End User
- 9.1.1. Commercial
- 9.1.2. Residential
- 9.2. Market Analysis, Insights and Forecast - by Service
- 9.2.1. Marketing
- 9.2.2. Property Evaluation
- 9.2.3. Tenant Services
- 9.2.4. Maintenance
- 9.2.5. Other Services
- 9.1. Market Analysis, Insights and Forecast - by End User
- 10. Middle East & Africa US Property Management Industry Analysis, Insights and Forecast, 2020-2032
- 10.1. Market Analysis, Insights and Forecast - by End User
- 10.1.1. Commercial
- 10.1.2. Residential
- 10.2. Market Analysis, Insights and Forecast - by Service
- 10.2.1. Marketing
- 10.2.2. Property Evaluation
- 10.2.3. Tenant Services
- 10.2.4. Maintenance
- 10.2.5. Other Services
- 10.1. Market Analysis, Insights and Forecast - by End User
- 11. Asia Pacific US Property Management Industry Analysis, Insights and Forecast, 2020-2032
- 11.1. Market Analysis, Insights and Forecast - by End User
- 11.1.1. Commercial
- 11.1.2. Residential
- 11.2. Market Analysis, Insights and Forecast - by Service
- 11.2.1. Marketing
- 11.2.2. Property Evaluation
- 11.2.3. Tenant Services
- 11.2.4. Maintenance
- 11.2.5. Other Services
- 11.1. Market Analysis, Insights and Forecast - by End User
- 12. Competitive Analysis
- 12.1. Company Profiles
- 12.1.1 WinnCompanies**List Not Exhaustive 6 3 Other Companie
- 12.1.1.1. Company Overview
- 12.1.1.2. Products
- 12.1.1.3. Company Financials
- 12.1.1.4. SWOT Analysis
- 12.1.2 CoStar Group Inc
- 12.1.2.1. Company Overview
- 12.1.2.2. Products
- 12.1.2.3. Company Financials
- 12.1.2.4. SWOT Analysis
- 12.1.3 Jones Lang LaSalle Incorporated
- 12.1.3.1. Company Overview
- 12.1.3.2. Products
- 12.1.3.3. Company Financials
- 12.1.3.4. SWOT Analysis
- 12.1.4 CBRE Group
- 12.1.4.1. Company Overview
- 12.1.4.2. Products
- 12.1.4.3. Company Financials
- 12.1.4.4. SWOT Analysis
- 12.1.5 FPI Management
- 12.1.5.1. Company Overview
- 12.1.5.2. Products
- 12.1.5.3. Company Financials
- 12.1.5.4. SWOT Analysis
- 12.1.6 Equity Residential
- 12.1.6.1. Company Overview
- 12.1.6.2. Products
- 12.1.6.3. Company Financials
- 12.1.6.4. SWOT Analysis
- 12.1.7 Greystar Real Estate Partners
- 12.1.7.1. Company Overview
- 12.1.7.2. Products
- 12.1.7.3. Company Financials
- 12.1.7.4. SWOT Analysis
- 12.1.8 Pinnacle Property Management
- 12.1.8.1. Company Overview
- 12.1.8.2. Products
- 12.1.8.3. Company Financials
- 12.1.8.4. SWOT Analysis
- 12.1.9 AvalonBay Communities
- 12.1.9.1. Company Overview
- 12.1.9.2. Products
- 12.1.9.3. Company Financials
- 12.1.9.4. SWOT Analysis
- 12.1.10 Lincoln Property Company
- 12.1.10.1. Company Overview
- 12.1.10.2. Products
- 12.1.10.3. Company Financials
- 12.1.10.4. SWOT Analysis
- 12.1.1 WinnCompanies**List Not Exhaustive 6 3 Other Companie
- 12.2. Market Entropy
- 12.2.1 Company's Key Areas Served
- 12.2.2 Recent Developments
- 12.3. Company Market Share Analysis 2025
- 12.3.1 Top 5 Companies Market Share Analysis
- 12.3.2 Top 3 Companies Market Share Analysis
- 12.4. List of Potential Customers
- 13. Research Methodology
List of Figures
- Figure 1: Global US Property Management Industry Revenue Breakdown (Million, %) by Region 2025 & 2033
- Figure 2: North America US Property Management Industry Revenue (Million), by End User 2025 & 2033
- Figure 3: North America US Property Management Industry Revenue Share (%), by End User 2025 & 2033
- Figure 4: North America US Property Management Industry Revenue (Million), by Service 2025 & 2033
- Figure 5: North America US Property Management Industry Revenue Share (%), by Service 2025 & 2033
- Figure 6: North America US Property Management Industry Revenue (Million), by Country 2025 & 2033
- Figure 7: North America US Property Management Industry Revenue Share (%), by Country 2025 & 2033
- Figure 8: South America US Property Management Industry Revenue (Million), by End User 2025 & 2033
- Figure 9: South America US Property Management Industry Revenue Share (%), by End User 2025 & 2033
- Figure 10: South America US Property Management Industry Revenue (Million), by Service 2025 & 2033
- Figure 11: South America US Property Management Industry Revenue Share (%), by Service 2025 & 2033
- Figure 12: South America US Property Management Industry Revenue (Million), by Country 2025 & 2033
- Figure 13: South America US Property Management Industry Revenue Share (%), by Country 2025 & 2033
- Figure 14: Europe US Property Management Industry Revenue (Million), by End User 2025 & 2033
- Figure 15: Europe US Property Management Industry Revenue Share (%), by End User 2025 & 2033
- Figure 16: Europe US Property Management Industry Revenue (Million), by Service 2025 & 2033
- Figure 17: Europe US Property Management Industry Revenue Share (%), by Service 2025 & 2033
- Figure 18: Europe US Property Management Industry Revenue (Million), by Country 2025 & 2033
- Figure 19: Europe US Property Management Industry Revenue Share (%), by Country 2025 & 2033
- Figure 20: Middle East & Africa US Property Management Industry Revenue (Million), by End User 2025 & 2033
- Figure 21: Middle East & Africa US Property Management Industry Revenue Share (%), by End User 2025 & 2033
- Figure 22: Middle East & Africa US Property Management Industry Revenue (Million), by Service 2025 & 2033
- Figure 23: Middle East & Africa US Property Management Industry Revenue Share (%), by Service 2025 & 2033
- Figure 24: Middle East & Africa US Property Management Industry Revenue (Million), by Country 2025 & 2033
- Figure 25: Middle East & Africa US Property Management Industry Revenue Share (%), by Country 2025 & 2033
- Figure 26: Asia Pacific US Property Management Industry Revenue (Million), by End User 2025 & 2033
- Figure 27: Asia Pacific US Property Management Industry Revenue Share (%), by End User 2025 & 2033
- Figure 28: Asia Pacific US Property Management Industry Revenue (Million), by Service 2025 & 2033
- Figure 29: Asia Pacific US Property Management Industry Revenue Share (%), by Service 2025 & 2033
- Figure 30: Asia Pacific US Property Management Industry Revenue (Million), by Country 2025 & 2033
- Figure 31: Asia Pacific US Property Management Industry Revenue Share (%), by Country 2025 & 2033
List of Tables
- Table 1: Global US Property Management Industry Revenue Million Forecast, by End User 2020 & 2033
- Table 2: Global US Property Management Industry Revenue Million Forecast, by Service 2020 & 2033
- Table 3: Global US Property Management Industry Revenue Million Forecast, by Region 2020 & 2033
- Table 4: Global US Property Management Industry Revenue Million Forecast, by End User 2020 & 2033
- Table 5: Global US Property Management Industry Revenue Million Forecast, by Service 2020 & 2033
- Table 6: Global US Property Management Industry Revenue Million Forecast, by Country 2020 & 2033
- Table 7: United States US Property Management Industry Revenue (Million) Forecast, by Application 2020 & 2033
- Table 8: Canada US Property Management Industry Revenue (Million) Forecast, by Application 2020 & 2033
- Table 9: Mexico US Property Management Industry Revenue (Million) Forecast, by Application 2020 & 2033
- Table 10: Global US Property Management Industry Revenue Million Forecast, by End User 2020 & 2033
- Table 11: Global US Property Management Industry Revenue Million Forecast, by Service 2020 & 2033
- Table 12: Global US Property Management Industry Revenue Million Forecast, by Country 2020 & 2033
- Table 13: Brazil US Property Management Industry Revenue (Million) Forecast, by Application 2020 & 2033
- Table 14: Argentina US Property Management Industry Revenue (Million) Forecast, by Application 2020 & 2033
- Table 15: Rest of South America US Property Management Industry Revenue (Million) Forecast, by Application 2020 & 2033
- Table 16: Global US Property Management Industry Revenue Million Forecast, by End User 2020 & 2033
- Table 17: Global US Property Management Industry Revenue Million Forecast, by Service 2020 & 2033
- Table 18: Global US Property Management Industry Revenue Million Forecast, by Country 2020 & 2033
- Table 19: United Kingdom US Property Management Industry Revenue (Million) Forecast, by Application 2020 & 2033
- Table 20: Germany US Property Management Industry Revenue (Million) Forecast, by Application 2020 & 2033
- Table 21: France US Property Management Industry Revenue (Million) Forecast, by Application 2020 & 2033
- Table 22: Italy US Property Management Industry Revenue (Million) Forecast, by Application 2020 & 2033
- Table 23: Spain US Property Management Industry Revenue (Million) Forecast, by Application 2020 & 2033
- Table 24: Russia US Property Management Industry Revenue (Million) Forecast, by Application 2020 & 2033
- Table 25: Benelux US Property Management Industry Revenue (Million) Forecast, by Application 2020 & 2033
- Table 26: Nordics US Property Management Industry Revenue (Million) Forecast, by Application 2020 & 2033
- Table 27: Rest of Europe US Property Management Industry Revenue (Million) Forecast, by Application 2020 & 2033
- Table 28: Global US Property Management Industry Revenue Million Forecast, by End User 2020 & 2033
- Table 29: Global US Property Management Industry Revenue Million Forecast, by Service 2020 & 2033
- Table 30: Global US Property Management Industry Revenue Million Forecast, by Country 2020 & 2033
- Table 31: Turkey US Property Management Industry Revenue (Million) Forecast, by Application 2020 & 2033
- Table 32: Israel US Property Management Industry Revenue (Million) Forecast, by Application 2020 & 2033
- Table 33: GCC US Property Management Industry Revenue (Million) Forecast, by Application 2020 & 2033
- Table 34: North Africa US Property Management Industry Revenue (Million) Forecast, by Application 2020 & 2033
- Table 35: South Africa US Property Management Industry Revenue (Million) Forecast, by Application 2020 & 2033
- Table 36: Rest of Middle East & Africa US Property Management Industry Revenue (Million) Forecast, by Application 2020 & 2033
- Table 37: Global US Property Management Industry Revenue Million Forecast, by End User 2020 & 2033
- Table 38: Global US Property Management Industry Revenue Million Forecast, by Service 2020 & 2033
- Table 39: Global US Property Management Industry Revenue Million Forecast, by Country 2020 & 2033
- Table 40: China US Property Management Industry Revenue (Million) Forecast, by Application 2020 & 2033
- Table 41: India US Property Management Industry Revenue (Million) Forecast, by Application 2020 & 2033
- Table 42: Japan US Property Management Industry Revenue (Million) Forecast, by Application 2020 & 2033
- Table 43: South Korea US Property Management Industry Revenue (Million) Forecast, by Application 2020 & 2033
- Table 44: ASEAN US Property Management Industry Revenue (Million) Forecast, by Application 2020 & 2033
- Table 45: Oceania US Property Management Industry Revenue (Million) Forecast, by Application 2020 & 2033
- Table 46: Rest of Asia Pacific US Property Management Industry Revenue (Million) Forecast, by Application 2020 & 2033
Frequently Asked Questions
1. What is the projected Compound Annual Growth Rate (CAGR) of the US Property Management Industry?
The projected CAGR is approximately 3.94%.
2. Which companies are prominent players in the US Property Management Industry?
Key companies in the market include WinnCompanies**List Not Exhaustive 6 3 Other Companie, CoStar Group Inc, Jones Lang LaSalle Incorporated, CBRE Group, FPI Management, Equity Residential, Greystar Real Estate Partners, Pinnacle Property Management, AvalonBay Communities, Lincoln Property Company.
3. What are the main segments of the US Property Management Industry?
The market segments include End User, Service.
4. Can you provide details about the market size?
The market size is estimated to be USD 81.52 Million as of 2022.
5. What are some drivers contributing to market growth?
Increasing Demand from the Commercial Segment is Driving the Market; Increasing Disposable Income of Consumers is Driving the market.
6. What are the notable trends driving market growth?
Demand from the Residential Sector is Supporting the Market.
7. Are there any restraints impacting market growth?
Economic Uncertainties are Restraining the Market.
8. Can you provide examples of recent developments in the market?
February 2024: Wood Partners, the 4th-largest real estate developer in the United States, sold its property management business for its 38,000+ units in 17 states to Greystar (Charleston, South Carolina), the country's largest apartment management company.
9. What pricing options are available for accessing the report?
Pricing options include single-user, multi-user, and enterprise licenses priced at USD 3800, USD 4500, and USD 5800 respectively.
10. Is the market size provided in terms of value or volume?
The market size is provided in terms of value, measured in Million.
11. Are there any specific market keywords associated with the report?
Yes, the market keyword associated with the report is "US Property Management Industry," which aids in identifying and referencing the specific market segment covered.
12. How do I determine which pricing option suits my needs best?
The pricing options vary based on user requirements and access needs. Individual users may opt for single-user licenses, while businesses requiring broader access may choose multi-user or enterprise licenses for cost-effective access to the report.
13. Are there any additional resources or data provided in the US Property Management Industry report?
While the report offers comprehensive insights, it's advisable to review the specific contents or supplementary materials provided to ascertain if additional resources or data are available.
14. How can I stay updated on further developments or reports in the US Property Management Industry?
To stay informed about further developments, trends, and reports in the US Property Management Industry, consider subscribing to industry newsletters, following relevant companies and organizations, or regularly checking reputable industry news sources and publications.
Methodology
Step 1 - Identification of Relevant Samples Size from Population Database


Step 2 - Approaches for Defining Global Market Size (Value, Volume* & Price*)

Note*: In applicable scenarios
Step 3 - Data Sources
Primary Research
- Web Analytics
- Survey Reports
- Research Institute
- Latest Research Reports
- Opinion Leaders
Secondary Research
- Annual Reports
- White Paper
- Latest Press Release
- Industry Association
- Paid Database
- Investor Presentations

Step 4 - Data Triangulation
Involves using different sources of information in order to increase the validity of a study
These sources are likely to be stakeholders in a program - participants, other researchers, program staff, other community members, and so on.
Then we put all data in single framework & apply various statistical tools to find out the dynamic on the market.
During the analysis stage, feedback from the stakeholder groups would be compared to determine areas of agreement as well as areas of divergence