

Key Insights
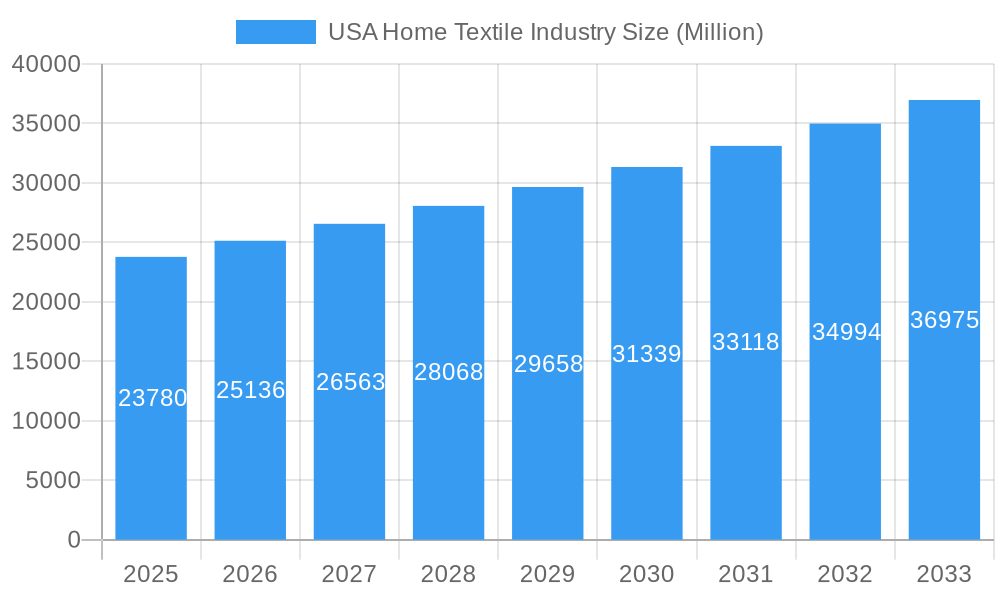
The US home textile market, valued at $23.78 billion in 2025, is projected to experience robust growth, with a Compound Annual Growth Rate (CAGR) of 5.42% from 2025 to 2033. This expansion is driven by several key factors. Firstly, the increasing disposable incomes and a rising preference for home improvement and comfortable living spaces are fueling demand for high-quality home textiles. Secondly, the burgeoning e-commerce sector provides convenient access to a wider variety of products, further stimulating market growth. Furthermore, innovative product designs, incorporating sustainable materials and advanced technologies, are attracting consumers seeking both comfort and eco-friendly options. The market segmentation reveals significant opportunities across various product categories, including bed linen, bath linen, kitchen linen, upholstery, and floor coverings. Online channels are experiencing particularly rapid growth, reflecting changing consumer purchasing behavior. While challenges exist, such as fluctuations in raw material prices and competition from international manufacturers, the overall market outlook remains positive. The regional distribution reveals strong demand across all US regions, with potential for further penetration in underserved areas. The presence of established brands like Welspun USA, Shaw Industries, and Milliken, alongside emerging players, indicates a competitive yet dynamic market landscape.
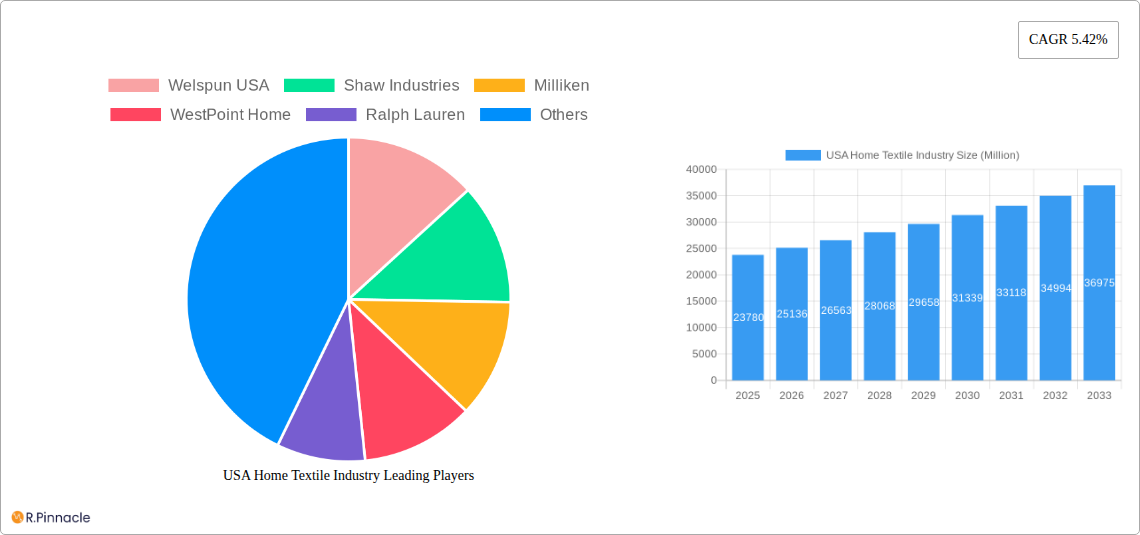
USA Home Textile Industry Market Size (In Billion)
The projected growth in the US home textile market is expected to be driven by continued consumer demand for improved home aesthetics and comfort. Factors such as changing lifestyles, increased urbanization, and a focus on personalized living spaces will all contribute to market expansion. The shift towards online retail will continue, presenting opportunities for brands to optimize their digital presence and target specific consumer segments. The focus on sustainable and eco-friendly products is also likely to increase as consumers become more conscious of environmental impact. This trend will necessitate innovation in material sourcing and manufacturing processes. Growth across all segments – bed linen, bath linen, kitchen textiles, upholstery and floor coverings – is anticipated, although the pace of growth might vary depending on consumer preferences and economic conditions. Strategic partnerships, mergers and acquisitions will continue to shape the competitive landscape, leading to greater consolidation.
USA Home Textile Industry Company Market Share
USA Home Textile Industry Report: 2019-2033 Forecast
This comprehensive report provides an in-depth analysis of the USA home textile industry, covering market size, segmentation, key players, and future growth prospects. With a focus on actionable insights and data-driven forecasts spanning the period 2019-2033 (Base Year: 2025, Forecast Period: 2025-2033), this report is an essential resource for industry professionals, investors, and strategic decision-makers. The report leverages extensive research and incorporates real-world data to deliver a clear, concise, and valuable analysis.
USA Home Textile Industry Market Structure & Innovation Trends
The USA home textile industry is characterized by a moderately concentrated market structure, with several large players holding significant market share. Key players such as Welspun USA, Shaw Industries, Milliken, WestPoint Home, Ralph Lauren, and Standard Textile (list not exhaustive) compete alongside numerous smaller companies and private labels. Market share fluctuates based on product innovation, branding success, and distribution strategies. Innovation is driven by consumer demand for sustainable materials, technologically advanced fabrics, and aesthetically pleasing designs. The regulatory landscape, including labeling requirements and safety standards, shapes product development and manufacturing practices. Product substitutes, such as synthetic alternatives or readily available imports, pose ongoing competitive challenges. End-user demographics, particularly the increasing preference for comfort and convenience, influence product trends. Mergers and acquisitions (M&A) play a significant role in market consolidation, with recent deals such as Mohawk Industries' acquisition of Vitromex demonstrating significant investment in the sector (approximately $293 Million).
- Market Concentration: Moderately concentrated, with several large players dominating.
- M&A Activity: Significant M&A activity, totaling an estimated xx Million in deals over the past 5 years. (The actual value will be inserted during report creation)
- Innovation Drivers: Sustainable materials, technological advancements, and consumer preferences for aesthetic appeal and comfort.
- Regulatory Framework: Compliance with safety and labeling regulations impacts product development.
- Product Substitutes: Competition from synthetic alternatives and imports.
USA Home Textile Industry Market Dynamics & Trends
The USA home textile market is experiencing robust growth, driven by several key factors. Increasing disposable incomes, particularly amongst millennials and Gen Z, fuel demand for higher-quality and aesthetically pleasing home textiles. Technological advancements, such as the development of innovative fabrics with enhanced durability and performance features, are also driving market expansion. Consumer preferences are shifting toward sustainable and ethically sourced products, forcing companies to adapt their supply chains and manufacturing processes. Intense competition leads to pricing pressures and necessitates continuous product innovation to remain competitive. The industry's Compound Annual Growth Rate (CAGR) during the historical period (2019-2024) is estimated at xx%, with a projected CAGR of xx% during the forecast period (2025-2033). Market penetration for online sales continues to increase. Shifting consumer preferences towards eco-friendly options are a notable dynamic.
Dominant Regions & Segments in USA Home Textile Industry
While detailed regional breakdown requires further data analysis, several segments exhibit stronger growth and dominance.
- By Material Type: Bed linen maintains the largest market share, driven by consistently high demand. Upholstery fabrics are also a significant segment, impacted by trends in home furnishings and interior design.
- By Distribution Channel: Online sales are rapidly growing, while traditional channels such as supermarkets, hypermarkets, and specialty stores continue to play a crucial role. The "Others" segment (e.g., direct sales, wholesale distributors) also contributes significantly.
Key drivers for dominance in specific segments include:
- Economic Policies: Government initiatives supporting domestic manufacturing and sustainable practices.
- Infrastructure: Efficient logistics and transportation networks facilitating efficient distribution.
USA Home Textile Industry Product Innovations
The home textile industry is witnessing continuous innovation in materials, designs, and manufacturing processes. Smart textiles with integrated technology (e.g., temperature regulation, moisture-wicking) are gaining traction. Sustainable and eco-friendly materials, such as organic cotton and recycled fibers, are increasingly sought after. Improved manufacturing processes enhance efficiency and reduce waste, improving the overall environmental footprint. These innovations are vital for satisfying evolving consumer preferences and gaining a competitive advantage.
Report Scope & Segmentation Analysis
This report segments the USA home textile market by material type (bed linen, bath linen, kitchen linen, upholstery, floor covering) and distribution channel (supermarkets/hypermarkets, specialty stores, online, others). Each segment's market size, growth projections, and competitive dynamics are analyzed. The report projects significant growth across all segments, with online sales expected to show the most substantial increase over the forecast period.
Key Drivers of USA Home Textile Industry Growth
Growth in the USA home textile industry is propelled by rising disposable incomes, a preference for improved home aesthetics and comfort, the increasing adoption of e-commerce, and the constant influx of new, innovative products. Further, government policies supporting domestic manufacturing and sustainable practices are positively influencing the market.
Challenges in the USA Home Textile Industry Sector
The industry faces challenges including intense competition from low-cost imports, fluctuating raw material prices, supply chain disruptions, and increasingly stringent environmental regulations. These factors can significantly impact production costs and profitability. The rising cost of labor also poses a major concern.
Emerging Opportunities in USA Home Textile Industry
Opportunities arise from the growing demand for sustainable and ethically sourced products, smart textiles, and personalized home furnishings. Expanding into new markets, particularly through online channels, presents substantial growth potential. Focusing on niche segments and offering customized products tailored to specific consumer needs can also unlock opportunities.
Leading Players in the USA Home Textile Industry Market
- Welspun USA
- Shaw Industries
- Milliken
- WestPoint Home
- Ralph Lauren
- Standard Textile
- TJX Companies
- Etro Home Collection
- Mohawk Industries
- Jim Thompson Fabrics
Key Developments in USA Home Textile Industry Industry
- June 2022: Mohawk Industries' acquisition of Vitromex for approximately $293 million expands its presence in the ceramic tile market, impacting the overall home improvement sector.
- December 2022: Milliken & Company's $27.4 million investment in Cherokee County, creating 75 new jobs, showcases continued growth and expansion within the textile manufacturing sector.
Future Outlook for USA Home Textile Industry Market
The future of the USA home textile industry appears promising, with consistent growth driven by evolving consumer preferences, technological advancements, and the increasing focus on sustainable practices. Strategic partnerships, investment in innovation, and effective distribution strategies will be crucial for success in this dynamic market. The market is projected to expand significantly, offering lucrative opportunities for established players and new entrants alike.
USA Home Textile Industry Segmentation
-
1. Material Type
- 1.1. Bed Linen
- 1.2. Bath Linen
- 1.3. Kitchen Linen
- 1.4. Upholstery
- 1.5. Floor Covering
-
2. Distribution Channel
- 2.1. Supermarkets and Hypermarkets
- 2.2. Specialty Stores
- 2.3. Online
- 2.4. Others
USA Home Textile Industry Segmentation By Geography
-
1. North America
- 1.1. United States
- 1.2. Canada
- 1.3. Mexico
-
2. South America
- 2.1. Brazil
- 2.2. Argentina
- 2.3. Rest of South America
-
3. Europe
- 3.1. United Kingdom
- 3.2. Germany
- 3.3. France
- 3.4. Italy
- 3.5. Spain
- 3.6. Russia
- 3.7. Benelux
- 3.8. Nordics
- 3.9. Rest of Europe
-
4. Middle East & Africa
- 4.1. Turkey
- 4.2. Israel
- 4.3. GCC
- 4.4. North Africa
- 4.5. South Africa
- 4.6. Rest of Middle East & Africa
-
5. Asia Pacific
- 5.1. China
- 5.2. India
- 5.3. Japan
- 5.4. South Korea
- 5.5. ASEAN
- 5.6. Oceania
- 5.7. Rest of Asia Pacific
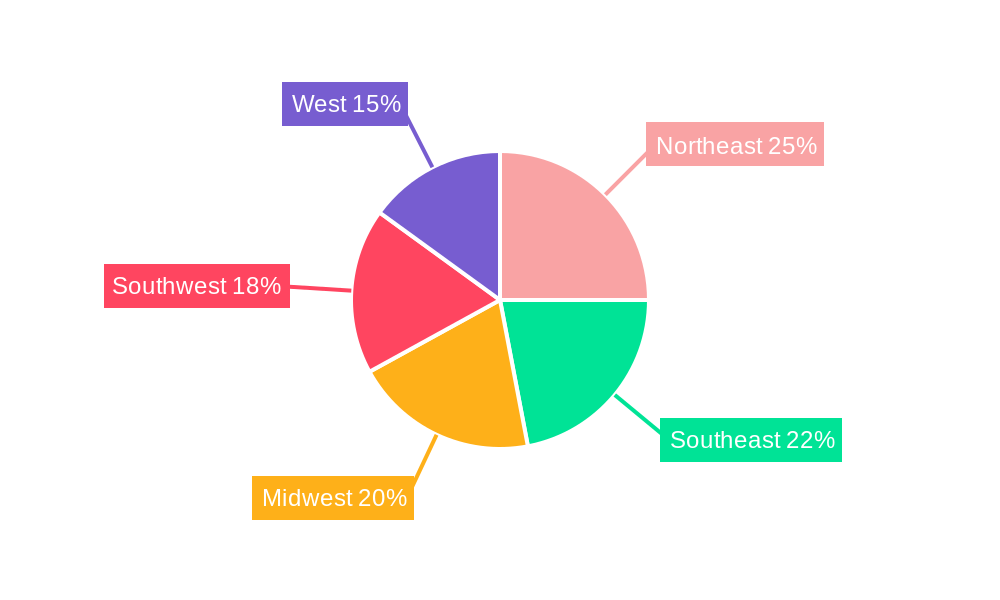
USA Home Textile Industry Regional Market Share
Geographic Coverage of USA Home Textile Industry
USA Home Textile Industry REPORT HIGHLIGHTS
| Aspects | Details |
|---|---|
| Study Period | 2020-2034 |
| Base Year | 2025 |
| Estimated Year | 2026 |
| Forecast Period | 2026-2034 |
| Historical Period | 2020-2025 |
| Growth Rate | CAGR of 5.42% from 2020-2034 |
| Segmentation |
|
Table of Contents
- 1. Introduction
- 1.1. Research Scope
- 1.2. Market Segmentation
- 1.3. Research Objective
- 1.4. Definitions and Assumptions
- 2. Executive Summary
- 2.1. Market Snapshot
- 3. Market Dynamics
- 3.1. Market Drivers
- 3.2. Market Restrains
- 3.3. Market Trends
- 3.4. Market Opportunities
- 4. Market Factor Analysis
- 4.1. Porters Five Forces
- 4.1.1. Bargaining Power of Suppliers
- 4.1.2. Bargaining Power of Buyers
- 4.1.3. Threat of New Entrants
- 4.1.4. Threat of Substitutes
- 4.1.5. Competitive Rivalry
- 4.2. PESTEL analysis
- 4.3. BCG Analysis
- 4.3.1. Stars (High Growth, High Market Share)
- 4.3.2. Cash Cows (Low Growth, High Market Share)
- 4.3.3. Question Mark (High Growth, Low Market Share)
- 4.3.4. Dogs (Low Growth, Low Market Share)
- 4.4. Ansoff Matrix Analysis
- 4.5. Supply Chain Analysis
- 4.6. Regulatory Landscape
- 4.7. Current Market Potential and Opportunity Assessment (TAM–SAM–SOM Framework)
- 4.8. PRI Analyst Note
- 4.1. Porters Five Forces
- 5. Market Analysis, Insights and Forecast 2021-2033
- 5.1. Market Analysis, Insights and Forecast - by Material Type
- 5.1.1. Bed Linen
- 5.1.2. Bath Linen
- 5.1.3. Kitchen Linen
- 5.1.4. Upholstery
- 5.1.5. Floor Covering
- 5.2. Market Analysis, Insights and Forecast - by Distribution Channel
- 5.2.1. Supermarkets and Hypermarkets
- 5.2.2. Specialty Stores
- 5.2.3. Online
- 5.2.4. Others
- 5.3. Market Analysis, Insights and Forecast - by Region
- 5.3.1. North America
- 5.3.2. South America
- 5.3.3. Europe
- 5.3.4. Middle East & Africa
- 5.3.5. Asia Pacific
- 5.1. Market Analysis, Insights and Forecast - by Material Type
- 6. Global USA Home Textile Industry Analysis, Insights and Forecast, 2021-2033
- 6.1. Market Analysis, Insights and Forecast - by Material Type
- 6.1.1. Bed Linen
- 6.1.2. Bath Linen
- 6.1.3. Kitchen Linen
- 6.1.4. Upholstery
- 6.1.5. Floor Covering
- 6.2. Market Analysis, Insights and Forecast - by Distribution Channel
- 6.2.1. Supermarkets and Hypermarkets
- 6.2.2. Specialty Stores
- 6.2.3. Online
- 6.2.4. Others
- 6.1. Market Analysis, Insights and Forecast - by Material Type
- 7. North America USA Home Textile Industry Analysis, Insights and Forecast, 2020-2032
- 7.1. Market Analysis, Insights and Forecast - by Material Type
- 7.1.1. Bed Linen
- 7.1.2. Bath Linen
- 7.1.3. Kitchen Linen
- 7.1.4. Upholstery
- 7.1.5. Floor Covering
- 7.2. Market Analysis, Insights and Forecast - by Distribution Channel
- 7.2.1. Supermarkets and Hypermarkets
- 7.2.2. Specialty Stores
- 7.2.3. Online
- 7.2.4. Others
- 7.1. Market Analysis, Insights and Forecast - by Material Type
- 8. South America USA Home Textile Industry Analysis, Insights and Forecast, 2020-2032
- 8.1. Market Analysis, Insights and Forecast - by Material Type
- 8.1.1. Bed Linen
- 8.1.2. Bath Linen
- 8.1.3. Kitchen Linen
- 8.1.4. Upholstery
- 8.1.5. Floor Covering
- 8.2. Market Analysis, Insights and Forecast - by Distribution Channel
- 8.2.1. Supermarkets and Hypermarkets
- 8.2.2. Specialty Stores
- 8.2.3. Online
- 8.2.4. Others
- 8.1. Market Analysis, Insights and Forecast - by Material Type
- 9. Europe USA Home Textile Industry Analysis, Insights and Forecast, 2020-2032
- 9.1. Market Analysis, Insights and Forecast - by Material Type
- 9.1.1. Bed Linen
- 9.1.2. Bath Linen
- 9.1.3. Kitchen Linen
- 9.1.4. Upholstery
- 9.1.5. Floor Covering
- 9.2. Market Analysis, Insights and Forecast - by Distribution Channel
- 9.2.1. Supermarkets and Hypermarkets
- 9.2.2. Specialty Stores
- 9.2.3. Online
- 9.2.4. Others
- 9.1. Market Analysis, Insights and Forecast - by Material Type
- 10. Middle East & Africa USA Home Textile Industry Analysis, Insights and Forecast, 2020-2032
- 10.1. Market Analysis, Insights and Forecast - by Material Type
- 10.1.1. Bed Linen
- 10.1.2. Bath Linen
- 10.1.3. Kitchen Linen
- 10.1.4. Upholstery
- 10.1.5. Floor Covering
- 10.2. Market Analysis, Insights and Forecast - by Distribution Channel
- 10.2.1. Supermarkets and Hypermarkets
- 10.2.2. Specialty Stores
- 10.2.3. Online
- 10.2.4. Others
- 10.1. Market Analysis, Insights and Forecast - by Material Type
- 11. Asia Pacific USA Home Textile Industry Analysis, Insights and Forecast, 2020-2032
- 11.1. Market Analysis, Insights and Forecast - by Material Type
- 11.1.1. Bed Linen
- 11.1.2. Bath Linen
- 11.1.3. Kitchen Linen
- 11.1.4. Upholstery
- 11.1.5. Floor Covering
- 11.2. Market Analysis, Insights and Forecast - by Distribution Channel
- 11.2.1. Supermarkets and Hypermarkets
- 11.2.2. Specialty Stores
- 11.2.3. Online
- 11.2.4. Others
- 11.1. Market Analysis, Insights and Forecast - by Material Type
- 12. Competitive Analysis
- 12.1. Company Profiles
- 12.1.1 Welspun USA
- 12.1.1.1. Company Overview
- 12.1.1.2. Products
- 12.1.1.3. Company Financials
- 12.1.1.4. SWOT Analysis
- 12.1.2 Shaw Industries
- 12.1.2.1. Company Overview
- 12.1.2.2. Products
- 12.1.2.3. Company Financials
- 12.1.2.4. SWOT Analysis
- 12.1.3 Milliken
- 12.1.3.1. Company Overview
- 12.1.3.2. Products
- 12.1.3.3. Company Financials
- 12.1.3.4. SWOT Analysis
- 12.1.4 WestPoint Home
- 12.1.4.1. Company Overview
- 12.1.4.2. Products
- 12.1.4.3. Company Financials
- 12.1.4.4. SWOT Analysis
- 12.1.5 Ralph Lauren
- 12.1.5.1. Company Overview
- 12.1.5.2. Products
- 12.1.5.3. Company Financials
- 12.1.5.4. SWOT Analysis
- 12.1.6 Standard Textile**List Not Exhaustive
- 12.1.6.1. Company Overview
- 12.1.6.2. Products
- 12.1.6.3. Company Financials
- 12.1.6.4. SWOT Analysis
- 12.1.7 TJX Companies
- 12.1.7.1. Company Overview
- 12.1.7.2. Products
- 12.1.7.3. Company Financials
- 12.1.7.4. SWOT Analysis
- 12.1.8 Etro Home Collection
- 12.1.8.1. Company Overview
- 12.1.8.2. Products
- 12.1.8.3. Company Financials
- 12.1.8.4. SWOT Analysis
- 12.1.9 Mohawk Industries
- 12.1.9.1. Company Overview
- 12.1.9.2. Products
- 12.1.9.3. Company Financials
- 12.1.9.4. SWOT Analysis
- 12.1.10 Jim Thompson Fabrics
- 12.1.10.1. Company Overview
- 12.1.10.2. Products
- 12.1.10.3. Company Financials
- 12.1.10.4. SWOT Analysis
- 12.1.1 Welspun USA
- 12.2. Market Entropy
- 12.2.1 Company's Key Areas Served
- 12.2.2 Recent Developments
- 12.3. Company Market Share Analysis 2025
- 12.3.1 Top 5 Companies Market Share Analysis
- 12.3.2 Top 3 Companies Market Share Analysis
- 12.4. List of Potential Customers
- 13. Research Methodology
List of Figures
- Figure 1: Global USA Home Textile Industry Revenue Breakdown (Million, %) by Region 2025 & 2033
- Figure 2: North America USA Home Textile Industry Revenue (Million), by Material Type 2025 & 2033
- Figure 3: North America USA Home Textile Industry Revenue Share (%), by Material Type 2025 & 2033
- Figure 4: North America USA Home Textile Industry Revenue (Million), by Distribution Channel 2025 & 2033
- Figure 5: North America USA Home Textile Industry Revenue Share (%), by Distribution Channel 2025 & 2033
- Figure 6: North America USA Home Textile Industry Revenue (Million), by Country 2025 & 2033
- Figure 7: North America USA Home Textile Industry Revenue Share (%), by Country 2025 & 2033
- Figure 8: South America USA Home Textile Industry Revenue (Million), by Material Type 2025 & 2033
- Figure 9: South America USA Home Textile Industry Revenue Share (%), by Material Type 2025 & 2033
- Figure 10: South America USA Home Textile Industry Revenue (Million), by Distribution Channel 2025 & 2033
- Figure 11: South America USA Home Textile Industry Revenue Share (%), by Distribution Channel 2025 & 2033
- Figure 12: South America USA Home Textile Industry Revenue (Million), by Country 2025 & 2033
- Figure 13: South America USA Home Textile Industry Revenue Share (%), by Country 2025 & 2033
- Figure 14: Europe USA Home Textile Industry Revenue (Million), by Material Type 2025 & 2033
- Figure 15: Europe USA Home Textile Industry Revenue Share (%), by Material Type 2025 & 2033
- Figure 16: Europe USA Home Textile Industry Revenue (Million), by Distribution Channel 2025 & 2033
- Figure 17: Europe USA Home Textile Industry Revenue Share (%), by Distribution Channel 2025 & 2033
- Figure 18: Europe USA Home Textile Industry Revenue (Million), by Country 2025 & 2033
- Figure 19: Europe USA Home Textile Industry Revenue Share (%), by Country 2025 & 2033
- Figure 20: Middle East & Africa USA Home Textile Industry Revenue (Million), by Material Type 2025 & 2033
- Figure 21: Middle East & Africa USA Home Textile Industry Revenue Share (%), by Material Type 2025 & 2033
- Figure 22: Middle East & Africa USA Home Textile Industry Revenue (Million), by Distribution Channel 2025 & 2033
- Figure 23: Middle East & Africa USA Home Textile Industry Revenue Share (%), by Distribution Channel 2025 & 2033
- Figure 24: Middle East & Africa USA Home Textile Industry Revenue (Million), by Country 2025 & 2033
- Figure 25: Middle East & Africa USA Home Textile Industry Revenue Share (%), by Country 2025 & 2033
- Figure 26: Asia Pacific USA Home Textile Industry Revenue (Million), by Material Type 2025 & 2033
- Figure 27: Asia Pacific USA Home Textile Industry Revenue Share (%), by Material Type 2025 & 2033
- Figure 28: Asia Pacific USA Home Textile Industry Revenue (Million), by Distribution Channel 2025 & 2033
- Figure 29: Asia Pacific USA Home Textile Industry Revenue Share (%), by Distribution Channel 2025 & 2033
- Figure 30: Asia Pacific USA Home Textile Industry Revenue (Million), by Country 2025 & 2033
- Figure 31: Asia Pacific USA Home Textile Industry Revenue Share (%), by Country 2025 & 2033
List of Tables
- Table 1: Global USA Home Textile Industry Revenue Million Forecast, by Material Type 2020 & 2033
- Table 2: Global USA Home Textile Industry Revenue Million Forecast, by Distribution Channel 2020 & 2033
- Table 3: Global USA Home Textile Industry Revenue Million Forecast, by Region 2020 & 2033
- Table 4: Global USA Home Textile Industry Revenue Million Forecast, by Material Type 2020 & 2033
- Table 5: Global USA Home Textile Industry Revenue Million Forecast, by Distribution Channel 2020 & 2033
- Table 6: Global USA Home Textile Industry Revenue Million Forecast, by Country 2020 & 2033
- Table 7: United States USA Home Textile Industry Revenue (Million) Forecast, by Application 2020 & 2033
- Table 8: Canada USA Home Textile Industry Revenue (Million) Forecast, by Application 2020 & 2033
- Table 9: Mexico USA Home Textile Industry Revenue (Million) Forecast, by Application 2020 & 2033
- Table 10: Global USA Home Textile Industry Revenue Million Forecast, by Material Type 2020 & 2033
- Table 11: Global USA Home Textile Industry Revenue Million Forecast, by Distribution Channel 2020 & 2033
- Table 12: Global USA Home Textile Industry Revenue Million Forecast, by Country 2020 & 2033
- Table 13: Brazil USA Home Textile Industry Revenue (Million) Forecast, by Application 2020 & 2033
- Table 14: Argentina USA Home Textile Industry Revenue (Million) Forecast, by Application 2020 & 2033
- Table 15: Rest of South America USA Home Textile Industry Revenue (Million) Forecast, by Application 2020 & 2033
- Table 16: Global USA Home Textile Industry Revenue Million Forecast, by Material Type 2020 & 2033
- Table 17: Global USA Home Textile Industry Revenue Million Forecast, by Distribution Channel 2020 & 2033
- Table 18: Global USA Home Textile Industry Revenue Million Forecast, by Country 2020 & 2033
- Table 19: United Kingdom USA Home Textile Industry Revenue (Million) Forecast, by Application 2020 & 2033
- Table 20: Germany USA Home Textile Industry Revenue (Million) Forecast, by Application 2020 & 2033
- Table 21: France USA Home Textile Industry Revenue (Million) Forecast, by Application 2020 & 2033
- Table 22: Italy USA Home Textile Industry Revenue (Million) Forecast, by Application 2020 & 2033
- Table 23: Spain USA Home Textile Industry Revenue (Million) Forecast, by Application 2020 & 2033
- Table 24: Russia USA Home Textile Industry Revenue (Million) Forecast, by Application 2020 & 2033
- Table 25: Benelux USA Home Textile Industry Revenue (Million) Forecast, by Application 2020 & 2033
- Table 26: Nordics USA Home Textile Industry Revenue (Million) Forecast, by Application 2020 & 2033
- Table 27: Rest of Europe USA Home Textile Industry Revenue (Million) Forecast, by Application 2020 & 2033
- Table 28: Global USA Home Textile Industry Revenue Million Forecast, by Material Type 2020 & 2033
- Table 29: Global USA Home Textile Industry Revenue Million Forecast, by Distribution Channel 2020 & 2033
- Table 30: Global USA Home Textile Industry Revenue Million Forecast, by Country 2020 & 2033
- Table 31: Turkey USA Home Textile Industry Revenue (Million) Forecast, by Application 2020 & 2033
- Table 32: Israel USA Home Textile Industry Revenue (Million) Forecast, by Application 2020 & 2033
- Table 33: GCC USA Home Textile Industry Revenue (Million) Forecast, by Application 2020 & 2033
- Table 34: North Africa USA Home Textile Industry Revenue (Million) Forecast, by Application 2020 & 2033
- Table 35: South Africa USA Home Textile Industry Revenue (Million) Forecast, by Application 2020 & 2033
- Table 36: Rest of Middle East & Africa USA Home Textile Industry Revenue (Million) Forecast, by Application 2020 & 2033
- Table 37: Global USA Home Textile Industry Revenue Million Forecast, by Material Type 2020 & 2033
- Table 38: Global USA Home Textile Industry Revenue Million Forecast, by Distribution Channel 2020 & 2033
- Table 39: Global USA Home Textile Industry Revenue Million Forecast, by Country 2020 & 2033
- Table 40: China USA Home Textile Industry Revenue (Million) Forecast, by Application 2020 & 2033
- Table 41: India USA Home Textile Industry Revenue (Million) Forecast, by Application 2020 & 2033
- Table 42: Japan USA Home Textile Industry Revenue (Million) Forecast, by Application 2020 & 2033
- Table 43: South Korea USA Home Textile Industry Revenue (Million) Forecast, by Application 2020 & 2033
- Table 44: ASEAN USA Home Textile Industry Revenue (Million) Forecast, by Application 2020 & 2033
- Table 45: Oceania USA Home Textile Industry Revenue (Million) Forecast, by Application 2020 & 2033
- Table 46: Rest of Asia Pacific USA Home Textile Industry Revenue (Million) Forecast, by Application 2020 & 2033
Frequently Asked Questions
1. What is the projected Compound Annual Growth Rate (CAGR) of the USA Home Textile Industry?
The projected CAGR is approximately 5.42%.
2. Which companies are prominent players in the USA Home Textile Industry?
Key companies in the market include Welspun USA, Shaw Industries, Milliken, WestPoint Home, Ralph Lauren, Standard Textile**List Not Exhaustive, TJX Companies, Etro Home Collection, Mohawk Industries, Jim Thompson Fabrics.
3. What are the main segments of the USA Home Textile Industry?
The market segments include Material Type, Distribution Channel.
4. Can you provide details about the market size?
The market size is estimated to be USD 23.78 Million as of 2022.
5. What are some drivers contributing to market growth?
High Resistance to Scratches and Stains Drives the Market; High Durability Drives the Market.
6. What are the notable trends driving market growth?
Increasing Sector of Real Estate is Driving the Market.
7. Are there any restraints impacting market growth?
Excess Water Damages the Floor Covering; Exposure to Sun Cause Damages to the Floor Covering; Market Oppurtunities4.; Technological Advancements in Floor Covering Market4.; Increasing Demand for Hardwood Floors.
8. Can you provide examples of recent developments in the market?
December 2022: Milliken & Company, a diversified global textile manufacturer with more than 70 locations worldwide, plans to expand operations in Cherokee County. The company's $27.4 million investment will create 75 new jobs.
9. What pricing options are available for accessing the report?
Pricing options include single-user, multi-user, and enterprise licenses priced at USD 3800, USD 4500, and USD 5800 respectively.
10. Is the market size provided in terms of value or volume?
The market size is provided in terms of value, measured in Million.
11. Are there any specific market keywords associated with the report?
Yes, the market keyword associated with the report is "USA Home Textile Industry," which aids in identifying and referencing the specific market segment covered.
12. How do I determine which pricing option suits my needs best?
The pricing options vary based on user requirements and access needs. Individual users may opt for single-user licenses, while businesses requiring broader access may choose multi-user or enterprise licenses for cost-effective access to the report.
13. Are there any additional resources or data provided in the USA Home Textile Industry report?
While the report offers comprehensive insights, it's advisable to review the specific contents or supplementary materials provided to ascertain if additional resources or data are available.
14. How can I stay updated on further developments or reports in the USA Home Textile Industry?
To stay informed about further developments, trends, and reports in the USA Home Textile Industry, consider subscribing to industry newsletters, following relevant companies and organizations, or regularly checking reputable industry news sources and publications.
Methodology
Step 1 - Identification of Relevant Samples Size from Population Database


Step 2 - Approaches for Defining Global Market Size (Value, Volume* & Price*)

Note*: In applicable scenarios
Step 3 - Data Sources
Primary Research
- Web Analytics
- Survey Reports
- Research Institute
- Latest Research Reports
- Opinion Leaders
Secondary Research
- Annual Reports
- White Paper
- Latest Press Release
- Industry Association
- Paid Database
- Investor Presentations

Step 4 - Data Triangulation
Involves using different sources of information in order to increase the validity of a study
These sources are likely to be stakeholders in a program - participants, other researchers, program staff, other community members, and so on.
Then we put all data in single framework & apply various statistical tools to find out the dynamic on the market.
During the analysis stage, feedback from the stakeholder groups would be compared to determine areas of agreement as well as areas of divergence