

Key Insights
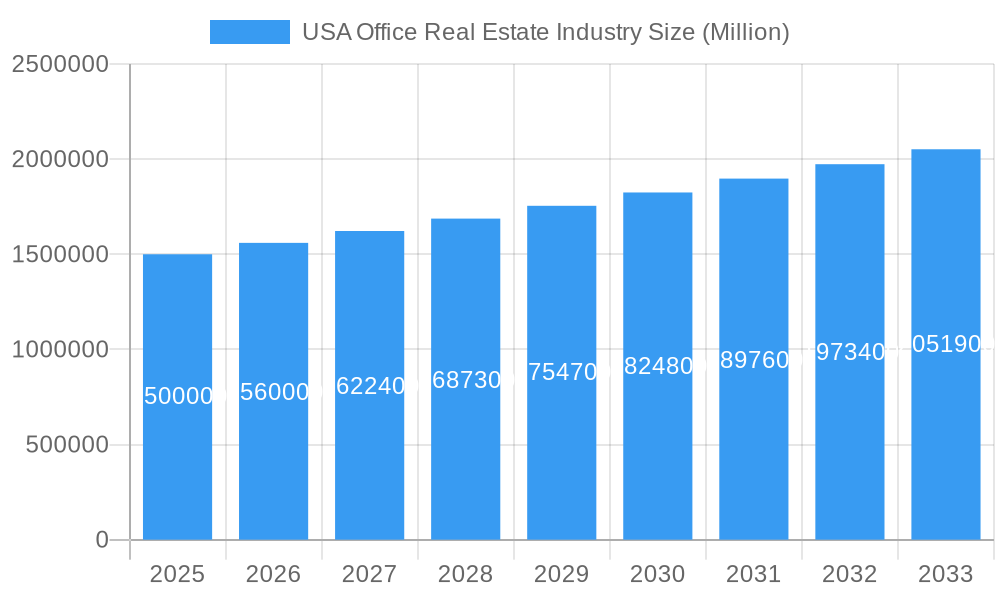
The US office real estate market, valued at approximately $1.5 trillion in 2025, is experiencing robust growth, projected to maintain a Compound Annual Growth Rate (CAGR) exceeding 4% through 2033. This expansion is fueled by several key drivers. The ongoing expansion of the Information Technology (IT and ITES) sector, coupled with the steady growth in the BFSI and consulting industries, is creating significant demand for office spaces, particularly in major metropolitan areas. Furthermore, a shift towards hybrid work models, while initially impacting demand, is leading to a renewed focus on creating high-quality, amenity-rich office spaces that attract and retain talent. However, challenges remain. The rise of remote work continues to exert downward pressure on demand in some sectors and locations, and rising interest rates and construction costs represent significant headwinds for new development projects. This necessitates a strategic approach by developers, focusing on adaptable spaces, sustainable building practices, and strategic location selection to remain competitive. The market segmentation reveals strong performance across regions, with the Northeast and West Coast experiencing higher demand driven by technology hubs, while the Midwest and South show more moderate but consistent growth reflecting a diversified economic base. Leading players like Hitt Contracting, Kiewit Corporation, and others are navigating these complexities through innovative project financing, strategic acquisitions, and a focus on delivering high-value, sustainable office solutions.
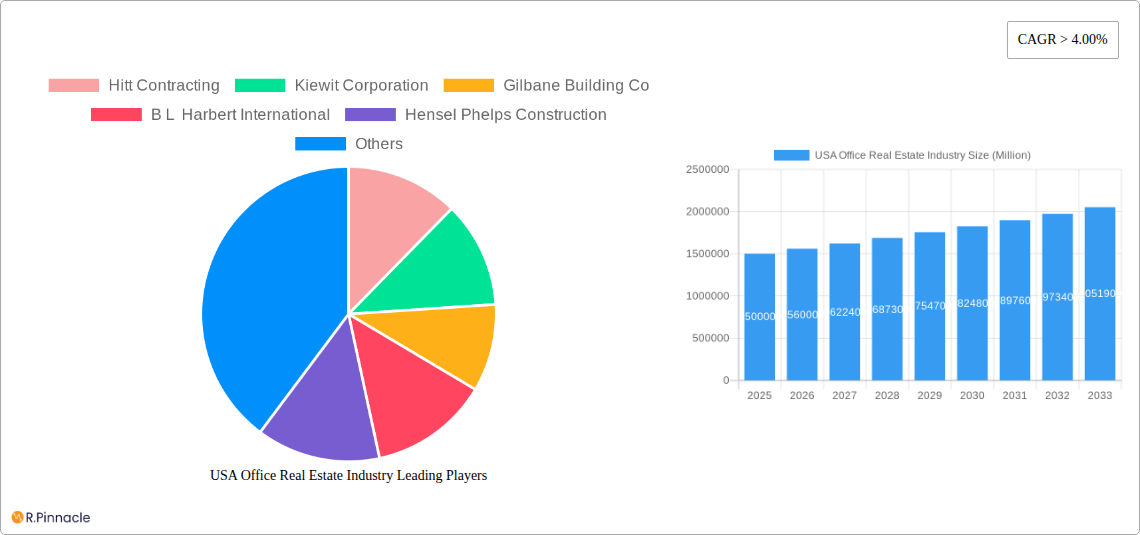
USA Office Real Estate Industry Market Size (In Million)
The competitive landscape is characterized by both large national firms and regional specialists, each adapting their strategies to cater to evolving market conditions. The success of these firms hinges on their ability to anticipate shifts in demand, manage risk associated with rising construction costs and interest rates, and deliver high-quality projects that meet the evolving needs of modern workplaces. This includes a focus on incorporating technology, promoting sustainability, and enhancing the overall employee experience within the office environment. The long-term outlook remains positive, albeit with a degree of caution, suggesting that selective investment and strategic adaptation will be critical for success within this dynamic sector.
USA Office Real Estate Industry Company Market Share
USA Office Real Estate Industry Report: 2019-2033 Forecast
This comprehensive report provides an in-depth analysis of the USA office real estate industry, offering valuable insights for industry professionals, investors, and strategic planners. Covering the period from 2019 to 2033, with a base year of 2025 and a forecast period of 2025-2033, this report leverages extensive data and analysis to deliver actionable intelligence. The total market size in 2025 is estimated at $XX Million.
USA Office Real Estate Industry Market Structure & Innovation Trends
This section analyzes the competitive landscape, innovation drivers, and regulatory influences shaping the US office real estate market. We examine market concentration, identifying key players and their respective market shares. The report also delves into the impact of mergers and acquisitions (M&A) activity, quantifying deal values and their influence on market dynamics. Innovation drivers such as technological advancements in building management systems and sustainable construction practices are explored, alongside regulatory frameworks impacting development and leasing. Finally, the analysis considers substitute products and end-user demographic shifts influencing demand.
- Market Concentration: The top 5 players (estimated) hold approximately XX% of the market share in 2025.
- M&A Activity: Total M&A deal value in 2024 was estimated at $XX Million, showcasing significant consolidation within the sector.
- Innovation Drivers: Green building certifications (LEED) and smart building technologies are major drivers of innovation.
- Regulatory Framework: Zoning regulations and building codes significantly impact development costs and timelines.
USA Office Real Estate Industry Market Dynamics & Trends
This section explores the key market dynamics and trends shaping the industry. We analyze growth drivers, including economic expansion, urbanization, and technological advancements, while considering challenges like economic downturns, supply chain disruptions, and changing workplace preferences. The report quantifies market growth using compound annual growth rate (CAGR) projections and assesses market penetration rates across different segments. Competitive dynamics, including pricing strategies and market share shifts, are also analyzed. The estimated CAGR for the forecast period (2025-2033) is XX%.
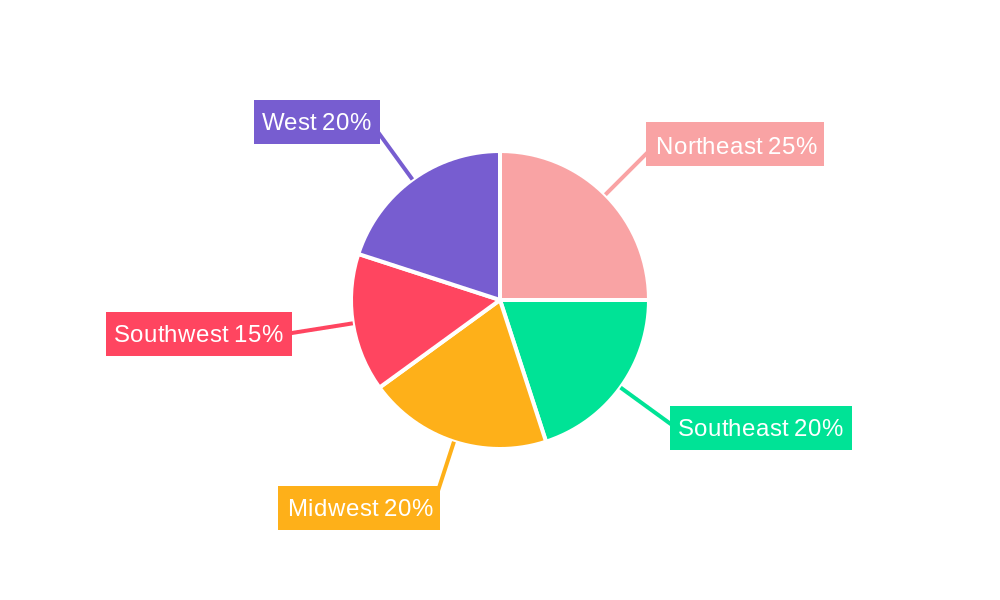
Dominant Regions & Segments in USA Office Real Estate Industry
This section identifies the leading regions and sectors within the US office real estate market. We analyze regional variations in market size, growth rates, and key drivers, examining the Northeast, Midwest, South, and West regions. Similarly, we dissect the performance of key sectors, including Information Technology (IT and ITES), Manufacturing, BFSI (Banking, Financial Services, and Insurance), Consulting, and Other Services.
Leading Region: The Northeast region is projected to maintain its dominance due to factors such as strong economic activity and established infrastructure.
Key Drivers (Northeast):
- Strong economic growth and high concentration of Fortune 500 companies.
- Robust transportation infrastructure and access to skilled labor.
- Favorable government policies and incentives for real estate development.
Leading Sector: The IT and ITES sector is expected to continue its strong growth trajectory, driven by the expansion of technology companies and their increasing demand for office space.
Key Drivers (IT and ITES):
- High concentration of technology companies in major metropolitan areas.
- Demand for collaborative workspaces and specialized office amenities.
- Continued growth in cloud computing and related technologies.
Detailed analysis of other regions and sectors follows a similar format.
USA Office Real Estate Industry Product Innovations
Recent product innovations focus on sustainable building materials, smart building technologies that enhance energy efficiency and operational efficiency, and flexible workspace designs catering to evolving work styles. These innovations provide competitive advantages by attracting tenants seeking environmentally responsible and technologically advanced office spaces, improving tenant retention and occupancy rates. The adoption of PropTech solutions is also gaining momentum.
Report Scope & Segmentation Analysis
This report segments the US office real estate market by region (Northeast, Midwest, South, West) and sector (IT and ITES, Manufacturing, BFSI, Consulting, Other Services). Each segment's market size, growth projections, and competitive dynamics are analyzed. For example, the IT sector is projected to witness significant growth driven by the expansion of tech companies. The Midwest region shows steady growth, driven by manufacturing and logistics sectors. The detailed analysis continues for each segment.
Key Drivers of USA Office Real Estate Industry Growth
Several factors drive growth, including robust economic conditions, increasing urbanization leading to higher demand for office spaces in city centers, and technological advancements enhancing building efficiency and tenant experience. Favorable government policies and increasing foreign direct investment also contribute to the sector's expansion. The ongoing shift towards hybrid work models presents both challenges and opportunities.
Challenges in the USA Office Real Estate Industry Sector
The industry faces challenges including rising construction costs, supply chain disruptions impacting project timelines and budgets, increased competition for tenants, and stringent environmental regulations. Furthermore, economic downturns can significantly impact occupancy rates and rental income. These factors cumulatively impact profitability. The increasing adoption of remote work presents a significant challenge to occupancy rates.
Emerging Opportunities in USA Office Real Estate Industry
Emerging opportunities include the growth of flexible workspaces, demand for sustainable and energy-efficient buildings, and the integration of smart building technologies. Furthermore, the expansion of data centers and specialized office spaces for technology companies presents significant growth potential. The incorporation of wellness features is another burgeoning opportunity.
Leading Players in the USA Office Real Estate Industry Market
Key Developments in USA Office Real Estate Industry Industry
- Jan 2023: Increased adoption of flexible workspace solutions by major corporations.
- Mar 2024: Significant investment in sustainable building technologies observed across several projects.
- June 2024: Merger of two mid-sized construction firms resulting in increased market share.
Further detailed developments will be included in the full report.
Future Outlook for USA Office Real Estate Industry Market
The future of the US office real estate market is characterized by significant growth potential, driven by technological advancements, evolving workplace preferences, and economic expansion. Strategic opportunities lie in focusing on sustainable developments, flexible workspaces, and integrating smart building technologies to attract and retain tenants. The market is poised for continued expansion in the coming years.
USA Office Real Estate Industry Segmentation
-
1. Sector
- 1.1. Information Technology (IT and ITES)
- 1.2. Manufacturing
- 1.3. BFSI (Banking, Financial Services, and Insurance)
- 1.4. Consulting
- 1.5. Other Services
USA Office Real Estate Industry Segmentation By Geography
-
1. North America
- 1.1. United States
- 1.2. Canada
- 1.3. Mexico
-
2. South America
- 2.1. Brazil
- 2.2. Argentina
- 2.3. Rest of South America
-
3. Europe
- 3.1. United Kingdom
- 3.2. Germany
- 3.3. France
- 3.4. Italy
- 3.5. Spain
- 3.6. Russia
- 3.7. Benelux
- 3.8. Nordics
- 3.9. Rest of Europe
-
4. Middle East & Africa
- 4.1. Turkey
- 4.2. Israel
- 4.3. GCC
- 4.4. North Africa
- 4.5. South Africa
- 4.6. Rest of Middle East & Africa
-
5. Asia Pacific
- 5.1. China
- 5.2. India
- 5.3. Japan
- 5.4. South Korea
- 5.5. ASEAN
- 5.6. Oceania
- 5.7. Rest of Asia Pacific
USA Office Real Estate Industry Regional Market Share
Geographic Coverage of USA Office Real Estate Industry
USA Office Real Estate Industry REPORT HIGHLIGHTS
| Aspects | Details |
|---|---|
| Study Period | 2020-2034 |
| Base Year | 2025 |
| Estimated Year | 2026 |
| Forecast Period | 2026-2034 |
| Historical Period | 2020-2025 |
| Growth Rate | CAGR of 7.1% from 2020-2034 |
| Segmentation |
|
Table of Contents
- 1. Introduction
- 1.1. Research Scope
- 1.2. Market Segmentation
- 1.3. Research Objective
- 1.4. Definitions and Assumptions
- 2. Executive Summary
- 2.1. Market Snapshot
- 3. Market Dynamics
- 3.1. Market Drivers
- 3.2. Market Restrains
- 3.3. Market Trends
- 3.4. Market Opportunities
- 4. Market Factor Analysis
- 4.1. Porters Five Forces
- 4.1.1. Bargaining Power of Suppliers
- 4.1.2. Bargaining Power of Buyers
- 4.1.3. Threat of New Entrants
- 4.1.4. Threat of Substitutes
- 4.1.5. Competitive Rivalry
- 4.2. PESTEL analysis
- 4.3. BCG Analysis
- 4.3.1. Stars (High Growth, High Market Share)
- 4.3.2. Cash Cows (Low Growth, High Market Share)
- 4.3.3. Question Mark (High Growth, Low Market Share)
- 4.3.4. Dogs (Low Growth, Low Market Share)
- 4.4. Ansoff Matrix Analysis
- 4.5. Supply Chain Analysis
- 4.6. Regulatory Landscape
- 4.7. Current Market Potential and Opportunity Assessment (TAM–SAM–SOM Framework)
- 4.8. PRI Analyst Note
- 4.1. Porters Five Forces
- 5. Market Analysis, Insights and Forecast 2021-2033
- 5.1. Market Analysis, Insights and Forecast - by Sector
- 5.1.1. Information Technology (IT and ITES)
- 5.1.2. Manufacturing
- 5.1.3. BFSI (Banking, Financial Services, and Insurance)
- 5.1.4. Consulting
- 5.1.5. Other Services
- 5.2. Market Analysis, Insights and Forecast - by Region
- 5.2.1. North America
- 5.2.2. South America
- 5.2.3. Europe
- 5.2.4. Middle East & Africa
- 5.2.5. Asia Pacific
- 5.1. Market Analysis, Insights and Forecast - by Sector
- 6. Global USA Office Real Estate Industry Analysis, Insights and Forecast, 2021-2033
- 6.1. Market Analysis, Insights and Forecast - by Sector
- 6.1.1. Information Technology (IT and ITES)
- 6.1.2. Manufacturing
- 6.1.3. BFSI (Banking, Financial Services, and Insurance)
- 6.1.4. Consulting
- 6.1.5. Other Services
- 6.1. Market Analysis, Insights and Forecast - by Sector
- 7. North America USA Office Real Estate Industry Analysis, Insights and Forecast, 2020-2032
- 7.1. Market Analysis, Insights and Forecast - by Sector
- 7.1.1. Information Technology (IT and ITES)
- 7.1.2. Manufacturing
- 7.1.3. BFSI (Banking, Financial Services, and Insurance)
- 7.1.4. Consulting
- 7.1.5. Other Services
- 7.1. Market Analysis, Insights and Forecast - by Sector
- 8. South America USA Office Real Estate Industry Analysis, Insights and Forecast, 2020-2032
- 8.1. Market Analysis, Insights and Forecast - by Sector
- 8.1.1. Information Technology (IT and ITES)
- 8.1.2. Manufacturing
- 8.1.3. BFSI (Banking, Financial Services, and Insurance)
- 8.1.4. Consulting
- 8.1.5. Other Services
- 8.1. Market Analysis, Insights and Forecast - by Sector
- 9. Europe USA Office Real Estate Industry Analysis, Insights and Forecast, 2020-2032
- 9.1. Market Analysis, Insights and Forecast - by Sector
- 9.1.1. Information Technology (IT and ITES)
- 9.1.2. Manufacturing
- 9.1.3. BFSI (Banking, Financial Services, and Insurance)
- 9.1.4. Consulting
- 9.1.5. Other Services
- 9.1. Market Analysis, Insights and Forecast - by Sector
- 10. Middle East & Africa USA Office Real Estate Industry Analysis, Insights and Forecast, 2020-2032
- 10.1. Market Analysis, Insights and Forecast - by Sector
- 10.1.1. Information Technology (IT and ITES)
- 10.1.2. Manufacturing
- 10.1.3. BFSI (Banking, Financial Services, and Insurance)
- 10.1.4. Consulting
- 10.1.5. Other Services
- 10.1. Market Analysis, Insights and Forecast - by Sector
- 11. Asia Pacific USA Office Real Estate Industry Analysis, Insights and Forecast, 2020-2032
- 11.1. Market Analysis, Insights and Forecast - by Sector
- 11.1.1. Information Technology (IT and ITES)
- 11.1.2. Manufacturing
- 11.1.3. BFSI (Banking, Financial Services, and Insurance)
- 11.1.4. Consulting
- 11.1.5. Other Services
- 11.1. Market Analysis, Insights and Forecast - by Sector
- 12. Competitive Analysis
- 12.1. Company Profiles
- 12.1.1 Hitt Contracting
- 12.1.1.1. Company Overview
- 12.1.1.2. Products
- 12.1.1.3. Company Financials
- 12.1.1.4. SWOT Analysis
- 12.1.2 Kiewit Corporation
- 12.1.2.1. Company Overview
- 12.1.2.2. Products
- 12.1.2.3. Company Financials
- 12.1.2.4. SWOT Analysis
- 12.1.3 Gilbane Building Co
- 12.1.3.1. Company Overview
- 12.1.3.2. Products
- 12.1.3.3. Company Financials
- 12.1.3.4. SWOT Analysis
- 12.1.4 B L Harbert International
- 12.1.4.1. Company Overview
- 12.1.4.2. Products
- 12.1.4.3. Company Financials
- 12.1.4.4. SWOT Analysis
- 12.1.5 Hensel Phelps Construction
- 12.1.5.1. Company Overview
- 12.1.5.2. Products
- 12.1.5.3. Company Financials
- 12.1.5.4. SWOT Analysis
- 12.1.6 Ryan Companies US Inc
- 12.1.6.1. Company Overview
- 12.1.6.2. Products
- 12.1.6.3. Company Financials
- 12.1.6.4. SWOT Analysis
- 12.1.7 Skanska USA Inc
- 12.1.7.1. Company Overview
- 12.1.7.2. Products
- 12.1.7.3. Company Financials
- 12.1.7.4. SWOT Analysis
- 12.1.8 Turner Construction Company Inc
- 12.1.8.1. Company Overview
- 12.1.8.2. Products
- 12.1.8.3. Company Financials
- 12.1.8.4. SWOT Analysis
- 12.1.9 Trammell Crow Company
- 12.1.9.1. Company Overview
- 12.1.9.2. Products
- 12.1.9.3. Company Financials
- 12.1.9.4. SWOT Analysis
- 12.1.10 Clayco Inc
- 12.1.10.1. Company Overview
- 12.1.10.2. Products
- 12.1.10.3. Company Financials
- 12.1.10.4. SWOT Analysis
- 12.1.11 Dpr Construction
- 12.1.11.1. Company Overview
- 12.1.11.2. Products
- 12.1.11.3. Company Financials
- 12.1.11.4. SWOT Analysis
- 12.1.12 PCL Construction Enterprises
- 12.1.12.1. Company Overview
- 12.1.12.2. Products
- 12.1.12.3. Company Financials
- 12.1.12.4. SWOT Analysis
- 12.1.13 Structure Tone LLC**List Not Exhaustive
- 12.1.13.1. Company Overview
- 12.1.13.2. Products
- 12.1.13.3. Company Financials
- 12.1.13.4. SWOT Analysis
- 12.1.1 Hitt Contracting
- 12.2. Market Entropy
- 12.2.1 Company's Key Areas Served
- 12.2.2 Recent Developments
- 12.3. Company Market Share Analysis 2025
- 12.3.1 Top 5 Companies Market Share Analysis
- 12.3.2 Top 3 Companies Market Share Analysis
- 12.4. List of Potential Customers
- 13. Research Methodology
List of Figures
- Figure 1: Global USA Office Real Estate Industry Revenue Breakdown (billion, %) by Region 2025 & 2033
- Figure 2: North America USA Office Real Estate Industry Revenue (billion), by Sector 2025 & 2033
- Figure 3: North America USA Office Real Estate Industry Revenue Share (%), by Sector 2025 & 2033
- Figure 4: North America USA Office Real Estate Industry Revenue (billion), by Country 2025 & 2033
- Figure 5: North America USA Office Real Estate Industry Revenue Share (%), by Country 2025 & 2033
- Figure 6: South America USA Office Real Estate Industry Revenue (billion), by Sector 2025 & 2033
- Figure 7: South America USA Office Real Estate Industry Revenue Share (%), by Sector 2025 & 2033
- Figure 8: South America USA Office Real Estate Industry Revenue (billion), by Country 2025 & 2033
- Figure 9: South America USA Office Real Estate Industry Revenue Share (%), by Country 2025 & 2033
- Figure 10: Europe USA Office Real Estate Industry Revenue (billion), by Sector 2025 & 2033
- Figure 11: Europe USA Office Real Estate Industry Revenue Share (%), by Sector 2025 & 2033
- Figure 12: Europe USA Office Real Estate Industry Revenue (billion), by Country 2025 & 2033
- Figure 13: Europe USA Office Real Estate Industry Revenue Share (%), by Country 2025 & 2033
- Figure 14: Middle East & Africa USA Office Real Estate Industry Revenue (billion), by Sector 2025 & 2033
- Figure 15: Middle East & Africa USA Office Real Estate Industry Revenue Share (%), by Sector 2025 & 2033
- Figure 16: Middle East & Africa USA Office Real Estate Industry Revenue (billion), by Country 2025 & 2033
- Figure 17: Middle East & Africa USA Office Real Estate Industry Revenue Share (%), by Country 2025 & 2033
- Figure 18: Asia Pacific USA Office Real Estate Industry Revenue (billion), by Sector 2025 & 2033
- Figure 19: Asia Pacific USA Office Real Estate Industry Revenue Share (%), by Sector 2025 & 2033
- Figure 20: Asia Pacific USA Office Real Estate Industry Revenue (billion), by Country 2025 & 2033
- Figure 21: Asia Pacific USA Office Real Estate Industry Revenue Share (%), by Country 2025 & 2033
List of Tables
- Table 1: Global USA Office Real Estate Industry Revenue billion Forecast, by Sector 2020 & 2033
- Table 2: Global USA Office Real Estate Industry Revenue billion Forecast, by Region 2020 & 2033
- Table 3: Global USA Office Real Estate Industry Revenue billion Forecast, by Sector 2020 & 2033
- Table 4: Global USA Office Real Estate Industry Revenue billion Forecast, by Country 2020 & 2033
- Table 5: United States USA Office Real Estate Industry Revenue (billion) Forecast, by Application 2020 & 2033
- Table 6: Canada USA Office Real Estate Industry Revenue (billion) Forecast, by Application 2020 & 2033
- Table 7: Mexico USA Office Real Estate Industry Revenue (billion) Forecast, by Application 2020 & 2033
- Table 8: Global USA Office Real Estate Industry Revenue billion Forecast, by Sector 2020 & 2033
- Table 9: Global USA Office Real Estate Industry Revenue billion Forecast, by Country 2020 & 2033
- Table 10: Brazil USA Office Real Estate Industry Revenue (billion) Forecast, by Application 2020 & 2033
- Table 11: Argentina USA Office Real Estate Industry Revenue (billion) Forecast, by Application 2020 & 2033
- Table 12: Rest of South America USA Office Real Estate Industry Revenue (billion) Forecast, by Application 2020 & 2033
- Table 13: Global USA Office Real Estate Industry Revenue billion Forecast, by Sector 2020 & 2033
- Table 14: Global USA Office Real Estate Industry Revenue billion Forecast, by Country 2020 & 2033
- Table 15: United Kingdom USA Office Real Estate Industry Revenue (billion) Forecast, by Application 2020 & 2033
- Table 16: Germany USA Office Real Estate Industry Revenue (billion) Forecast, by Application 2020 & 2033
- Table 17: France USA Office Real Estate Industry Revenue (billion) Forecast, by Application 2020 & 2033
- Table 18: Italy USA Office Real Estate Industry Revenue (billion) Forecast, by Application 2020 & 2033
- Table 19: Spain USA Office Real Estate Industry Revenue (billion) Forecast, by Application 2020 & 2033
- Table 20: Russia USA Office Real Estate Industry Revenue (billion) Forecast, by Application 2020 & 2033
- Table 21: Benelux USA Office Real Estate Industry Revenue (billion) Forecast, by Application 2020 & 2033
- Table 22: Nordics USA Office Real Estate Industry Revenue (billion) Forecast, by Application 2020 & 2033
- Table 23: Rest of Europe USA Office Real Estate Industry Revenue (billion) Forecast, by Application 2020 & 2033
- Table 24: Global USA Office Real Estate Industry Revenue billion Forecast, by Sector 2020 & 2033
- Table 25: Global USA Office Real Estate Industry Revenue billion Forecast, by Country 2020 & 2033
- Table 26: Turkey USA Office Real Estate Industry Revenue (billion) Forecast, by Application 2020 & 2033
- Table 27: Israel USA Office Real Estate Industry Revenue (billion) Forecast, by Application 2020 & 2033
- Table 28: GCC USA Office Real Estate Industry Revenue (billion) Forecast, by Application 2020 & 2033
- Table 29: North Africa USA Office Real Estate Industry Revenue (billion) Forecast, by Application 2020 & 2033
- Table 30: South Africa USA Office Real Estate Industry Revenue (billion) Forecast, by Application 2020 & 2033
- Table 31: Rest of Middle East & Africa USA Office Real Estate Industry Revenue (billion) Forecast, by Application 2020 & 2033
- Table 32: Global USA Office Real Estate Industry Revenue billion Forecast, by Sector 2020 & 2033
- Table 33: Global USA Office Real Estate Industry Revenue billion Forecast, by Country 2020 & 2033
- Table 34: China USA Office Real Estate Industry Revenue (billion) Forecast, by Application 2020 & 2033
- Table 35: India USA Office Real Estate Industry Revenue (billion) Forecast, by Application 2020 & 2033
- Table 36: Japan USA Office Real Estate Industry Revenue (billion) Forecast, by Application 2020 & 2033
- Table 37: South Korea USA Office Real Estate Industry Revenue (billion) Forecast, by Application 2020 & 2033
- Table 38: ASEAN USA Office Real Estate Industry Revenue (billion) Forecast, by Application 2020 & 2033
- Table 39: Oceania USA Office Real Estate Industry Revenue (billion) Forecast, by Application 2020 & 2033
- Table 40: Rest of Asia Pacific USA Office Real Estate Industry Revenue (billion) Forecast, by Application 2020 & 2033
Frequently Asked Questions
1. What is the projected Compound Annual Growth Rate (CAGR) of the USA Office Real Estate Industry?
The projected CAGR is approximately 7.1%.
2. Which companies are prominent players in the USA Office Real Estate Industry?
Key companies in the market include Hitt Contracting, Kiewit Corporation, Gilbane Building Co, B L Harbert International, Hensel Phelps Construction, Ryan Companies US Inc, Skanska USA Inc, Turner Construction Company Inc, Trammell Crow Company, Clayco Inc, Dpr Construction, PCL Construction Enterprises, Structure Tone LLC**List Not Exhaustive.
3. What are the main segments of the USA Office Real Estate Industry?
The market segments include Sector.
4. Can you provide details about the market size?
The market size is estimated to be USD 4332.38 billion as of 2022.
5. What are some drivers contributing to market growth?
Increasing Disposable Income and Middle-Class Expansion; Increased Awareness of Roofing Solutions.
6. What are the notable trends driving market growth?
Increase in Leasing Volumes.
7. Are there any restraints impacting market growth?
The presence of counterfeit or substandard roofing materials in the market poses a significant challenge; The roofing industry faces a shortage of skilled labor.
8. Can you provide examples of recent developments in the market?
N/A
9. What pricing options are available for accessing the report?
Pricing options include single-user, multi-user, and enterprise licenses priced at USD 3800, USD 4500, and USD 5800 respectively.
10. Is the market size provided in terms of value or volume?
The market size is provided in terms of value, measured in billion.
11. Are there any specific market keywords associated with the report?
Yes, the market keyword associated with the report is "USA Office Real Estate Industry," which aids in identifying and referencing the specific market segment covered.
12. How do I determine which pricing option suits my needs best?
The pricing options vary based on user requirements and access needs. Individual users may opt for single-user licenses, while businesses requiring broader access may choose multi-user or enterprise licenses for cost-effective access to the report.
13. Are there any additional resources or data provided in the USA Office Real Estate Industry report?
While the report offers comprehensive insights, it's advisable to review the specific contents or supplementary materials provided to ascertain if additional resources or data are available.
14. How can I stay updated on further developments or reports in the USA Office Real Estate Industry?
To stay informed about further developments, trends, and reports in the USA Office Real Estate Industry, consider subscribing to industry newsletters, following relevant companies and organizations, or regularly checking reputable industry news sources and publications.
Methodology
Step 1 - Identification of Relevant Samples Size from Population Database


Step 2 - Approaches for Defining Global Market Size (Value, Volume* & Price*)

Note*: In applicable scenarios
Step 3 - Data Sources
Primary Research
- Web Analytics
- Survey Reports
- Research Institute
- Latest Research Reports
- Opinion Leaders
Secondary Research
- Annual Reports
- White Paper
- Latest Press Release
- Industry Association
- Paid Database
- Investor Presentations

Step 4 - Data Triangulation
Involves using different sources of information in order to increase the validity of a study
These sources are likely to be stakeholders in a program - participants, other researchers, program staff, other community members, and so on.
Then we put all data in single framework & apply various statistical tools to find out the dynamic on the market.
During the analysis stage, feedback from the stakeholder groups would be compared to determine areas of agreement as well as areas of divergence