

Key Insights
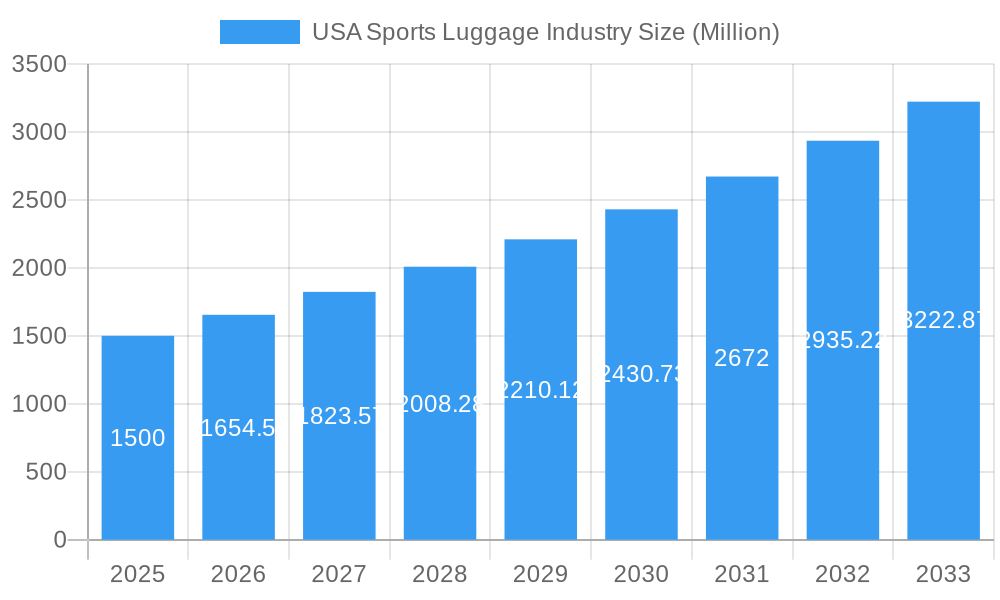
The US sports luggage market, valued at $8.48 billion in the base year 2025, is projected for substantial expansion. Driven by a compound annual growth rate (CAGR) of 8.08% from 2025 to 2033, this growth is attributed to several key factors. Increased participation in sports like golf, soccer, and baseball across all age demographics fuels demand for specialized protective equipment transport. The proliferation of e-commerce and online retail convenience further broadens market access and boosts online sales. Growing engagement in fitness activities, rising consumer disposable income, and a preference for premium, durable luggage also contribute positively. Potential restraints include economic downturns and consumer spending volatility. The market is segmented by sport (golf, soccer, baseball, snow/winter, football, others) and distribution channel (supermarkets/hypermarkets, specialty stores, online retail, others). Key competitors include Adidas, Nike, and Under Armour, driving product innovation to meet evolving consumer needs. Regional analysis indicates strong growth potential in the Northeast, West, and Southeast, correlating with higher sports participation and affluent consumer bases.
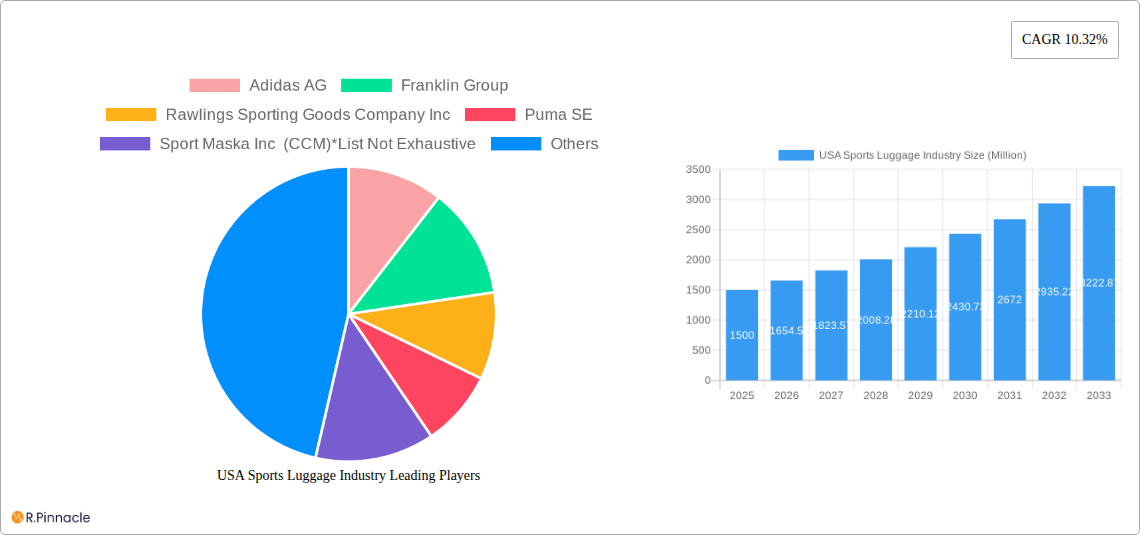
USA Sports Luggage Industry Market Size (In Billion)
The US sports luggage market features a competitive environment with established global brands and specialized niche players. Leading brands utilize brand equity and extensive distribution for market dominance. Smaller companies are gaining traction through innovation, superior quality, and catering to specific sports. A growing emphasis on sustainable and eco-friendly materials is influencing the market, benefiting environmentally conscious brands. Future growth is anticipated from technological advancements in design, personalized customization, and integrated e-commerce strategies. This market presents significant growth opportunities for both established and emerging companies.
USA Sports Luggage Industry Company Market Share
USA Sports Luggage Industry Report: 2019-2033 Forecast
This comprehensive report provides an in-depth analysis of the USA sports luggage industry, offering invaluable insights for industry professionals, investors, and strategic decision-makers. Covering the period from 2019 to 2033, with a focus on 2025, this report unveils market dynamics, growth drivers, and future opportunities within this dynamic sector. The study encompasses key segments, leading players, and emerging trends, equipping you with the knowledge to navigate the complexities of this evolving market. The total market size in 2025 is estimated at $XX Million.
USA Sports Luggage Industry Market Structure & Innovation Trends
This section analyzes the competitive landscape of the USA sports luggage industry, exploring market concentration, innovation drivers, and regulatory influences. We examine the role of mergers and acquisitions (M&A) activity, impacting market share distribution. Key companies like Adidas AG, Adidas AG, Nike Inc, Nike Inc, Under Armour Inc, Under Armour Inc, Puma SE, Puma SE, and Franklin Group, along with others like Rawlings Sporting Goods Company Inc and Select Sport AS, significantly shape the market.
- Market Concentration: The market is characterized by a moderately concentrated structure, with a few dominant players holding significant market share. Adidas AG and Nike Inc are likely to command the largest shares in 2025, estimated at xx% and xx% respectively.
- Innovation Drivers: Lightweight materials, enhanced durability, integrated technology (GPS tracking, smart sensors), and sustainable manufacturing practices are key innovation drivers.
- Regulatory Framework: Compliance with safety standards and environmental regulations influences product design and manufacturing.
- Product Substitutes: Backpacks, duffel bags, and other general-purpose luggage present some level of substitution.
- End-User Demographics: The primary end-users are athletes, sports enthusiasts, and travelers engaged in various sporting activities. The market caters to different age groups and income levels.
- M&A Activities: The past five years have witnessed several significant M&A deals, totaling an estimated $XX Million in value, driving consolidation within the market. These deals primarily focused on expanding product portfolios and market reach.
USA Sports Luggage Industry Market Dynamics & Trends
This section delves into the market's growth trajectory, exploring factors influencing its expansion. The report analyzes market growth drivers, technological disruptions, evolving consumer preferences, and competitive dynamics.
The USA sports luggage market is projected to experience a Compound Annual Growth Rate (CAGR) of xx% during the forecast period (2025-2033). Market penetration for online retail channels is expected to reach xx% by 2033, driven by the increasing adoption of e-commerce. Several factors contribute to this growth, including increased participation in sports, rising disposable incomes, technological advancements leading to innovative product designs, and the growing popularity of online shopping. Competitive dynamics are shaped by intense rivalry, with key players investing heavily in research and development, marketing, and brand building. Consumer preferences are shifting toward lightweight, durable, and technologically advanced luggage, emphasizing sustainability.
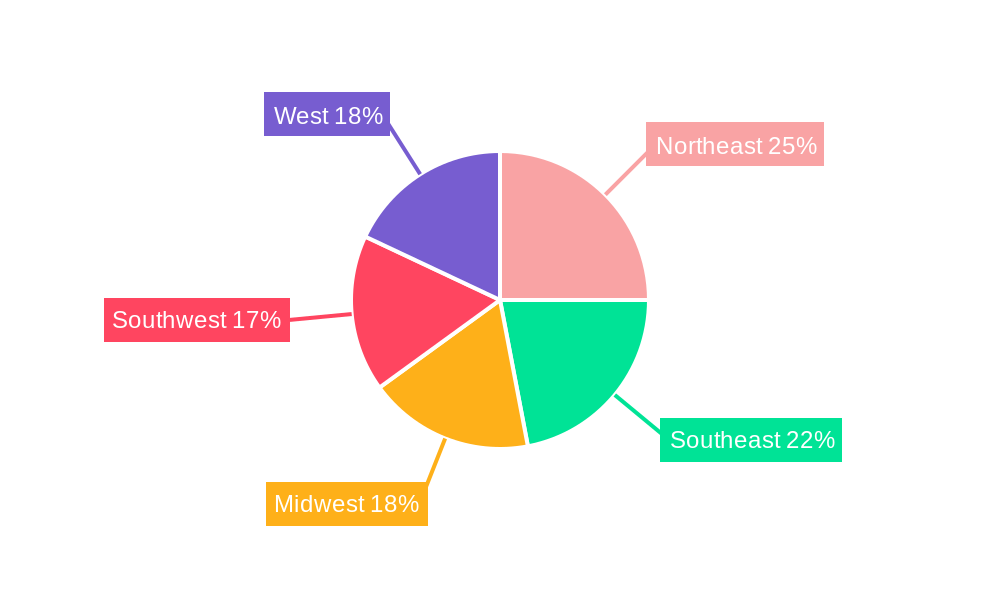
Dominant Regions & Segments in USA Sports Luggage Industry
This section identifies the leading regions and segments within the USA sports luggage market, highlighting key growth areas and influencing factors.
Dominant Segments:
-
By Sports Type: The Golf segment is projected to maintain its leading position, with estimated revenue of $XX Million by 2025, driven by a dedicated enthusiast base and continuous innovation in equipment design. The Soccer segment is also poised for significant expansion, expected to generate $XX Million, fueled by increasing youth participation and the professional league's growing popularity. Segments such as Baseball and Football will continue to represent substantial market shares due to their widespread appeal and high participation rates.
-
By Distribution Channel: The Online Retailing channel is experiencing exponential growth and is anticipated to overtake Specialty Stores as the dominant distribution method by 2033. The unparalleled convenience, broader product selection, and direct-to-consumer reach offered by e-commerce platforms are the primary catalysts for this shift.
Key Drivers of Regional and Segmental Dominance: The success of specific regions and segments within the USA sports luggage industry is a multifaceted phenomenon, influenced by:
- Robust economic conditions and increasing disposable incomes in targeted geographic areas.
- Government initiatives and local community programs that actively promote sports participation across various age groups.
- The presence of a well-established and accessible retail infrastructure, encompassing both brick-and-mortar and online channels.
- A culture of high consumer engagement and significant spending allocated towards premium sports equipment and accessories.
USA Sports Luggage Industry Product Innovations
The USA sports luggage industry witnesses continuous product innovation focusing on enhanced functionality, durability, and user experience. Lightweight yet robust materials, ergonomic designs, integrated technology (such as GPS trackers and USB charging ports), and customizable features are becoming increasingly popular. These innovations aim to cater to specific needs, enhancing athletic performance and improving travel convenience. The use of sustainable and eco-friendly materials is also gaining traction, reflecting growing environmental concerns.
Report Scope & Segmentation Analysis
This report segments the USA sports luggage market by sports type (Golf, Soccer, Baseball, Snow/Winter Sports, Football, Other Sports) and distribution channel (Supermarkets/Hypermarkets, Specialty Stores, Online Retailing, Other Distribution Channels). Each segment's growth projections, market size, and competitive dynamics are analyzed, providing a detailed understanding of the market's structure and opportunities. For example, the Golf segment is projected to achieve a CAGR of xx% during the forecast period, driven by increased participation in golf and demand for high-quality golf bags. The online retailing channel is expected to witness the fastest growth rate, driven by the increasing adoption of e-commerce.
Key Drivers of USA Sports Luggage Industry Growth
Several factors fuel the growth of the USA sports luggage industry. Increased participation in sports and fitness activities drives demand for specialized luggage. Rising disposable incomes allow consumers to invest in higher-quality, feature-rich products. Technological advancements enable the development of innovative luggage designs with enhanced functionality and durability. Government initiatives promoting sports and recreation further contribute to market expansion.
Challenges in the USA Sports Luggage Industry Sector
The USA sports luggage industry navigates a landscape marked by significant challenges. Intense competition, both from established giants and agile new entrants, exerts considerable pressure on pricing strategies and profit margins. The inherent volatility of global supply chains and fluctuating raw material costs can directly impact production schedules and overall profitability. Furthermore, the stringent adherence to evolving safety standards and increasingly rigorous environmental regulations necessitates substantial investment in compliance and sustainable practices, adding to operational complexities and costs. In periods of economic downturn, consumers may re-evaluate discretionary spending, leading to reduced demand for specialized sports luggage.
Emerging Opportunities in USA Sports Luggage Industry
The USA sports luggage industry is ripe with emerging opportunities for forward-thinking businesses. The burgeoning e-commerce ecosystem provides a vast and expanding platform for online sales, enabling wider market reach and direct customer engagement. A growing consumer consciousness towards environmental responsibility is fueling a significant demand for sustainable and eco-friendly luggage solutions, creating a niche for innovative material sourcing and manufacturing processes. Technological advancements are paving the way for smart luggage features, such as integrated tracking, power banks, and advanced security systems, as well as personalized customization options, catering to individual preferences and enhancing user experience. Furthermore, strategic expansion into niche or underserved sports segments and untapped geographic markets presents considerable avenues for growth and market diversification.
Leading Players in the USA Sports Luggage Industry Market
- Adidas AG
- Franklin Group
- Rawlings Sporting Goods Company Inc
- Puma SE
- Sport Maska Inc (CCM)
- Under Armour Inc
- Nike Inc
- Select Sport AS
Key Developments in USA Sports Luggage Industry Industry
- 2023-Q3: Adidas AG launched a new line of sustainable sports luggage.
- 2022-Q4: Nike Inc acquired a smaller luggage manufacturer, expanding its product portfolio.
- 2021-Q2: New safety regulations for sports luggage were implemented.
- 2020-Q1: The COVID-19 pandemic temporarily disrupted supply chains. (Further details would be included in the full report)
Future Outlook for USA Sports Luggage Industry Market
The USA sports luggage industry is projected to experience sustained growth, propelled by enduring participation rates in diverse sports, continuous technological innovation, and evolving consumer expectations. Strategic advantages will be gained by companies that prioritize innovation in product design and functionality, adeptly leverage the power of e-commerce for market penetration, and demonstrate a strong commitment to sustainability in their operations. The industry's trajectory will be significantly shaped by the agility of market participants in adapting to shifting consumer demands, embracing technological disruptions, and effectively navigating competitive pressures. The market is anticipated to maintain a robust growth momentum throughout the forecast period, offering substantial potential for both established industry leaders and emerging players.
USA Sports Luggage Industry Segmentation
-
1. Sports Type
- 1.1. Golf
- 1.2. Soccer
- 1.3. Baseball
- 1.4. Snow/Winter Sports
- 1.5. Football
- 1.6. Other Sports
-
2. Distribution Channel
- 2.1. Supermarkets/Hypermarkets
- 2.2. Specialty Stores
- 2.3. Online Retailing
- 2.4. Other Distribution Channels
USA Sports Luggage Industry Segmentation By Geography
-
1. North America
- 1.1. United States
- 1.2. Canada
- 1.3. Mexico
-
2. South America
- 2.1. Brazil
- 2.2. Argentina
- 2.3. Rest of South America
-
3. Europe
- 3.1. United Kingdom
- 3.2. Germany
- 3.3. France
- 3.4. Italy
- 3.5. Spain
- 3.6. Russia
- 3.7. Benelux
- 3.8. Nordics
- 3.9. Rest of Europe
-
4. Middle East & Africa
- 4.1. Turkey
- 4.2. Israel
- 4.3. GCC
- 4.4. North Africa
- 4.5. South Africa
- 4.6. Rest of Middle East & Africa
-
5. Asia Pacific
- 5.1. China
- 5.2. India
- 5.3. Japan
- 5.4. South Korea
- 5.5. ASEAN
- 5.6. Oceania
- 5.7. Rest of Asia Pacific
USA Sports Luggage Industry Regional Market Share
Geographic Coverage of USA Sports Luggage Industry
USA Sports Luggage Industry REPORT HIGHLIGHTS
| Aspects | Details |
|---|---|
| Study Period | 2020-2034 |
| Base Year | 2025 |
| Estimated Year | 2026 |
| Forecast Period | 2026-2034 |
| Historical Period | 2020-2025 |
| Growth Rate | CAGR of 8.08% from 2020-2034 |
| Segmentation |
|
Table of Contents
- 1. Introduction
- 1.1. Research Scope
- 1.2. Market Segmentation
- 1.3. Research Objective
- 1.4. Definitions and Assumptions
- 2. Executive Summary
- 2.1. Market Snapshot
- 3. Market Dynamics
- 3.1. Market Drivers
- 3.2. Market Restrains
- 3.3. Market Trends
- 3.4. Market Opportunities
- 4. Market Factor Analysis
- 4.1. Porters Five Forces
- 4.1.1. Bargaining Power of Suppliers
- 4.1.2. Bargaining Power of Buyers
- 4.1.3. Threat of New Entrants
- 4.1.4. Threat of Substitutes
- 4.1.5. Competitive Rivalry
- 4.2. PESTEL analysis
- 4.3. BCG Analysis
- 4.3.1. Stars (High Growth, High Market Share)
- 4.3.2. Cash Cows (Low Growth, High Market Share)
- 4.3.3. Question Mark (High Growth, Low Market Share)
- 4.3.4. Dogs (Low Growth, Low Market Share)
- 4.4. Ansoff Matrix Analysis
- 4.5. Supply Chain Analysis
- 4.6. Regulatory Landscape
- 4.7. Current Market Potential and Opportunity Assessment (TAM–SAM–SOM Framework)
- 4.8. PRI Analyst Note
- 4.1. Porters Five Forces
- 5. Market Analysis, Insights and Forecast 2021-2033
- 5.1. Market Analysis, Insights and Forecast - by Sports Type
- 5.1.1. Golf
- 5.1.2. Soccer
- 5.1.3. Baseball
- 5.1.4. Snow/Winter Sports
- 5.1.5. Football
- 5.1.6. Other Sports
- 5.2. Market Analysis, Insights and Forecast - by Distribution Channel
- 5.2.1. Supermarkets/Hypermarkets
- 5.2.2. Specialty Stores
- 5.2.3. Online Retailing
- 5.2.4. Other Distribution Channels
- 5.3. Market Analysis, Insights and Forecast - by Region
- 5.3.1. North America
- 5.3.2. South America
- 5.3.3. Europe
- 5.3.4. Middle East & Africa
- 5.3.5. Asia Pacific
- 5.1. Market Analysis, Insights and Forecast - by Sports Type
- 6. Global USA Sports Luggage Industry Analysis, Insights and Forecast, 2021-2033
- 6.1. Market Analysis, Insights and Forecast - by Sports Type
- 6.1.1. Golf
- 6.1.2. Soccer
- 6.1.3. Baseball
- 6.1.4. Snow/Winter Sports
- 6.1.5. Football
- 6.1.6. Other Sports
- 6.2. Market Analysis, Insights and Forecast - by Distribution Channel
- 6.2.1. Supermarkets/Hypermarkets
- 6.2.2. Specialty Stores
- 6.2.3. Online Retailing
- 6.2.4. Other Distribution Channels
- 6.1. Market Analysis, Insights and Forecast - by Sports Type
- 7. North America USA Sports Luggage Industry Analysis, Insights and Forecast, 2020-2032
- 7.1. Market Analysis, Insights and Forecast - by Sports Type
- 7.1.1. Golf
- 7.1.2. Soccer
- 7.1.3. Baseball
- 7.1.4. Snow/Winter Sports
- 7.1.5. Football
- 7.1.6. Other Sports
- 7.2. Market Analysis, Insights and Forecast - by Distribution Channel
- 7.2.1. Supermarkets/Hypermarkets
- 7.2.2. Specialty Stores
- 7.2.3. Online Retailing
- 7.2.4. Other Distribution Channels
- 7.1. Market Analysis, Insights and Forecast - by Sports Type
- 8. South America USA Sports Luggage Industry Analysis, Insights and Forecast, 2020-2032
- 8.1. Market Analysis, Insights and Forecast - by Sports Type
- 8.1.1. Golf
- 8.1.2. Soccer
- 8.1.3. Baseball
- 8.1.4. Snow/Winter Sports
- 8.1.5. Football
- 8.1.6. Other Sports
- 8.2. Market Analysis, Insights and Forecast - by Distribution Channel
- 8.2.1. Supermarkets/Hypermarkets
- 8.2.2. Specialty Stores
- 8.2.3. Online Retailing
- 8.2.4. Other Distribution Channels
- 8.1. Market Analysis, Insights and Forecast - by Sports Type
- 9. Europe USA Sports Luggage Industry Analysis, Insights and Forecast, 2020-2032
- 9.1. Market Analysis, Insights and Forecast - by Sports Type
- 9.1.1. Golf
- 9.1.2. Soccer
- 9.1.3. Baseball
- 9.1.4. Snow/Winter Sports
- 9.1.5. Football
- 9.1.6. Other Sports
- 9.2. Market Analysis, Insights and Forecast - by Distribution Channel
- 9.2.1. Supermarkets/Hypermarkets
- 9.2.2. Specialty Stores
- 9.2.3. Online Retailing
- 9.2.4. Other Distribution Channels
- 9.1. Market Analysis, Insights and Forecast - by Sports Type
- 10. Middle East & Africa USA Sports Luggage Industry Analysis, Insights and Forecast, 2020-2032
- 10.1. Market Analysis, Insights and Forecast - by Sports Type
- 10.1.1. Golf
- 10.1.2. Soccer
- 10.1.3. Baseball
- 10.1.4. Snow/Winter Sports
- 10.1.5. Football
- 10.1.6. Other Sports
- 10.2. Market Analysis, Insights and Forecast - by Distribution Channel
- 10.2.1. Supermarkets/Hypermarkets
- 10.2.2. Specialty Stores
- 10.2.3. Online Retailing
- 10.2.4. Other Distribution Channels
- 10.1. Market Analysis, Insights and Forecast - by Sports Type
- 11. Asia Pacific USA Sports Luggage Industry Analysis, Insights and Forecast, 2020-2032
- 11.1. Market Analysis, Insights and Forecast - by Sports Type
- 11.1.1. Golf
- 11.1.2. Soccer
- 11.1.3. Baseball
- 11.1.4. Snow/Winter Sports
- 11.1.5. Football
- 11.1.6. Other Sports
- 11.2. Market Analysis, Insights and Forecast - by Distribution Channel
- 11.2.1. Supermarkets/Hypermarkets
- 11.2.2. Specialty Stores
- 11.2.3. Online Retailing
- 11.2.4. Other Distribution Channels
- 11.1. Market Analysis, Insights and Forecast - by Sports Type
- 12. Competitive Analysis
- 12.1. Company Profiles
- 12.1.1 Adidas AG
- 12.1.1.1. Company Overview
- 12.1.1.2. Products
- 12.1.1.3. Company Financials
- 12.1.1.4. SWOT Analysis
- 12.1.2 Franklin Group
- 12.1.2.1. Company Overview
- 12.1.2.2. Products
- 12.1.2.3. Company Financials
- 12.1.2.4. SWOT Analysis
- 12.1.3 Rawlings Sporting Goods Company Inc
- 12.1.3.1. Company Overview
- 12.1.3.2. Products
- 12.1.3.3. Company Financials
- 12.1.3.4. SWOT Analysis
- 12.1.4 Puma SE
- 12.1.4.1. Company Overview
- 12.1.4.2. Products
- 12.1.4.3. Company Financials
- 12.1.4.4. SWOT Analysis
- 12.1.5 Sport Maska Inc (CCM)*List Not Exhaustive
- 12.1.5.1. Company Overview
- 12.1.5.2. Products
- 12.1.5.3. Company Financials
- 12.1.5.4. SWOT Analysis
- 12.1.6 Under Armour Inc
- 12.1.6.1. Company Overview
- 12.1.6.2. Products
- 12.1.6.3. Company Financials
- 12.1.6.4. SWOT Analysis
- 12.1.7 Nike Inc
- 12.1.7.1. Company Overview
- 12.1.7.2. Products
- 12.1.7.3. Company Financials
- 12.1.7.4. SWOT Analysis
- 12.1.8 Select Sport AS
- 12.1.8.1. Company Overview
- 12.1.8.2. Products
- 12.1.8.3. Company Financials
- 12.1.8.4. SWOT Analysis
- 12.1.1 Adidas AG
- 12.2. Market Entropy
- 12.2.1 Company's Key Areas Served
- 12.2.2 Recent Developments
- 12.3. Company Market Share Analysis 2025
- 12.3.1 Top 5 Companies Market Share Analysis
- 12.3.2 Top 3 Companies Market Share Analysis
- 12.4. List of Potential Customers
- 13. Research Methodology
List of Figures
- Figure 1: Global USA Sports Luggage Industry Revenue Breakdown (billion, %) by Region 2025 & 2033
- Figure 2: Global USA Sports Luggage Industry Volume Breakdown (K Units, %) by Region 2025 & 2033
- Figure 3: North America USA Sports Luggage Industry Revenue (billion), by Sports Type 2025 & 2033
- Figure 4: North America USA Sports Luggage Industry Volume (K Units), by Sports Type 2025 & 2033
- Figure 5: North America USA Sports Luggage Industry Revenue Share (%), by Sports Type 2025 & 2033
- Figure 6: North America USA Sports Luggage Industry Volume Share (%), by Sports Type 2025 & 2033
- Figure 7: North America USA Sports Luggage Industry Revenue (billion), by Distribution Channel 2025 & 2033
- Figure 8: North America USA Sports Luggage Industry Volume (K Units), by Distribution Channel 2025 & 2033
- Figure 9: North America USA Sports Luggage Industry Revenue Share (%), by Distribution Channel 2025 & 2033
- Figure 10: North America USA Sports Luggage Industry Volume Share (%), by Distribution Channel 2025 & 2033
- Figure 11: North America USA Sports Luggage Industry Revenue (billion), by Country 2025 & 2033
- Figure 12: North America USA Sports Luggage Industry Volume (K Units), by Country 2025 & 2033
- Figure 13: North America USA Sports Luggage Industry Revenue Share (%), by Country 2025 & 2033
- Figure 14: North America USA Sports Luggage Industry Volume Share (%), by Country 2025 & 2033
- Figure 15: South America USA Sports Luggage Industry Revenue (billion), by Sports Type 2025 & 2033
- Figure 16: South America USA Sports Luggage Industry Volume (K Units), by Sports Type 2025 & 2033
- Figure 17: South America USA Sports Luggage Industry Revenue Share (%), by Sports Type 2025 & 2033
- Figure 18: South America USA Sports Luggage Industry Volume Share (%), by Sports Type 2025 & 2033
- Figure 19: South America USA Sports Luggage Industry Revenue (billion), by Distribution Channel 2025 & 2033
- Figure 20: South America USA Sports Luggage Industry Volume (K Units), by Distribution Channel 2025 & 2033
- Figure 21: South America USA Sports Luggage Industry Revenue Share (%), by Distribution Channel 2025 & 2033
- Figure 22: South America USA Sports Luggage Industry Volume Share (%), by Distribution Channel 2025 & 2033
- Figure 23: South America USA Sports Luggage Industry Revenue (billion), by Country 2025 & 2033
- Figure 24: South America USA Sports Luggage Industry Volume (K Units), by Country 2025 & 2033
- Figure 25: South America USA Sports Luggage Industry Revenue Share (%), by Country 2025 & 2033
- Figure 26: South America USA Sports Luggage Industry Volume Share (%), by Country 2025 & 2033
- Figure 27: Europe USA Sports Luggage Industry Revenue (billion), by Sports Type 2025 & 2033
- Figure 28: Europe USA Sports Luggage Industry Volume (K Units), by Sports Type 2025 & 2033
- Figure 29: Europe USA Sports Luggage Industry Revenue Share (%), by Sports Type 2025 & 2033
- Figure 30: Europe USA Sports Luggage Industry Volume Share (%), by Sports Type 2025 & 2033
- Figure 31: Europe USA Sports Luggage Industry Revenue (billion), by Distribution Channel 2025 & 2033
- Figure 32: Europe USA Sports Luggage Industry Volume (K Units), by Distribution Channel 2025 & 2033
- Figure 33: Europe USA Sports Luggage Industry Revenue Share (%), by Distribution Channel 2025 & 2033
- Figure 34: Europe USA Sports Luggage Industry Volume Share (%), by Distribution Channel 2025 & 2033
- Figure 35: Europe USA Sports Luggage Industry Revenue (billion), by Country 2025 & 2033
- Figure 36: Europe USA Sports Luggage Industry Volume (K Units), by Country 2025 & 2033
- Figure 37: Europe USA Sports Luggage Industry Revenue Share (%), by Country 2025 & 2033
- Figure 38: Europe USA Sports Luggage Industry Volume Share (%), by Country 2025 & 2033
- Figure 39: Middle East & Africa USA Sports Luggage Industry Revenue (billion), by Sports Type 2025 & 2033
- Figure 40: Middle East & Africa USA Sports Luggage Industry Volume (K Units), by Sports Type 2025 & 2033
- Figure 41: Middle East & Africa USA Sports Luggage Industry Revenue Share (%), by Sports Type 2025 & 2033
- Figure 42: Middle East & Africa USA Sports Luggage Industry Volume Share (%), by Sports Type 2025 & 2033
- Figure 43: Middle East & Africa USA Sports Luggage Industry Revenue (billion), by Distribution Channel 2025 & 2033
- Figure 44: Middle East & Africa USA Sports Luggage Industry Volume (K Units), by Distribution Channel 2025 & 2033
- Figure 45: Middle East & Africa USA Sports Luggage Industry Revenue Share (%), by Distribution Channel 2025 & 2033
- Figure 46: Middle East & Africa USA Sports Luggage Industry Volume Share (%), by Distribution Channel 2025 & 2033
- Figure 47: Middle East & Africa USA Sports Luggage Industry Revenue (billion), by Country 2025 & 2033
- Figure 48: Middle East & Africa USA Sports Luggage Industry Volume (K Units), by Country 2025 & 2033
- Figure 49: Middle East & Africa USA Sports Luggage Industry Revenue Share (%), by Country 2025 & 2033
- Figure 50: Middle East & Africa USA Sports Luggage Industry Volume Share (%), by Country 2025 & 2033
- Figure 51: Asia Pacific USA Sports Luggage Industry Revenue (billion), by Sports Type 2025 & 2033
- Figure 52: Asia Pacific USA Sports Luggage Industry Volume (K Units), by Sports Type 2025 & 2033
- Figure 53: Asia Pacific USA Sports Luggage Industry Revenue Share (%), by Sports Type 2025 & 2033
- Figure 54: Asia Pacific USA Sports Luggage Industry Volume Share (%), by Sports Type 2025 & 2033
- Figure 55: Asia Pacific USA Sports Luggage Industry Revenue (billion), by Distribution Channel 2025 & 2033
- Figure 56: Asia Pacific USA Sports Luggage Industry Volume (K Units), by Distribution Channel 2025 & 2033
- Figure 57: Asia Pacific USA Sports Luggage Industry Revenue Share (%), by Distribution Channel 2025 & 2033
- Figure 58: Asia Pacific USA Sports Luggage Industry Volume Share (%), by Distribution Channel 2025 & 2033
- Figure 59: Asia Pacific USA Sports Luggage Industry Revenue (billion), by Country 2025 & 2033
- Figure 60: Asia Pacific USA Sports Luggage Industry Volume (K Units), by Country 2025 & 2033
- Figure 61: Asia Pacific USA Sports Luggage Industry Revenue Share (%), by Country 2025 & 2033
- Figure 62: Asia Pacific USA Sports Luggage Industry Volume Share (%), by Country 2025 & 2033
List of Tables
- Table 1: Global USA Sports Luggage Industry Revenue billion Forecast, by Sports Type 2020 & 2033
- Table 2: Global USA Sports Luggage Industry Volume K Units Forecast, by Sports Type 2020 & 2033
- Table 3: Global USA Sports Luggage Industry Revenue billion Forecast, by Distribution Channel 2020 & 2033
- Table 4: Global USA Sports Luggage Industry Volume K Units Forecast, by Distribution Channel 2020 & 2033
- Table 5: Global USA Sports Luggage Industry Revenue billion Forecast, by Region 2020 & 2033
- Table 6: Global USA Sports Luggage Industry Volume K Units Forecast, by Region 2020 & 2033
- Table 7: Global USA Sports Luggage Industry Revenue billion Forecast, by Sports Type 2020 & 2033
- Table 8: Global USA Sports Luggage Industry Volume K Units Forecast, by Sports Type 2020 & 2033
- Table 9: Global USA Sports Luggage Industry Revenue billion Forecast, by Distribution Channel 2020 & 2033
- Table 10: Global USA Sports Luggage Industry Volume K Units Forecast, by Distribution Channel 2020 & 2033
- Table 11: Global USA Sports Luggage Industry Revenue billion Forecast, by Country 2020 & 2033
- Table 12: Global USA Sports Luggage Industry Volume K Units Forecast, by Country 2020 & 2033
- Table 13: United States USA Sports Luggage Industry Revenue (billion) Forecast, by Application 2020 & 2033
- Table 14: United States USA Sports Luggage Industry Volume (K Units) Forecast, by Application 2020 & 2033
- Table 15: Canada USA Sports Luggage Industry Revenue (billion) Forecast, by Application 2020 & 2033
- Table 16: Canada USA Sports Luggage Industry Volume (K Units) Forecast, by Application 2020 & 2033
- Table 17: Mexico USA Sports Luggage Industry Revenue (billion) Forecast, by Application 2020 & 2033
- Table 18: Mexico USA Sports Luggage Industry Volume (K Units) Forecast, by Application 2020 & 2033
- Table 19: Global USA Sports Luggage Industry Revenue billion Forecast, by Sports Type 2020 & 2033
- Table 20: Global USA Sports Luggage Industry Volume K Units Forecast, by Sports Type 2020 & 2033
- Table 21: Global USA Sports Luggage Industry Revenue billion Forecast, by Distribution Channel 2020 & 2033
- Table 22: Global USA Sports Luggage Industry Volume K Units Forecast, by Distribution Channel 2020 & 2033
- Table 23: Global USA Sports Luggage Industry Revenue billion Forecast, by Country 2020 & 2033
- Table 24: Global USA Sports Luggage Industry Volume K Units Forecast, by Country 2020 & 2033
- Table 25: Brazil USA Sports Luggage Industry Revenue (billion) Forecast, by Application 2020 & 2033
- Table 26: Brazil USA Sports Luggage Industry Volume (K Units) Forecast, by Application 2020 & 2033
- Table 27: Argentina USA Sports Luggage Industry Revenue (billion) Forecast, by Application 2020 & 2033
- Table 28: Argentina USA Sports Luggage Industry Volume (K Units) Forecast, by Application 2020 & 2033
- Table 29: Rest of South America USA Sports Luggage Industry Revenue (billion) Forecast, by Application 2020 & 2033
- Table 30: Rest of South America USA Sports Luggage Industry Volume (K Units) Forecast, by Application 2020 & 2033
- Table 31: Global USA Sports Luggage Industry Revenue billion Forecast, by Sports Type 2020 & 2033
- Table 32: Global USA Sports Luggage Industry Volume K Units Forecast, by Sports Type 2020 & 2033
- Table 33: Global USA Sports Luggage Industry Revenue billion Forecast, by Distribution Channel 2020 & 2033
- Table 34: Global USA Sports Luggage Industry Volume K Units Forecast, by Distribution Channel 2020 & 2033
- Table 35: Global USA Sports Luggage Industry Revenue billion Forecast, by Country 2020 & 2033
- Table 36: Global USA Sports Luggage Industry Volume K Units Forecast, by Country 2020 & 2033
- Table 37: United Kingdom USA Sports Luggage Industry Revenue (billion) Forecast, by Application 2020 & 2033
- Table 38: United Kingdom USA Sports Luggage Industry Volume (K Units) Forecast, by Application 2020 & 2033
- Table 39: Germany USA Sports Luggage Industry Revenue (billion) Forecast, by Application 2020 & 2033
- Table 40: Germany USA Sports Luggage Industry Volume (K Units) Forecast, by Application 2020 & 2033
- Table 41: France USA Sports Luggage Industry Revenue (billion) Forecast, by Application 2020 & 2033
- Table 42: France USA Sports Luggage Industry Volume (K Units) Forecast, by Application 2020 & 2033
- Table 43: Italy USA Sports Luggage Industry Revenue (billion) Forecast, by Application 2020 & 2033
- Table 44: Italy USA Sports Luggage Industry Volume (K Units) Forecast, by Application 2020 & 2033
- Table 45: Spain USA Sports Luggage Industry Revenue (billion) Forecast, by Application 2020 & 2033
- Table 46: Spain USA Sports Luggage Industry Volume (K Units) Forecast, by Application 2020 & 2033
- Table 47: Russia USA Sports Luggage Industry Revenue (billion) Forecast, by Application 2020 & 2033
- Table 48: Russia USA Sports Luggage Industry Volume (K Units) Forecast, by Application 2020 & 2033
- Table 49: Benelux USA Sports Luggage Industry Revenue (billion) Forecast, by Application 2020 & 2033
- Table 50: Benelux USA Sports Luggage Industry Volume (K Units) Forecast, by Application 2020 & 2033
- Table 51: Nordics USA Sports Luggage Industry Revenue (billion) Forecast, by Application 2020 & 2033
- Table 52: Nordics USA Sports Luggage Industry Volume (K Units) Forecast, by Application 2020 & 2033
- Table 53: Rest of Europe USA Sports Luggage Industry Revenue (billion) Forecast, by Application 2020 & 2033
- Table 54: Rest of Europe USA Sports Luggage Industry Volume (K Units) Forecast, by Application 2020 & 2033
- Table 55: Global USA Sports Luggage Industry Revenue billion Forecast, by Sports Type 2020 & 2033
- Table 56: Global USA Sports Luggage Industry Volume K Units Forecast, by Sports Type 2020 & 2033
- Table 57: Global USA Sports Luggage Industry Revenue billion Forecast, by Distribution Channel 2020 & 2033
- Table 58: Global USA Sports Luggage Industry Volume K Units Forecast, by Distribution Channel 2020 & 2033
- Table 59: Global USA Sports Luggage Industry Revenue billion Forecast, by Country 2020 & 2033
- Table 60: Global USA Sports Luggage Industry Volume K Units Forecast, by Country 2020 & 2033
- Table 61: Turkey USA Sports Luggage Industry Revenue (billion) Forecast, by Application 2020 & 2033
- Table 62: Turkey USA Sports Luggage Industry Volume (K Units) Forecast, by Application 2020 & 2033
- Table 63: Israel USA Sports Luggage Industry Revenue (billion) Forecast, by Application 2020 & 2033
- Table 64: Israel USA Sports Luggage Industry Volume (K Units) Forecast, by Application 2020 & 2033
- Table 65: GCC USA Sports Luggage Industry Revenue (billion) Forecast, by Application 2020 & 2033
- Table 66: GCC USA Sports Luggage Industry Volume (K Units) Forecast, by Application 2020 & 2033
- Table 67: North Africa USA Sports Luggage Industry Revenue (billion) Forecast, by Application 2020 & 2033
- Table 68: North Africa USA Sports Luggage Industry Volume (K Units) Forecast, by Application 2020 & 2033
- Table 69: South Africa USA Sports Luggage Industry Revenue (billion) Forecast, by Application 2020 & 2033
- Table 70: South Africa USA Sports Luggage Industry Volume (K Units) Forecast, by Application 2020 & 2033
- Table 71: Rest of Middle East & Africa USA Sports Luggage Industry Revenue (billion) Forecast, by Application 2020 & 2033
- Table 72: Rest of Middle East & Africa USA Sports Luggage Industry Volume (K Units) Forecast, by Application 2020 & 2033
- Table 73: Global USA Sports Luggage Industry Revenue billion Forecast, by Sports Type 2020 & 2033
- Table 74: Global USA Sports Luggage Industry Volume K Units Forecast, by Sports Type 2020 & 2033
- Table 75: Global USA Sports Luggage Industry Revenue billion Forecast, by Distribution Channel 2020 & 2033
- Table 76: Global USA Sports Luggage Industry Volume K Units Forecast, by Distribution Channel 2020 & 2033
- Table 77: Global USA Sports Luggage Industry Revenue billion Forecast, by Country 2020 & 2033
- Table 78: Global USA Sports Luggage Industry Volume K Units Forecast, by Country 2020 & 2033
- Table 79: China USA Sports Luggage Industry Revenue (billion) Forecast, by Application 2020 & 2033
- Table 80: China USA Sports Luggage Industry Volume (K Units) Forecast, by Application 2020 & 2033
- Table 81: India USA Sports Luggage Industry Revenue (billion) Forecast, by Application 2020 & 2033
- Table 82: India USA Sports Luggage Industry Volume (K Units) Forecast, by Application 2020 & 2033
- Table 83: Japan USA Sports Luggage Industry Revenue (billion) Forecast, by Application 2020 & 2033
- Table 84: Japan USA Sports Luggage Industry Volume (K Units) Forecast, by Application 2020 & 2033
- Table 85: South Korea USA Sports Luggage Industry Revenue (billion) Forecast, by Application 2020 & 2033
- Table 86: South Korea USA Sports Luggage Industry Volume (K Units) Forecast, by Application 2020 & 2033
- Table 87: ASEAN USA Sports Luggage Industry Revenue (billion) Forecast, by Application 2020 & 2033
- Table 88: ASEAN USA Sports Luggage Industry Volume (K Units) Forecast, by Application 2020 & 2033
- Table 89: Oceania USA Sports Luggage Industry Revenue (billion) Forecast, by Application 2020 & 2033
- Table 90: Oceania USA Sports Luggage Industry Volume (K Units) Forecast, by Application 2020 & 2033
- Table 91: Rest of Asia Pacific USA Sports Luggage Industry Revenue (billion) Forecast, by Application 2020 & 2033
- Table 92: Rest of Asia Pacific USA Sports Luggage Industry Volume (K Units) Forecast, by Application 2020 & 2033
Frequently Asked Questions
1. What is the projected Compound Annual Growth Rate (CAGR) of the USA Sports Luggage Industry?
The projected CAGR is approximately 8.08%.
2. Which companies are prominent players in the USA Sports Luggage Industry?
Key companies in the market include Adidas AG, Franklin Group, Rawlings Sporting Goods Company Inc, Puma SE, Sport Maska Inc (CCM)*List Not Exhaustive, Under Armour Inc, Nike Inc, Select Sport AS.
3. What are the main segments of the USA Sports Luggage Industry?
The market segments include Sports Type, Distribution Channel.
4. Can you provide details about the market size?
The market size is estimated to be USD 8.48 billion as of 2022.
5. What are some drivers contributing to market growth?
Surging Demand for Athleisure Footwear; Aggressive Marketing by Brands.
6. What are the notable trends driving market growth?
Growing Influence of Athleisure and Health Wellness Trends.
7. Are there any restraints impacting market growth?
Extensive Availability of Counterfeit Products.
8. Can you provide examples of recent developments in the market?
N/A
9. What pricing options are available for accessing the report?
Pricing options include single-user, multi-user, and enterprise licenses priced at USD 3800, USD 4500, and USD 5800 respectively.
10. Is the market size provided in terms of value or volume?
The market size is provided in terms of value, measured in billion and volume, measured in K Units.
11. Are there any specific market keywords associated with the report?
Yes, the market keyword associated with the report is "USA Sports Luggage Industry," which aids in identifying and referencing the specific market segment covered.
12. How do I determine which pricing option suits my needs best?
The pricing options vary based on user requirements and access needs. Individual users may opt for single-user licenses, while businesses requiring broader access may choose multi-user or enterprise licenses for cost-effective access to the report.
13. Are there any additional resources or data provided in the USA Sports Luggage Industry report?
While the report offers comprehensive insights, it's advisable to review the specific contents or supplementary materials provided to ascertain if additional resources or data are available.
14. How can I stay updated on further developments or reports in the USA Sports Luggage Industry?
To stay informed about further developments, trends, and reports in the USA Sports Luggage Industry, consider subscribing to industry newsletters, following relevant companies and organizations, or regularly checking reputable industry news sources and publications.
Methodology
Step 1 - Identification of Relevant Samples Size from Population Database


Step 2 - Approaches for Defining Global Market Size (Value, Volume* & Price*)

Note*: In applicable scenarios
Step 3 - Data Sources
Primary Research
- Web Analytics
- Survey Reports
- Research Institute
- Latest Research Reports
- Opinion Leaders
Secondary Research
- Annual Reports
- White Paper
- Latest Press Release
- Industry Association
- Paid Database
- Investor Presentations

Step 4 - Data Triangulation
Involves using different sources of information in order to increase the validity of a study
These sources are likely to be stakeholders in a program - participants, other researchers, program staff, other community members, and so on.
Then we put all data in single framework & apply various statistical tools to find out the dynamic on the market.
During the analysis stage, feedback from the stakeholder groups would be compared to determine areas of agreement as well as areas of divergence