

Key Insights
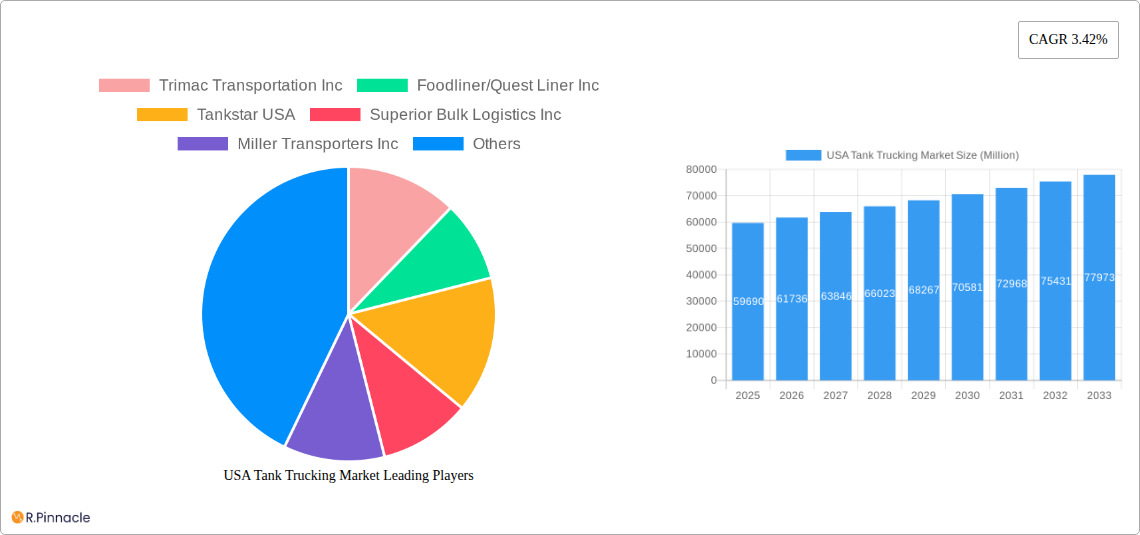
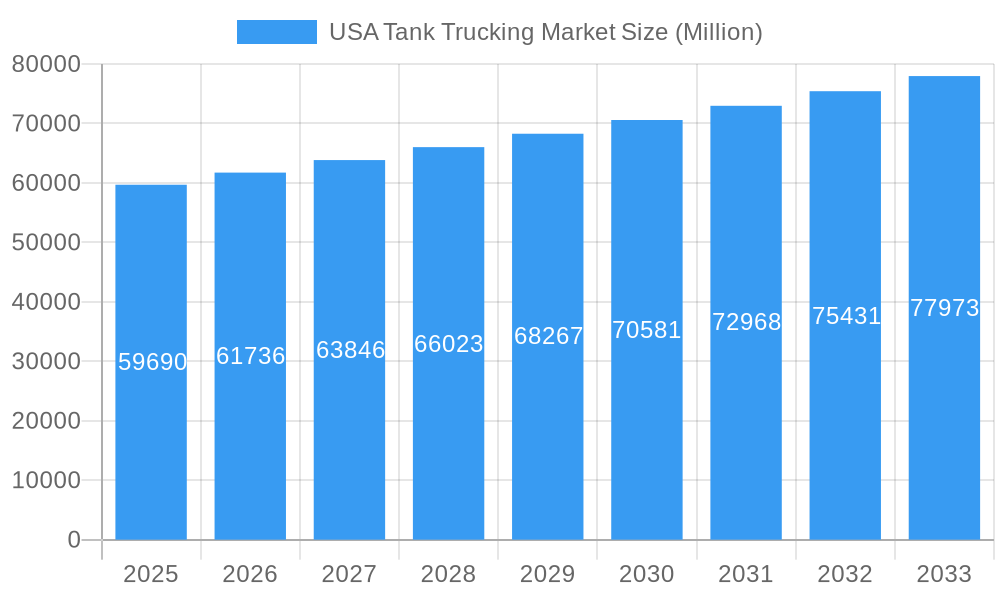
The US Tank Trucking market, valued at $59.69 billion in 2025, is projected to experience steady growth, driven by increasing demand for the transportation of various goods including petroleum products, chemicals, and food & beverages. A compound annual growth rate (CAGR) of 3.42% from 2025 to 2033 indicates a sizeable expansion. Key market drivers include the robust growth of the manufacturing and retail sectors, necessitating efficient and reliable transportation solutions. Expansion of the e-commerce sector also significantly contributes to the demand for timely and secure delivery of various goods, further bolstering the tank trucking market. Segment-wise, the heavy-duty segment is anticipated to dominate due to its capacity to handle large volumes of goods, while the petroleum products segment remains a major contributor owing to the continuous need for fuel transportation. However, challenges remain, such as stringent environmental regulations impacting fuel efficiency and driver shortages affecting operational capacity. Competitive pressures also exist amongst established players like Trimac Transportation, Foodliner/Quest Liner, and Tankstar USA, alongside numerous smaller companies, leading to pricing strategies and operational optimization efforts.
USA Tank Trucking Market Market Size (In Billion)
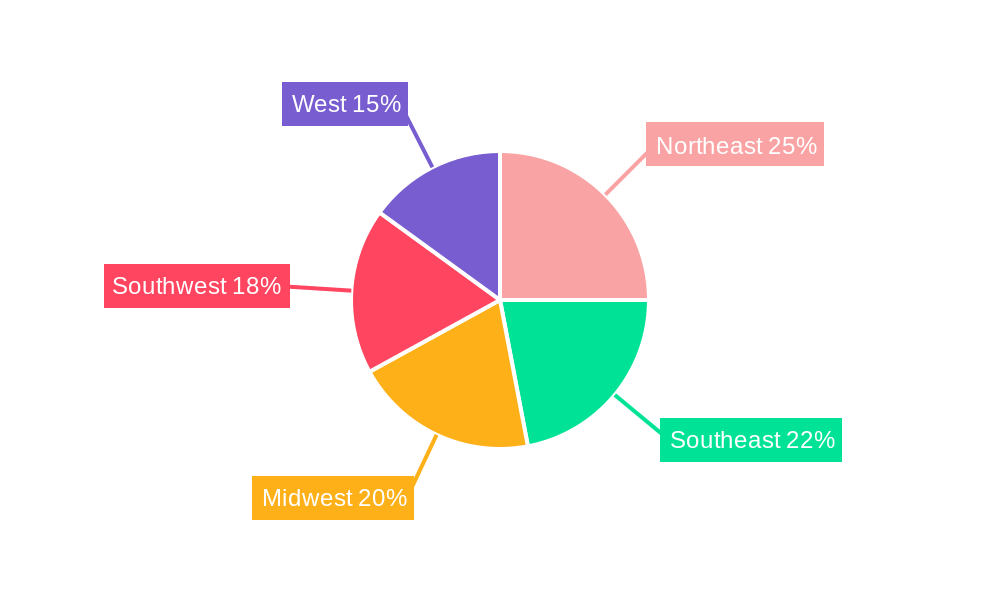
The regional distribution across the United States shows diverse growth patterns. While specific regional data isn't provided, we can infer that regions with significant industrial activity and high population density, such as the Northeast and Southeast, likely hold larger market shares. Future growth is expected to be influenced by factors like infrastructure development, government policies promoting sustainable transportation, and technological advancements in fleet management and safety. This will likely lead to a shift toward more efficient and environmentally friendly trucking solutions, requiring companies to adapt and invest in newer technologies and strategies. The market will likely see consolidation among smaller players and increased adoption of advanced logistics technologies to improve operational efficiency and reduce costs.
USA Tank Trucking Market Company Market Share
USA Tank Trucking Market Report: 2019-2033
This comprehensive report provides an in-depth analysis of the USA Tank Trucking Market, offering invaluable insights for industry professionals, investors, and strategic decision-makers. With a focus on market structure, dynamics, and future trends, this report covers the period from 2019 to 2033, using 2025 as the base year. The report leverages extensive data and analysis to provide actionable intelligence, covering key players like Trimac Transportation Inc, Kenan Advantage Group, and Dupre Logistics LLC, among others.
USA Tank Trucking Market Market Structure & Innovation Trends
The USA tank trucking market is characterized by a moderately consolidated structure, with several large players dominating the landscape. Market share data from 2024 indicates Kenan Advantage Group holds the largest share, followed by Trimac Transportation and Dupre Logistics. However, a significant number of smaller, regional operators also contribute substantially to the overall market volume.
- Market Concentration: High concentration in the heavy-duty segment, with moderate concentration in other segments. xx% market share held by top 5 players in 2024.
- Innovation Drivers: Increasing demand for efficient and environmentally friendly transportation solutions, technological advancements in fleet management and tracking systems, and the rising adoption of automation and AI are key drivers of innovation.
- Regulatory Framework: Stringent regulations regarding safety, emissions, and driver hours significantly impact market operations. The evolving regulatory landscape necessitates continuous adaptation and investment in compliance.
- Product Substitutes: While direct substitutes are limited, alternative transportation modes like rail and pipelines pose indirect competition for specific product categories.
- End-User Demographics: The industry caters to a diverse range of end-users across various sectors, including energy, chemicals, food and beverage, and manufacturing. The demand varies depending on economic activity and consumer spending.
- M&A Activities: The market has witnessed significant M&A activity in recent years, driven by consolidation efforts and expansion strategies. The acquisitions of Northern Dry Bulk by Kenan Advantage Group and AIP Logistics by Trimac Transportation (detailed below) illustrate this trend. Total M&A deal value in the period 2019-2024 is estimated at $xx Million.
USA Tank Trucking Market Market Dynamics & Trends
The USA tank trucking market exhibits a dynamic interplay of several factors influencing its growth trajectory. The market is expected to experience a CAGR of xx% during the forecast period (2025-2033), driven by increasing industrial production, growing e-commerce activity, and the expansion of infrastructure projects.
Technological advancements are disrupting the industry through the introduction of advanced telematics, driver assistance systems, and route optimization software. These technologies enhance operational efficiency, improve safety, and reduce costs. Consumer preferences, influenced by sustainability concerns, are also driving the adoption of cleaner fuels and more environmentally friendly transportation practices. The competitive landscape is intensely competitive, with companies vying for market share through pricing strategies, service differentiation, and technological innovation. Market penetration of advanced telematics systems is estimated at xx% in 2024.
Dominant Regions & Segments in USA Tank Trucking Market
The market exhibits regional variations in growth and performance. The South and Midwest regions are currently the most dominant, driven by strong industrial activity and extensive highway networks. Key factors driving dominance include:
- South: Strong chemical and petroleum industries, extensive highway infrastructure, and favorable regulatory environment.
- Midwest: Significant agricultural production, robust manufacturing sector, and well-developed transportation networks.
By segment, the Heavy Duty segment holds the largest market share in terms of capacity, driven by the high demand for transporting large volumes of bulk goods. The For-hire fleet type dominates the market, catering to a wide range of clients across various sectors. The Petroleum Products category is the most significant in terms of product volume, reflecting the nation's reliance on petroleum-based fuels.
USA Tank Trucking Market Product Innovations
Recent advancements focus on enhancing safety, efficiency, and sustainability. New technologies include improved trailer designs for enhanced load security and fuel efficiency, advanced telematics systems for real-time tracking and fleet management, and the implementation of driver assistance technologies. These innovations aim to reduce operating costs, improve driver safety, and meet growing environmental regulations. The market is witnessing a rising demand for specialized tank trailers designed to carry specific products, catering to diverse industry needs.
Report Scope & Segmentation Analysis
This report segments the USA tank trucking market along multiple dimensions:
By Fleet Type: For-hire (projected growth of xx% during 2025-2033, market size in 2025: $xx Million), Private (projected growth of xx% during 2025-2033, market size in 2025: $xx Million). Competitive dynamics vary significantly between segments, with for-hire operators facing more intense price competition.
By Capacity: Light Duty (projected growth of xx% during 2025-2033, market size in 2025: $xx Million), Medium Duty (projected growth of xx% during 2025-2033, market size in 2025: $xx Million), Heavy Duty (projected growth of xx% during 2025-2033, market size in 2025: $xx Million). Heavy-duty trucks dominate the market due to higher transportation volume.
By Product Category: Crude Petroleum (projected growth of xx% during 2025-2033, market size in 2025: $xx Million), Petroleum Products (Gasoline, Diesel, and Aviation Fuels) (projected growth of xx% during 2025-2033, market size in 2025: $xx Million), Chemicals (projected growth of xx% during 2025-2033, market size in 2025: $xx Million), Food and Beverages (projected growth of xx% during 2025-2033, market size in 2025: $xx Million), Fertilizers (projected growth of xx% during 2025-2033, market size in 2025: $xx Million), Other Product Categories (projected growth of xx% during 2025-2033, market size in 2025: $xx Million). The specific dynamics vary across product categories, with some experiencing faster growth due to increased demand.
Key Drivers of USA Tank Trucking Market Growth
Several factors fuel market growth:
- Increased Industrial Production: Rising manufacturing activity across various sectors boosts the demand for bulk transportation.
- Expanding Infrastructure Projects: Government investments in infrastructure development create opportunities for transporting construction materials and other goods.
- Technological Advancements: Improved vehicle efficiency, telematics systems, and route optimization software reduce operating costs and enhance productivity.
- E-commerce Growth: The rise of online retail expands the need for efficient last-mile delivery solutions for various goods, impacting the demand for smaller capacity tanks.
Challenges in the USA Tank Trucking Market Sector
The market faces several obstacles:
- Driver Shortages: The industry struggles with attracting and retaining qualified drivers, impacting operational capacity and increasing labor costs. The shortage impacts estimated at xx% of total driver capacity.
- Fuel Price Volatility: Fluctuations in fuel prices affect profitability and create operational uncertainties. This impacts operational costs by an estimated xx%.
- Stringent Regulations: Compliance with environmental and safety regulations requires substantial investments, adding to operational expenses.
Emerging Opportunities in USA Tank Trucking Market
Several promising opportunities exist:
- Growth in Specialized Transportation: The increasing demand for transporting specialized products creates opportunities for niche players.
- Adoption of Sustainable Practices: Growing environmental awareness drives the adoption of cleaner fuels and more efficient transportation solutions.
- Technological Integration: The integration of advanced technologies like AI and machine learning offers opportunities for enhanced operational efficiency and safety.
Leading Players in the USA Tank Trucking Market Market
- Trimac Transportation Inc
- Foodliner/Quest Liner Inc
- Tankstar USA
- Superior Bulk Logistics Inc
- Miller Transporters Inc
- Groendyke Transport Inc
- Martin Transport Inc
- Florida Rock & Tank Lines Inc
- Slay Transportation Co Inc
- Apex Logistics LLC
- Mission Petroleum Carriers
- Genox Transportation Inc
- J&M Tank Lines Inc
- CLI Transport LP
- Tidewater Transit Co Inc
- Herman R Ewell Inc
- Service Transport Company
- Schilli Bulk Carriers Group
- Andrews Logistics and CTL Transportation LLC
- Eagle Transport Corp
- Ruan Transportation Management Systems
- Kenan Advantage Group
- Dupre Logistics LLC
Key Developments in USA Tank Trucking Market Industry
- April 2023: Trimac Transportation acquired American Industrial Partners (AIP) Logistics, expanding its bulk terminal services, transportation, and warehousing capabilities.
- February 2024: Kenan Advantage Group acquired Northern Dry Bulk, strengthening its position in the plastic resin transportation and storage market.
Future Outlook for USA Tank Trucking Market Market
The USA tank trucking market is poised for continued growth, driven by increasing industrial activity, technological advancements, and the expanding e-commerce sector. Strategic investments in sustainable practices, technological innovation, and driver recruitment will be crucial for achieving sustained success. The market's future depends on overcoming challenges like driver shortages and fuel price volatility while capitalizing on emerging opportunities in specialized transportation and sustainable solutions.
USA Tank Trucking Market Segmentation
-
1. Fleet Type
- 1.1. For-hire
- 1.2. Private
-
2. Capacity
- 2.1. Light Duty
- 2.2. Medium Duty
- 2.3. Heavy Duty
-
3. Product Category
- 3.1. Crude Petroleum
- 3.2. Petroleu
- 3.3. Chemicals
- 3.4. Food and Beverages
- 3.5. Fertilizers
- 3.6. Other Product Categories
USA Tank Trucking Market Segmentation By Geography
-
1. North America
- 1.1. United States
- 1.2. Canada
- 1.3. Mexico
-
2. South America
- 2.1. Brazil
- 2.2. Argentina
- 2.3. Rest of South America
-
3. Europe
- 3.1. United Kingdom
- 3.2. Germany
- 3.3. France
- 3.4. Italy
- 3.5. Spain
- 3.6. Russia
- 3.7. Benelux
- 3.8. Nordics
- 3.9. Rest of Europe
-
4. Middle East & Africa
- 4.1. Turkey
- 4.2. Israel
- 4.3. GCC
- 4.4. North Africa
- 4.5. South Africa
- 4.6. Rest of Middle East & Africa
-
5. Asia Pacific
- 5.1. China
- 5.2. India
- 5.3. Japan
- 5.4. South Korea
- 5.5. ASEAN
- 5.6. Oceania
- 5.7. Rest of Asia Pacific
USA Tank Trucking Market Regional Market Share
Geographic Coverage of USA Tank Trucking Market
USA Tank Trucking Market REPORT HIGHLIGHTS
| Aspects | Details |
|---|---|
| Study Period | 2020-2034 |
| Base Year | 2025 |
| Estimated Year | 2026 |
| Forecast Period | 2026-2034 |
| Historical Period | 2020-2025 |
| Growth Rate | CAGR of 3.42% from 2020-2034 |
| Segmentation |
|
Table of Contents
- 1. Introduction
- 1.1. Research Scope
- 1.2. Market Segmentation
- 1.3. Research Objective
- 1.4. Definitions and Assumptions
- 2. Executive Summary
- 2.1. Market Snapshot
- 3. Market Dynamics
- 3.1. Market Drivers
- 3.2. Market Restrains
- 3.3. Market Trends
- 3.4. Market Opportunities
- 4. Market Factor Analysis
- 4.1. Porters Five Forces
- 4.1.1. Bargaining Power of Suppliers
- 4.1.2. Bargaining Power of Buyers
- 4.1.3. Threat of New Entrants
- 4.1.4. Threat of Substitutes
- 4.1.5. Competitive Rivalry
- 4.2. PESTEL analysis
- 4.3. BCG Analysis
- 4.3.1. Stars (High Growth, High Market Share)
- 4.3.2. Cash Cows (Low Growth, High Market Share)
- 4.3.3. Question Mark (High Growth, Low Market Share)
- 4.3.4. Dogs (Low Growth, Low Market Share)
- 4.4. Ansoff Matrix Analysis
- 4.5. Supply Chain Analysis
- 4.6. Regulatory Landscape
- 4.7. Current Market Potential and Opportunity Assessment (TAM–SAM–SOM Framework)
- 4.8. PRI Analyst Note
- 4.1. Porters Five Forces
- 5. Market Analysis, Insights and Forecast 2021-2033
- 5.1. Market Analysis, Insights and Forecast - by Fleet Type
- 5.1.1. For-hire
- 5.1.2. Private
- 5.2. Market Analysis, Insights and Forecast - by Capacity
- 5.2.1. Light Duty
- 5.2.2. Medium Duty
- 5.2.3. Heavy Duty
- 5.3. Market Analysis, Insights and Forecast - by Product Category
- 5.3.1. Crude Petroleum
- 5.3.2. Petroleu
- 5.3.3. Chemicals
- 5.3.4. Food and Beverages
- 5.3.5. Fertilizers
- 5.3.6. Other Product Categories
- 5.4. Market Analysis, Insights and Forecast - by Region
- 5.4.1. North America
- 5.4.2. South America
- 5.4.3. Europe
- 5.4.4. Middle East & Africa
- 5.4.5. Asia Pacific
- 5.1. Market Analysis, Insights and Forecast - by Fleet Type
- 6. Global USA Tank Trucking Market Analysis, Insights and Forecast, 2021-2033
- 6.1. Market Analysis, Insights and Forecast - by Fleet Type
- 6.1.1. For-hire
- 6.1.2. Private
- 6.2. Market Analysis, Insights and Forecast - by Capacity
- 6.2.1. Light Duty
- 6.2.2. Medium Duty
- 6.2.3. Heavy Duty
- 6.3. Market Analysis, Insights and Forecast - by Product Category
- 6.3.1. Crude Petroleum
- 6.3.2. Petroleu
- 6.3.3. Chemicals
- 6.3.4. Food and Beverages
- 6.3.5. Fertilizers
- 6.3.6. Other Product Categories
- 6.1. Market Analysis, Insights and Forecast - by Fleet Type
- 7. North America USA Tank Trucking Market Analysis, Insights and Forecast, 2020-2032
- 7.1. Market Analysis, Insights and Forecast - by Fleet Type
- 7.1.1. For-hire
- 7.1.2. Private
- 7.2. Market Analysis, Insights and Forecast - by Capacity
- 7.2.1. Light Duty
- 7.2.2. Medium Duty
- 7.2.3. Heavy Duty
- 7.3. Market Analysis, Insights and Forecast - by Product Category
- 7.3.1. Crude Petroleum
- 7.3.2. Petroleu
- 7.3.3. Chemicals
- 7.3.4. Food and Beverages
- 7.3.5. Fertilizers
- 7.3.6. Other Product Categories
- 7.1. Market Analysis, Insights and Forecast - by Fleet Type
- 8. South America USA Tank Trucking Market Analysis, Insights and Forecast, 2020-2032
- 8.1. Market Analysis, Insights and Forecast - by Fleet Type
- 8.1.1. For-hire
- 8.1.2. Private
- 8.2. Market Analysis, Insights and Forecast - by Capacity
- 8.2.1. Light Duty
- 8.2.2. Medium Duty
- 8.2.3. Heavy Duty
- 8.3. Market Analysis, Insights and Forecast - by Product Category
- 8.3.1. Crude Petroleum
- 8.3.2. Petroleu
- 8.3.3. Chemicals
- 8.3.4. Food and Beverages
- 8.3.5. Fertilizers
- 8.3.6. Other Product Categories
- 8.1. Market Analysis, Insights and Forecast - by Fleet Type
- 9. Europe USA Tank Trucking Market Analysis, Insights and Forecast, 2020-2032
- 9.1. Market Analysis, Insights and Forecast - by Fleet Type
- 9.1.1. For-hire
- 9.1.2. Private
- 9.2. Market Analysis, Insights and Forecast - by Capacity
- 9.2.1. Light Duty
- 9.2.2. Medium Duty
- 9.2.3. Heavy Duty
- 9.3. Market Analysis, Insights and Forecast - by Product Category
- 9.3.1. Crude Petroleum
- 9.3.2. Petroleu
- 9.3.3. Chemicals
- 9.3.4. Food and Beverages
- 9.3.5. Fertilizers
- 9.3.6. Other Product Categories
- 9.1. Market Analysis, Insights and Forecast - by Fleet Type
- 10. Middle East & Africa USA Tank Trucking Market Analysis, Insights and Forecast, 2020-2032
- 10.1. Market Analysis, Insights and Forecast - by Fleet Type
- 10.1.1. For-hire
- 10.1.2. Private
- 10.2. Market Analysis, Insights and Forecast - by Capacity
- 10.2.1. Light Duty
- 10.2.2. Medium Duty
- 10.2.3. Heavy Duty
- 10.3. Market Analysis, Insights and Forecast - by Product Category
- 10.3.1. Crude Petroleum
- 10.3.2. Petroleu
- 10.3.3. Chemicals
- 10.3.4. Food and Beverages
- 10.3.5. Fertilizers
- 10.3.6. Other Product Categories
- 10.1. Market Analysis, Insights and Forecast - by Fleet Type
- 11. Asia Pacific USA Tank Trucking Market Analysis, Insights and Forecast, 2020-2032
- 11.1. Market Analysis, Insights and Forecast - by Fleet Type
- 11.1.1. For-hire
- 11.1.2. Private
- 11.2. Market Analysis, Insights and Forecast - by Capacity
- 11.2.1. Light Duty
- 11.2.2. Medium Duty
- 11.2.3. Heavy Duty
- 11.3. Market Analysis, Insights and Forecast - by Product Category
- 11.3.1. Crude Petroleum
- 11.3.2. Petroleu
- 11.3.3. Chemicals
- 11.3.4. Food and Beverages
- 11.3.5. Fertilizers
- 11.3.6. Other Product Categories
- 11.1. Market Analysis, Insights and Forecast - by Fleet Type
- 12. Competitive Analysis
- 12.1. Company Profiles
- 12.1.1 Trimac Transportation Inc
- 12.1.1.1. Company Overview
- 12.1.1.2. Products
- 12.1.1.3. Company Financials
- 12.1.1.4. SWOT Analysis
- 12.1.2 Foodliner/Quest Liner Inc
- 12.1.2.1. Company Overview
- 12.1.2.2. Products
- 12.1.2.3. Company Financials
- 12.1.2.4. SWOT Analysis
- 12.1.3 Tankstar USA
- 12.1.3.1. Company Overview
- 12.1.3.2. Products
- 12.1.3.3. Company Financials
- 12.1.3.4. SWOT Analysis
- 12.1.4 Superior Bulk Logistics Inc
- 12.1.4.1. Company Overview
- 12.1.4.2. Products
- 12.1.4.3. Company Financials
- 12.1.4.4. SWOT Analysis
- 12.1.5 Miller Transporters Inc
- 12.1.5.1. Company Overview
- 12.1.5.2. Products
- 12.1.5.3. Company Financials
- 12.1.5.4. SWOT Analysis
- 12.1.6 Groendyke Transport Inc
- 12.1.6.1. Company Overview
- 12.1.6.2. Products
- 12.1.6.3. Company Financials
- 12.1.6.4. SWOT Analysis
- 12.1.7 Martin Transport Inc
- 12.1.7.1. Company Overview
- 12.1.7.2. Products
- 12.1.7.3. Company Financials
- 12.1.7.4. SWOT Analysis
- 12.1.8 Florida Rock & Tank Lines Inc **List Not Exhaustive 7 3 Other Companies (Slay Transportation Co Inc Apex Logistics LLC Mission Petroleum Carriers Genox Transportation Inc J&M Tank Lines Inc CLI Transport LP Tidewater Transit Co Inc Herman R Ewell Inc Service Transport Company Schilli Bulk Carriers Group Andrews Logistics and CTL Transportation LLC
- 12.1.8.1. Company Overview
- 12.1.8.2. Products
- 12.1.8.3. Company Financials
- 12.1.8.4. SWOT Analysis
- 12.1.9 Eagle Transport Corp
- 12.1.9.1. Company Overview
- 12.1.9.2. Products
- 12.1.9.3. Company Financials
- 12.1.9.4. SWOT Analysis
- 12.1.10 Ruan Transportation Management Systems
- 12.1.10.1. Company Overview
- 12.1.10.2. Products
- 12.1.10.3. Company Financials
- 12.1.10.4. SWOT Analysis
- 12.1.11 Kenan Advantage Group
- 12.1.11.1. Company Overview
- 12.1.11.2. Products
- 12.1.11.3. Company Financials
- 12.1.11.4. SWOT Analysis
- 12.1.12 Dupre Logistics LLC
- 12.1.12.1. Company Overview
- 12.1.12.2. Products
- 12.1.12.3. Company Financials
- 12.1.12.4. SWOT Analysis
- 12.1.1 Trimac Transportation Inc
- 12.2. Market Entropy
- 12.2.1 Company's Key Areas Served
- 12.2.2 Recent Developments
- 12.3. Company Market Share Analysis 2025
- 12.3.1 Top 5 Companies Market Share Analysis
- 12.3.2 Top 3 Companies Market Share Analysis
- 12.4. List of Potential Customers
- 13. Research Methodology
List of Figures
- Figure 1: Global USA Tank Trucking Market Revenue Breakdown (Million, %) by Region 2025 & 2033
- Figure 2: North America USA Tank Trucking Market Revenue (Million), by Fleet Type 2025 & 2033
- Figure 3: North America USA Tank Trucking Market Revenue Share (%), by Fleet Type 2025 & 2033
- Figure 4: North America USA Tank Trucking Market Revenue (Million), by Capacity 2025 & 2033
- Figure 5: North America USA Tank Trucking Market Revenue Share (%), by Capacity 2025 & 2033
- Figure 6: North America USA Tank Trucking Market Revenue (Million), by Product Category 2025 & 2033
- Figure 7: North America USA Tank Trucking Market Revenue Share (%), by Product Category 2025 & 2033
- Figure 8: North America USA Tank Trucking Market Revenue (Million), by Country 2025 & 2033
- Figure 9: North America USA Tank Trucking Market Revenue Share (%), by Country 2025 & 2033
- Figure 10: South America USA Tank Trucking Market Revenue (Million), by Fleet Type 2025 & 2033
- Figure 11: South America USA Tank Trucking Market Revenue Share (%), by Fleet Type 2025 & 2033
- Figure 12: South America USA Tank Trucking Market Revenue (Million), by Capacity 2025 & 2033
- Figure 13: South America USA Tank Trucking Market Revenue Share (%), by Capacity 2025 & 2033
- Figure 14: South America USA Tank Trucking Market Revenue (Million), by Product Category 2025 & 2033
- Figure 15: South America USA Tank Trucking Market Revenue Share (%), by Product Category 2025 & 2033
- Figure 16: South America USA Tank Trucking Market Revenue (Million), by Country 2025 & 2033
- Figure 17: South America USA Tank Trucking Market Revenue Share (%), by Country 2025 & 2033
- Figure 18: Europe USA Tank Trucking Market Revenue (Million), by Fleet Type 2025 & 2033
- Figure 19: Europe USA Tank Trucking Market Revenue Share (%), by Fleet Type 2025 & 2033
- Figure 20: Europe USA Tank Trucking Market Revenue (Million), by Capacity 2025 & 2033
- Figure 21: Europe USA Tank Trucking Market Revenue Share (%), by Capacity 2025 & 2033
- Figure 22: Europe USA Tank Trucking Market Revenue (Million), by Product Category 2025 & 2033
- Figure 23: Europe USA Tank Trucking Market Revenue Share (%), by Product Category 2025 & 2033
- Figure 24: Europe USA Tank Trucking Market Revenue (Million), by Country 2025 & 2033
- Figure 25: Europe USA Tank Trucking Market Revenue Share (%), by Country 2025 & 2033
- Figure 26: Middle East & Africa USA Tank Trucking Market Revenue (Million), by Fleet Type 2025 & 2033
- Figure 27: Middle East & Africa USA Tank Trucking Market Revenue Share (%), by Fleet Type 2025 & 2033
- Figure 28: Middle East & Africa USA Tank Trucking Market Revenue (Million), by Capacity 2025 & 2033
- Figure 29: Middle East & Africa USA Tank Trucking Market Revenue Share (%), by Capacity 2025 & 2033
- Figure 30: Middle East & Africa USA Tank Trucking Market Revenue (Million), by Product Category 2025 & 2033
- Figure 31: Middle East & Africa USA Tank Trucking Market Revenue Share (%), by Product Category 2025 & 2033
- Figure 32: Middle East & Africa USA Tank Trucking Market Revenue (Million), by Country 2025 & 2033
- Figure 33: Middle East & Africa USA Tank Trucking Market Revenue Share (%), by Country 2025 & 2033
- Figure 34: Asia Pacific USA Tank Trucking Market Revenue (Million), by Fleet Type 2025 & 2033
- Figure 35: Asia Pacific USA Tank Trucking Market Revenue Share (%), by Fleet Type 2025 & 2033
- Figure 36: Asia Pacific USA Tank Trucking Market Revenue (Million), by Capacity 2025 & 2033
- Figure 37: Asia Pacific USA Tank Trucking Market Revenue Share (%), by Capacity 2025 & 2033
- Figure 38: Asia Pacific USA Tank Trucking Market Revenue (Million), by Product Category 2025 & 2033
- Figure 39: Asia Pacific USA Tank Trucking Market Revenue Share (%), by Product Category 2025 & 2033
- Figure 40: Asia Pacific USA Tank Trucking Market Revenue (Million), by Country 2025 & 2033
- Figure 41: Asia Pacific USA Tank Trucking Market Revenue Share (%), by Country 2025 & 2033
List of Tables
- Table 1: Global USA Tank Trucking Market Revenue Million Forecast, by Fleet Type 2020 & 2033
- Table 2: Global USA Tank Trucking Market Revenue Million Forecast, by Capacity 2020 & 2033
- Table 3: Global USA Tank Trucking Market Revenue Million Forecast, by Product Category 2020 & 2033
- Table 4: Global USA Tank Trucking Market Revenue Million Forecast, by Region 2020 & 2033
- Table 5: Global USA Tank Trucking Market Revenue Million Forecast, by Fleet Type 2020 & 2033
- Table 6: Global USA Tank Trucking Market Revenue Million Forecast, by Capacity 2020 & 2033
- Table 7: Global USA Tank Trucking Market Revenue Million Forecast, by Product Category 2020 & 2033
- Table 8: Global USA Tank Trucking Market Revenue Million Forecast, by Country 2020 & 2033
- Table 9: United States USA Tank Trucking Market Revenue (Million) Forecast, by Application 2020 & 2033
- Table 10: Canada USA Tank Trucking Market Revenue (Million) Forecast, by Application 2020 & 2033
- Table 11: Mexico USA Tank Trucking Market Revenue (Million) Forecast, by Application 2020 & 2033
- Table 12: Global USA Tank Trucking Market Revenue Million Forecast, by Fleet Type 2020 & 2033
- Table 13: Global USA Tank Trucking Market Revenue Million Forecast, by Capacity 2020 & 2033
- Table 14: Global USA Tank Trucking Market Revenue Million Forecast, by Product Category 2020 & 2033
- Table 15: Global USA Tank Trucking Market Revenue Million Forecast, by Country 2020 & 2033
- Table 16: Brazil USA Tank Trucking Market Revenue (Million) Forecast, by Application 2020 & 2033
- Table 17: Argentina USA Tank Trucking Market Revenue (Million) Forecast, by Application 2020 & 2033
- Table 18: Rest of South America USA Tank Trucking Market Revenue (Million) Forecast, by Application 2020 & 2033
- Table 19: Global USA Tank Trucking Market Revenue Million Forecast, by Fleet Type 2020 & 2033
- Table 20: Global USA Tank Trucking Market Revenue Million Forecast, by Capacity 2020 & 2033
- Table 21: Global USA Tank Trucking Market Revenue Million Forecast, by Product Category 2020 & 2033
- Table 22: Global USA Tank Trucking Market Revenue Million Forecast, by Country 2020 & 2033
- Table 23: United Kingdom USA Tank Trucking Market Revenue (Million) Forecast, by Application 2020 & 2033
- Table 24: Germany USA Tank Trucking Market Revenue (Million) Forecast, by Application 2020 & 2033
- Table 25: France USA Tank Trucking Market Revenue (Million) Forecast, by Application 2020 & 2033
- Table 26: Italy USA Tank Trucking Market Revenue (Million) Forecast, by Application 2020 & 2033
- Table 27: Spain USA Tank Trucking Market Revenue (Million) Forecast, by Application 2020 & 2033
- Table 28: Russia USA Tank Trucking Market Revenue (Million) Forecast, by Application 2020 & 2033
- Table 29: Benelux USA Tank Trucking Market Revenue (Million) Forecast, by Application 2020 & 2033
- Table 30: Nordics USA Tank Trucking Market Revenue (Million) Forecast, by Application 2020 & 2033
- Table 31: Rest of Europe USA Tank Trucking Market Revenue (Million) Forecast, by Application 2020 & 2033
- Table 32: Global USA Tank Trucking Market Revenue Million Forecast, by Fleet Type 2020 & 2033
- Table 33: Global USA Tank Trucking Market Revenue Million Forecast, by Capacity 2020 & 2033
- Table 34: Global USA Tank Trucking Market Revenue Million Forecast, by Product Category 2020 & 2033
- Table 35: Global USA Tank Trucking Market Revenue Million Forecast, by Country 2020 & 2033
- Table 36: Turkey USA Tank Trucking Market Revenue (Million) Forecast, by Application 2020 & 2033
- Table 37: Israel USA Tank Trucking Market Revenue (Million) Forecast, by Application 2020 & 2033
- Table 38: GCC USA Tank Trucking Market Revenue (Million) Forecast, by Application 2020 & 2033
- Table 39: North Africa USA Tank Trucking Market Revenue (Million) Forecast, by Application 2020 & 2033
- Table 40: South Africa USA Tank Trucking Market Revenue (Million) Forecast, by Application 2020 & 2033
- Table 41: Rest of Middle East & Africa USA Tank Trucking Market Revenue (Million) Forecast, by Application 2020 & 2033
- Table 42: Global USA Tank Trucking Market Revenue Million Forecast, by Fleet Type 2020 & 2033
- Table 43: Global USA Tank Trucking Market Revenue Million Forecast, by Capacity 2020 & 2033
- Table 44: Global USA Tank Trucking Market Revenue Million Forecast, by Product Category 2020 & 2033
- Table 45: Global USA Tank Trucking Market Revenue Million Forecast, by Country 2020 & 2033
- Table 46: China USA Tank Trucking Market Revenue (Million) Forecast, by Application 2020 & 2033
- Table 47: India USA Tank Trucking Market Revenue (Million) Forecast, by Application 2020 & 2033
- Table 48: Japan USA Tank Trucking Market Revenue (Million) Forecast, by Application 2020 & 2033
- Table 49: South Korea USA Tank Trucking Market Revenue (Million) Forecast, by Application 2020 & 2033
- Table 50: ASEAN USA Tank Trucking Market Revenue (Million) Forecast, by Application 2020 & 2033
- Table 51: Oceania USA Tank Trucking Market Revenue (Million) Forecast, by Application 2020 & 2033
- Table 52: Rest of Asia Pacific USA Tank Trucking Market Revenue (Million) Forecast, by Application 2020 & 2033
Frequently Asked Questions
1. What is the projected Compound Annual Growth Rate (CAGR) of the USA Tank Trucking Market?
The projected CAGR is approximately 3.42%.
2. Which companies are prominent players in the USA Tank Trucking Market?
Key companies in the market include Trimac Transportation Inc, Foodliner/Quest Liner Inc, Tankstar USA, Superior Bulk Logistics Inc, Miller Transporters Inc, Groendyke Transport Inc, Martin Transport Inc, Florida Rock & Tank Lines Inc **List Not Exhaustive 7 3 Other Companies (Slay Transportation Co Inc Apex Logistics LLC Mission Petroleum Carriers Genox Transportation Inc J&M Tank Lines Inc CLI Transport LP Tidewater Transit Co Inc Herman R Ewell Inc Service Transport Company Schilli Bulk Carriers Group Andrews Logistics and CTL Transportation LLC, Eagle Transport Corp, Ruan Transportation Management Systems, Kenan Advantage Group, Dupre Logistics LLC.
3. What are the main segments of the USA Tank Trucking Market?
The market segments include Fleet Type, Capacity, Product Category.
4. Can you provide details about the market size?
The market size is estimated to be USD 59.69 Million as of 2022.
5. What are some drivers contributing to market growth?
Rise in Demand for Oil and Natural Gas; Technological Advancements.
6. What are the notable trends driving market growth?
Fuel Tank Trailers as Petroleum Carriers are Boosting the Market's Growth in the United States.
7. Are there any restraints impacting market growth?
Increasing Regulatory Burden and Compliance Costs; Volatility of Fuel Prices.
8. Can you provide examples of recent developments in the market?
February 2024: Kenan Advantage Group, the largest tank truck transporter and logistics provider in North America, acquired Northern Dry Bulk, a company specializing in the transportation and storage of plastic resins for clients in the automotive, packaging, and electronics sectors across the United States and Canada. This acquisition brought 36 tractors, 91 trailers, and two terminals with two maintenance bays, along with warehouse space and trans-loading capabilities, into the KAG portfolio.
9. What pricing options are available for accessing the report?
Pricing options include single-user, multi-user, and enterprise licenses priced at USD 3800, USD 4500, and USD 5800 respectively.
10. Is the market size provided in terms of value or volume?
The market size is provided in terms of value, measured in Million.
11. Are there any specific market keywords associated with the report?
Yes, the market keyword associated with the report is "USA Tank Trucking Market," which aids in identifying and referencing the specific market segment covered.
12. How do I determine which pricing option suits my needs best?
The pricing options vary based on user requirements and access needs. Individual users may opt for single-user licenses, while businesses requiring broader access may choose multi-user or enterprise licenses for cost-effective access to the report.
13. Are there any additional resources or data provided in the USA Tank Trucking Market report?
While the report offers comprehensive insights, it's advisable to review the specific contents or supplementary materials provided to ascertain if additional resources or data are available.
14. How can I stay updated on further developments or reports in the USA Tank Trucking Market?
To stay informed about further developments, trends, and reports in the USA Tank Trucking Market, consider subscribing to industry newsletters, following relevant companies and organizations, or regularly checking reputable industry news sources and publications.
Methodology
Step 1 - Identification of Relevant Samples Size from Population Database


Step 2 - Approaches for Defining Global Market Size (Value, Volume* & Price*)

Note*: In applicable scenarios
Step 3 - Data Sources
Primary Research
- Web Analytics
- Survey Reports
- Research Institute
- Latest Research Reports
- Opinion Leaders
Secondary Research
- Annual Reports
- White Paper
- Latest Press Release
- Industry Association
- Paid Database
- Investor Presentations

Step 4 - Data Triangulation
Involves using different sources of information in order to increase the validity of a study
These sources are likely to be stakeholders in a program - participants, other researchers, program staff, other community members, and so on.
Then we put all data in single framework & apply various statistical tools to find out the dynamic on the market.
During the analysis stage, feedback from the stakeholder groups would be compared to determine areas of agreement as well as areas of divergence