

Key Insights
The global vibration level switch market is poised for substantial expansion, projected to reach $867 million by 2033, driven by a compound annual growth rate (CAGR) of 5.7%. Key growth drivers include escalating industrial automation across chemical processing, food and beverage, and oil and gas sectors. Vibration level switches offer a cost-effective, low-maintenance alternative to complex technologies. Growing demand for process optimization and enhanced safety protocols further bolsters market prospects. The rise of wireless connectivity facilitates remote monitoring and control, improving operational efficiency and reducing downtime. While wired connectivity currently dominates, wireless solutions are rapidly gaining traction, particularly in industries prioritizing data analytics and remote access. Liquid applications represent the largest segment, aligning with prevalent industrial processes. North America and Europe lead in market share due to established infrastructure and stringent regulations, with the Asia-Pacific region, particularly China and India, expected to experience the most rapid growth driven by industrialization and development.
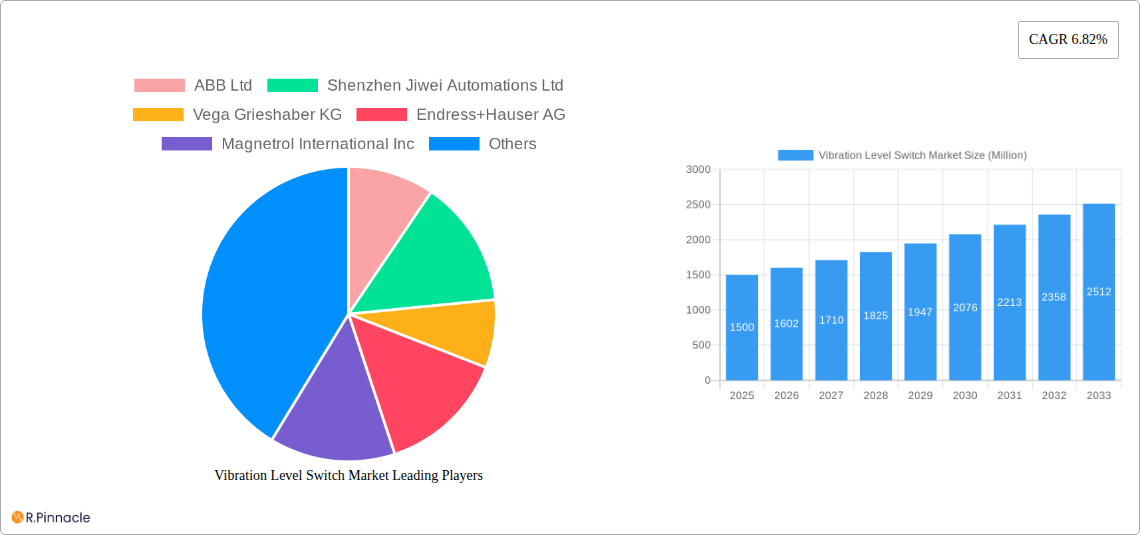
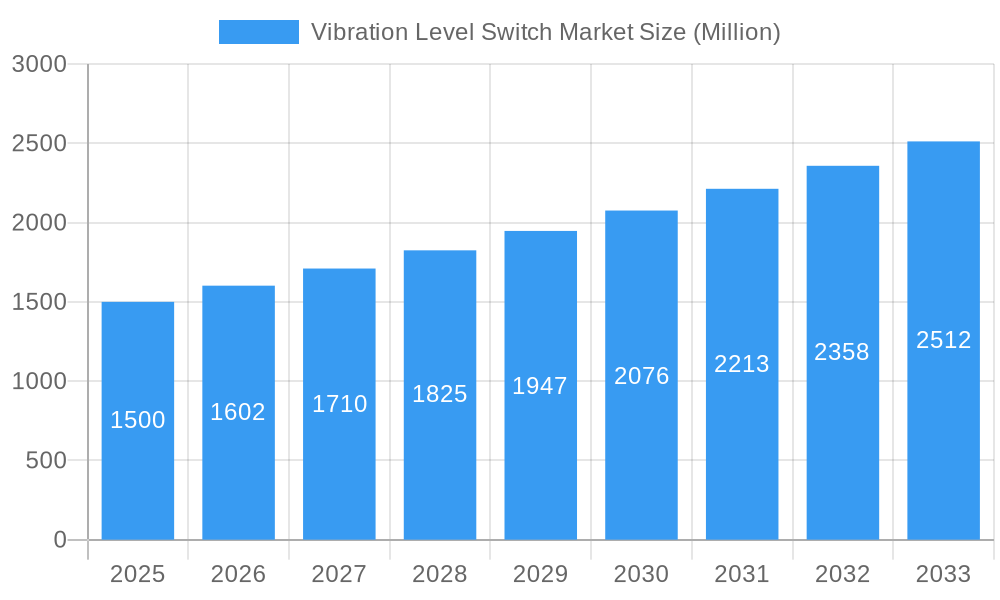
Vibration Level Switch Market Market Size (In Million)
The competitive landscape features established players such as ABB, Endress+Hauser, and Emerson Electric, alongside regional manufacturers. Continuous innovation in vibrating fork and rod technologies drives product differentiation. The integration of smart sensors and data analytics is shaping the future of vibration level switches, enabling predictive maintenance and advanced process control. Potential restraints, like environmental vibration interference and calibration needs, are being addressed through ongoing technological advancements. The market's outlook remains highly positive, with sustained growth anticipated across all segments and regions, fueled by increasing automation and a focus on efficient, safe industrial operations.
Vibration Level Switch Market Company Market Share
Vibration Level Switch Market Analysis: Size, Trends, and Forecast (2025-2033)
This comprehensive report analyzes the global vibration level switch market from 2025 to 2033, offering critical insights for industry stakeholders. The analysis covers market segmentation by connectivity type (wired, wireless), application (liquids, solids), end-user industry (chemical, food and beverage, metal and mining, oil and gas, water and wastewater, others), and technology (vibrating fork, vibrating rod). Key market participants include ABB Ltd, Shenzhen Jiwei Automations Ltd, Vega Grieshaber KG, Endress+Hauser AG, Magnetrol International Inc, Trumen Technologies Pvt Ltd, OleumTech Corporation, Emerson Electric Co, Siemens AG, Dwyer Instruments Inc, Yamamoto Electric Industrial Co Ltd, Sapcon Instruments Pvt Ltd, FineTek Co Ltd, and KROHNE Group.
Vibration Level Switch Market Market Structure & Innovation Trends
This section analyzes the competitive landscape, innovation drivers, and regulatory aspects of the vibration level switch market. We examine market concentration, revealing the market share held by leading players like ABB Ltd and Endress+Hauser AG. The report quantifies the impact of mergers and acquisitions (M&A) activities, estimating the total value of deals in the xx Million range over the past five years. Innovation is analyzed through the lens of technological advancements in sensor technology and wireless communication, impacting product design and functionalities. The influence of regulatory frameworks on safety and environmental compliance is detailed, including an assessment of relevant industry standards. Further, the report explores the emergence of substitute technologies and their potential impact on market growth. Finally, end-user demographics and their evolving needs are examined, along with future trends shaping the market.
Vibration Level Switch Market Market Dynamics & Trends
The global vibration level switch market is poised for significant growth, driven by factors such as the increasing demand for automation in various industries and the rising adoption of smart manufacturing technologies. The report projects a Compound Annual Growth Rate (CAGR) of xx% during the forecast period (2025-2033). Technological disruptions, particularly in the areas of IoT connectivity and advanced sensor technologies, are transforming the market. Consumer preferences are shifting towards more reliable, efficient, and cost-effective solutions. This section will extensively analyze the competitive dynamics, including strategies adopted by major players, such as strategic partnerships, new product launches, and geographical expansion. Market penetration rates across different end-user industries are analyzed, highlighting regional variations and growth opportunities.
Dominant Regions & Segments in Vibration Level Switch Market
This section identifies the leading regions and segments within the vibration level switch market. Based on our analysis, the region of [Insert Leading Region, e.g., North America] currently dominates the market, driven by factors such as [Insert Key Drivers, e.g., robust industrial infrastructure, stringent environmental regulations].
- Key Drivers in [Leading Region]:
- Strong industrial growth.
- Government initiatives promoting automation.
- High adoption of advanced technologies.
The dominant segment by type of connectivity is [Insert Dominant Segment, e.g., Wired], driven by its reliability and established integration in existing industrial systems. Similarly, the leading application segment is [Insert Dominant Segment, e.g., Liquids], while [Insert Dominant Segment, e.g., Chemical] leads among end-user industries. The dominant technology is [Insert Dominant Segment, e.g., Vibrating Fork], due to its cost-effectiveness and proven performance. Each segment's dominance is explained in detail, considering factors like technological advancements, regulatory changes, and market penetration.
Vibration Level Switch Market Product Innovations
Recent years have witnessed significant product innovations in the vibration level switch market. Manufacturers are focusing on developing smaller, more energy-efficient, and smarter devices with improved accuracy and reliability. The integration of advanced communication protocols like wireless technologies and improved sensor designs are enhancing the performance and capabilities of these switches. These innovations are driving market growth by offering end-users more precise and versatile solutions for various applications in diverse industrial sectors.
Report Scope & Segmentation Analysis
This report segments the vibration level switch market based on type of connectivity (Wired, Wireless), application (Liquids, Solids), end-user industry (Chemical, Food and Beverage, Metal and Mining, Oil and Gas, Water and Wastewater, Other End-User Industries), and technology (Vibrating Fork, Vibrating Rod). Each segment’s growth projections, market size, and competitive dynamics are analyzed, providing a comprehensive understanding of the market's structure and future trends. For example, the wired segment holds a significant market share due to its reliability, while the wireless segment is growing rapidly driven by advancements in wireless communication technologies.
Key Drivers of Vibration Level Switch Market Growth
Several factors are driving the growth of the vibration level switch market. Increasing automation in various industries, particularly in chemical processing, food and beverage production, and oil and gas extraction, is a key driver. Government regulations mandating improved process control and safety are also contributing to market expansion. Furthermore, the rise of smart manufacturing and Industry 4.0 initiatives is boosting demand for advanced sensor technologies, including vibration level switches.
Challenges in the Vibration Level Switch Market Sector
The vibration level switch market faces challenges including fluctuating raw material prices impacting production costs and potentially lowering profit margins. Supply chain disruptions and competition from alternative technologies pose additional difficulties. Meeting stringent safety and environmental regulations also present challenges for manufacturers. These factors can impact market growth and profitability.
Emerging Opportunities in Vibration Level Switch Market
Emerging opportunities exist in the development of integrated level sensing systems with advanced data analytics capabilities. Growth is also expected in the adoption of wireless technologies and the expansion into new, high-growth end-user industries. Focus on developing energy-efficient and eco-friendly solutions presents significant market opportunities. These trends suggest significant potential for growth in the future.
Leading Players in the Vibration Level Switch Market Market
- ABB Ltd
- Shenzhen Jiwei Automations Ltd
- Vega Grieshaber KG
- Endress+Hauser AG
- Magnetrol International Inc
- Trumen Technologies Pvt Ltd
- OleumTech Corporation
- Emerson Electric Co
- Siemens AG
- Dwyer Instruments Inc
- Yamamoto Electric Industrial Co Ltd
- Sapcon Instruments Pvt Ltd
- FineTek Co Ltd
- KROHNE Group
Key Developments in Vibration Level Switch Market Industry
- Jan 2023: ABB Ltd launched a new line of vibration level switches with enhanced connectivity features.
- May 2022: Endress+Hauser AG acquired a smaller sensor technology company, expanding its product portfolio.
- Oct 2021: Siemens AG partnered with a software provider to integrate its vibration level switches into industrial IoT platforms.
- [Add further developments with year/month and brief description]
Future Outlook for Vibration Level Switch Market Market
The future of the vibration level switch market looks promising, driven by continued growth in automation across diverse industries, technological advancements leading to improved product features, and the expanding adoption of smart manufacturing practices. Strategic partnerships and acquisitions are expected to shape the market landscape, while a focus on sustainability and energy efficiency will drive further innovation. The market is projected to experience steady growth in the coming years, offering significant opportunities for established players and new entrants alike.
Vibration Level Switch Market Segmentation
-
1. Technlogy
- 1.1. Vibrating Fork
- 1.2. Vibrating Rod
-
2. Type of Connectivity
- 2.1. Wired
- 2.2. Wireless
-
3. Application
- 3.1. Liquids
- 3.2. Solids
-
4. End-User Industry
- 4.1. Chemical
- 4.2. Food and Beverage
- 4.3. Metal and Mining
- 4.4. Oil and Gas
- 4.5. Water and Wastewater
- 4.6. Other End-User Industries
Vibration Level Switch Market Segmentation By Geography
- 1. North America
- 2. Europe
- 3. Asia Pacific
- 4. Latin America
- 5. Middle East and Africa
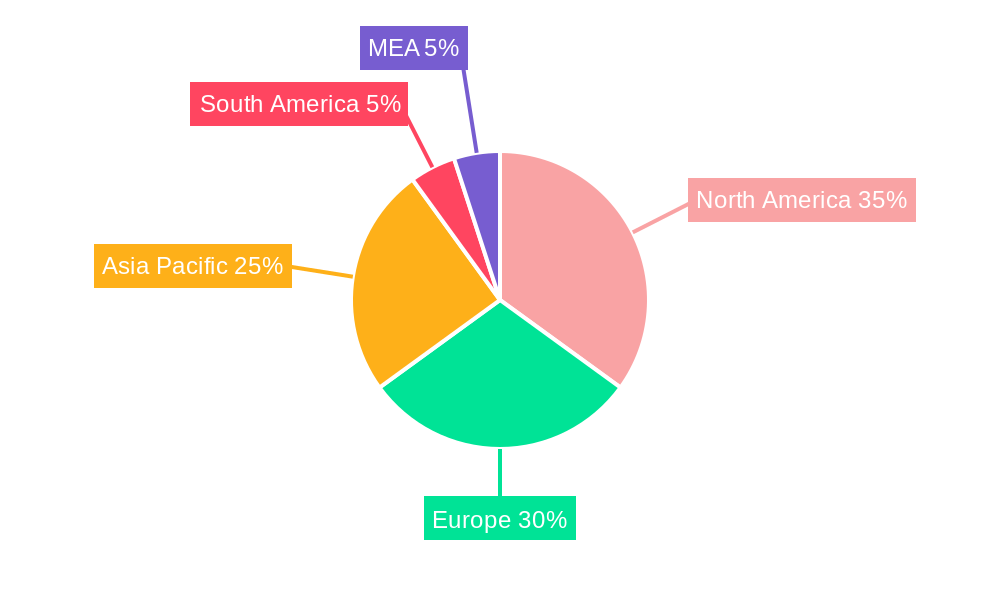
Vibration Level Switch Market Regional Market Share
Geographic Coverage of Vibration Level Switch Market
Vibration Level Switch Market REPORT HIGHLIGHTS
| Aspects | Details |
|---|---|
| Study Period | 2020-2034 |
| Base Year | 2025 |
| Estimated Year | 2026 |
| Forecast Period | 2026-2034 |
| Historical Period | 2020-2025 |
| Growth Rate | CAGR of 5.7% from 2020-2034 |
| Segmentation |
|
Table of Contents
- 1. Introduction
- 1.1. Research Scope
- 1.2. Market Segmentation
- 1.3. Research Objective
- 1.4. Definitions and Assumptions
- 2. Executive Summary
- 2.1. Market Snapshot
- 3. Market Dynamics
- 3.1. Market Drivers
- 3.2. Market Restrains
- 3.3. Market Trends
- 3.4. Market Opportunities
- 4. Market Factor Analysis
- 4.1. Porters Five Forces
- 4.1.1. Bargaining Power of Suppliers
- 4.1.2. Bargaining Power of Buyers
- 4.1.3. Threat of New Entrants
- 4.1.4. Threat of Substitutes
- 4.1.5. Competitive Rivalry
- 4.2. PESTEL analysis
- 4.3. BCG Analysis
- 4.3.1. Stars (High Growth, High Market Share)
- 4.3.2. Cash Cows (Low Growth, High Market Share)
- 4.3.3. Question Mark (High Growth, Low Market Share)
- 4.3.4. Dogs (Low Growth, Low Market Share)
- 4.4. Ansoff Matrix Analysis
- 4.5. Supply Chain Analysis
- 4.6. Regulatory Landscape
- 4.7. Current Market Potential and Opportunity Assessment (TAM–SAM–SOM Framework)
- 4.8. PRI Analyst Note
- 4.1. Porters Five Forces
- 5. Market Analysis, Insights and Forecast 2021-2033
- 5.1. Market Analysis, Insights and Forecast - by Technlogy
- 5.1.1. Vibrating Fork
- 5.1.2. Vibrating Rod
- 5.2. Market Analysis, Insights and Forecast - by Type of Connectivity
- 5.2.1. Wired
- 5.2.2. Wireless
- 5.3. Market Analysis, Insights and Forecast - by Application
- 5.3.1. Liquids
- 5.3.2. Solids
- 5.4. Market Analysis, Insights and Forecast - by End-User Industry
- 5.4.1. Chemical
- 5.4.2. Food and Beverage
- 5.4.3. Metal and Mining
- 5.4.4. Oil and Gas
- 5.4.5. Water and Wastewater
- 5.4.6. Other End-User Industries
- 5.5. Market Analysis, Insights and Forecast - by Region
- 5.5.1. North America
- 5.5.2. Europe
- 5.5.3. Asia Pacific
- 5.5.4. Latin America
- 5.5.5. Middle East and Africa
- 5.1. Market Analysis, Insights and Forecast - by Technlogy
- 6. Global Vibration Level Switch Market Analysis, Insights and Forecast, 2021-2033
- 6.1. Market Analysis, Insights and Forecast - by Technlogy
- 6.1.1. Vibrating Fork
- 6.1.2. Vibrating Rod
- 6.2. Market Analysis, Insights and Forecast - by Type of Connectivity
- 6.2.1. Wired
- 6.2.2. Wireless
- 6.3. Market Analysis, Insights and Forecast - by Application
- 6.3.1. Liquids
- 6.3.2. Solids
- 6.4. Market Analysis, Insights and Forecast - by End-User Industry
- 6.4.1. Chemical
- 6.4.2. Food and Beverage
- 6.4.3. Metal and Mining
- 6.4.4. Oil and Gas
- 6.4.5. Water and Wastewater
- 6.4.6. Other End-User Industries
- 6.1. Market Analysis, Insights and Forecast - by Technlogy
- 7. North America Vibration Level Switch Market Analysis, Insights and Forecast, 2020-2032
- 7.1. Market Analysis, Insights and Forecast - by Technlogy
- 7.1.1. Vibrating Fork
- 7.1.2. Vibrating Rod
- 7.2. Market Analysis, Insights and Forecast - by Type of Connectivity
- 7.2.1. Wired
- 7.2.2. Wireless
- 7.3. Market Analysis, Insights and Forecast - by Application
- 7.3.1. Liquids
- 7.3.2. Solids
- 7.4. Market Analysis, Insights and Forecast - by End-User Industry
- 7.4.1. Chemical
- 7.4.2. Food and Beverage
- 7.4.3. Metal and Mining
- 7.4.4. Oil and Gas
- 7.4.5. Water and Wastewater
- 7.4.6. Other End-User Industries
- 7.1. Market Analysis, Insights and Forecast - by Technlogy
- 8. Europe Vibration Level Switch Market Analysis, Insights and Forecast, 2020-2032
- 8.1. Market Analysis, Insights and Forecast - by Technlogy
- 8.1.1. Vibrating Fork
- 8.1.2. Vibrating Rod
- 8.2. Market Analysis, Insights and Forecast - by Type of Connectivity
- 8.2.1. Wired
- 8.2.2. Wireless
- 8.3. Market Analysis, Insights and Forecast - by Application
- 8.3.1. Liquids
- 8.3.2. Solids
- 8.4. Market Analysis, Insights and Forecast - by End-User Industry
- 8.4.1. Chemical
- 8.4.2. Food and Beverage
- 8.4.3. Metal and Mining
- 8.4.4. Oil and Gas
- 8.4.5. Water and Wastewater
- 8.4.6. Other End-User Industries
- 8.1. Market Analysis, Insights and Forecast - by Technlogy
- 9. Asia Pacific Vibration Level Switch Market Analysis, Insights and Forecast, 2020-2032
- 9.1. Market Analysis, Insights and Forecast - by Technlogy
- 9.1.1. Vibrating Fork
- 9.1.2. Vibrating Rod
- 9.2. Market Analysis, Insights and Forecast - by Type of Connectivity
- 9.2.1. Wired
- 9.2.2. Wireless
- 9.3. Market Analysis, Insights and Forecast - by Application
- 9.3.1. Liquids
- 9.3.2. Solids
- 9.4. Market Analysis, Insights and Forecast - by End-User Industry
- 9.4.1. Chemical
- 9.4.2. Food and Beverage
- 9.4.3. Metal and Mining
- 9.4.4. Oil and Gas
- 9.4.5. Water and Wastewater
- 9.4.6. Other End-User Industries
- 9.1. Market Analysis, Insights and Forecast - by Technlogy
- 10. Latin America Vibration Level Switch Market Analysis, Insights and Forecast, 2020-2032
- 10.1. Market Analysis, Insights and Forecast - by Technlogy
- 10.1.1. Vibrating Fork
- 10.1.2. Vibrating Rod
- 10.2. Market Analysis, Insights and Forecast - by Type of Connectivity
- 10.2.1. Wired
- 10.2.2. Wireless
- 10.3. Market Analysis, Insights and Forecast - by Application
- 10.3.1. Liquids
- 10.3.2. Solids
- 10.4. Market Analysis, Insights and Forecast - by End-User Industry
- 10.4.1. Chemical
- 10.4.2. Food and Beverage
- 10.4.3. Metal and Mining
- 10.4.4. Oil and Gas
- 10.4.5. Water and Wastewater
- 10.4.6. Other End-User Industries
- 10.1. Market Analysis, Insights and Forecast - by Technlogy
- 11. Middle East and Africa Vibration Level Switch Market Analysis, Insights and Forecast, 2020-2032
- 11.1. Market Analysis, Insights and Forecast - by Technlogy
- 11.1.1. Vibrating Fork
- 11.1.2. Vibrating Rod
- 11.2. Market Analysis, Insights and Forecast - by Type of Connectivity
- 11.2.1. Wired
- 11.2.2. Wireless
- 11.3. Market Analysis, Insights and Forecast - by Application
- 11.3.1. Liquids
- 11.3.2. Solids
- 11.4. Market Analysis, Insights and Forecast - by End-User Industry
- 11.4.1. Chemical
- 11.4.2. Food and Beverage
- 11.4.3. Metal and Mining
- 11.4.4. Oil and Gas
- 11.4.5. Water and Wastewater
- 11.4.6. Other End-User Industries
- 11.1. Market Analysis, Insights and Forecast - by Technlogy
- 12. Competitive Analysis
- 12.1. Company Profiles
- 12.1.1 ABB Ltd
- 12.1.1.1. Company Overview
- 12.1.1.2. Products
- 12.1.1.3. Company Financials
- 12.1.1.4. SWOT Analysis
- 12.1.2 Shenzhen Jiwei Automations Ltd
- 12.1.2.1. Company Overview
- 12.1.2.2. Products
- 12.1.2.3. Company Financials
- 12.1.2.4. SWOT Analysis
- 12.1.3 Vega Grieshaber KG
- 12.1.3.1. Company Overview
- 12.1.3.2. Products
- 12.1.3.3. Company Financials
- 12.1.3.4. SWOT Analysis
- 12.1.4 Endress+Hauser AG
- 12.1.4.1. Company Overview
- 12.1.4.2. Products
- 12.1.4.3. Company Financials
- 12.1.4.4. SWOT Analysis
- 12.1.5 Magnetrol International Inc
- 12.1.5.1. Company Overview
- 12.1.5.2. Products
- 12.1.5.3. Company Financials
- 12.1.5.4. SWOT Analysis
- 12.1.6 Trumen Technologies Pvt Ltd
- 12.1.6.1. Company Overview
- 12.1.6.2. Products
- 12.1.6.3. Company Financials
- 12.1.6.4. SWOT Analysis
- 12.1.7 OleumTech Corporation
- 12.1.7.1. Company Overview
- 12.1.7.2. Products
- 12.1.7.3. Company Financials
- 12.1.7.4. SWOT Analysis
- 12.1.8 Emerson Electric Co
- 12.1.8.1. Company Overview
- 12.1.8.2. Products
- 12.1.8.3. Company Financials
- 12.1.8.4. SWOT Analysis
- 12.1.9 Siemens AG
- 12.1.9.1. Company Overview
- 12.1.9.2. Products
- 12.1.9.3. Company Financials
- 12.1.9.4. SWOT Analysis
- 12.1.10 Dwyer Instruments Inc
- 12.1.10.1. Company Overview
- 12.1.10.2. Products
- 12.1.10.3. Company Financials
- 12.1.10.4. SWOT Analysis
- 12.1.11 Yamamoto Electric Industrial Co Ltd
- 12.1.11.1. Company Overview
- 12.1.11.2. Products
- 12.1.11.3. Company Financials
- 12.1.11.4. SWOT Analysis
- 12.1.12 Sapcon Instruments Pvt Ltd
- 12.1.12.1. Company Overview
- 12.1.12.2. Products
- 12.1.12.3. Company Financials
- 12.1.12.4. SWOT Analysis
- 12.1.13 FineTek Co Ltd
- 12.1.13.1. Company Overview
- 12.1.13.2. Products
- 12.1.13.3. Company Financials
- 12.1.13.4. SWOT Analysis
- 12.1.14 KROHNE Group
- 12.1.14.1. Company Overview
- 12.1.14.2. Products
- 12.1.14.3. Company Financials
- 12.1.14.4. SWOT Analysis
- 12.1.1 ABB Ltd
- 12.2. Market Entropy
- 12.2.1 Company's Key Areas Served
- 12.2.2 Recent Developments
- 12.3. Company Market Share Analysis 2025
- 12.3.1 Top 5 Companies Market Share Analysis
- 12.3.2 Top 3 Companies Market Share Analysis
- 12.4. List of Potential Customers
- 13. Research Methodology
List of Figures
- Figure 1: Global Vibration Level Switch Market Revenue Breakdown (million, %) by Region 2025 & 2033
- Figure 2: Global Vibration Level Switch Market Volume Breakdown (K Units, %) by Region 2025 & 2033
- Figure 3: North America Vibration Level Switch Market Revenue (million), by Technlogy 2025 & 2033
- Figure 4: North America Vibration Level Switch Market Volume (K Units), by Technlogy 2025 & 2033
- Figure 5: North America Vibration Level Switch Market Revenue Share (%), by Technlogy 2025 & 2033
- Figure 6: North America Vibration Level Switch Market Volume Share (%), by Technlogy 2025 & 2033
- Figure 7: North America Vibration Level Switch Market Revenue (million), by Type of Connectivity 2025 & 2033
- Figure 8: North America Vibration Level Switch Market Volume (K Units), by Type of Connectivity 2025 & 2033
- Figure 9: North America Vibration Level Switch Market Revenue Share (%), by Type of Connectivity 2025 & 2033
- Figure 10: North America Vibration Level Switch Market Volume Share (%), by Type of Connectivity 2025 & 2033
- Figure 11: North America Vibration Level Switch Market Revenue (million), by Application 2025 & 2033
- Figure 12: North America Vibration Level Switch Market Volume (K Units), by Application 2025 & 2033
- Figure 13: North America Vibration Level Switch Market Revenue Share (%), by Application 2025 & 2033
- Figure 14: North America Vibration Level Switch Market Volume Share (%), by Application 2025 & 2033
- Figure 15: North America Vibration Level Switch Market Revenue (million), by End-User Industry 2025 & 2033
- Figure 16: North America Vibration Level Switch Market Volume (K Units), by End-User Industry 2025 & 2033
- Figure 17: North America Vibration Level Switch Market Revenue Share (%), by End-User Industry 2025 & 2033
- Figure 18: North America Vibration Level Switch Market Volume Share (%), by End-User Industry 2025 & 2033
- Figure 19: North America Vibration Level Switch Market Revenue (million), by Country 2025 & 2033
- Figure 20: North America Vibration Level Switch Market Volume (K Units), by Country 2025 & 2033
- Figure 21: North America Vibration Level Switch Market Revenue Share (%), by Country 2025 & 2033
- Figure 22: North America Vibration Level Switch Market Volume Share (%), by Country 2025 & 2033
- Figure 23: Europe Vibration Level Switch Market Revenue (million), by Technlogy 2025 & 2033
- Figure 24: Europe Vibration Level Switch Market Volume (K Units), by Technlogy 2025 & 2033
- Figure 25: Europe Vibration Level Switch Market Revenue Share (%), by Technlogy 2025 & 2033
- Figure 26: Europe Vibration Level Switch Market Volume Share (%), by Technlogy 2025 & 2033
- Figure 27: Europe Vibration Level Switch Market Revenue (million), by Type of Connectivity 2025 & 2033
- Figure 28: Europe Vibration Level Switch Market Volume (K Units), by Type of Connectivity 2025 & 2033
- Figure 29: Europe Vibration Level Switch Market Revenue Share (%), by Type of Connectivity 2025 & 2033
- Figure 30: Europe Vibration Level Switch Market Volume Share (%), by Type of Connectivity 2025 & 2033
- Figure 31: Europe Vibration Level Switch Market Revenue (million), by Application 2025 & 2033
- Figure 32: Europe Vibration Level Switch Market Volume (K Units), by Application 2025 & 2033
- Figure 33: Europe Vibration Level Switch Market Revenue Share (%), by Application 2025 & 2033
- Figure 34: Europe Vibration Level Switch Market Volume Share (%), by Application 2025 & 2033
- Figure 35: Europe Vibration Level Switch Market Revenue (million), by End-User Industry 2025 & 2033
- Figure 36: Europe Vibration Level Switch Market Volume (K Units), by End-User Industry 2025 & 2033
- Figure 37: Europe Vibration Level Switch Market Revenue Share (%), by End-User Industry 2025 & 2033
- Figure 38: Europe Vibration Level Switch Market Volume Share (%), by End-User Industry 2025 & 2033
- Figure 39: Europe Vibration Level Switch Market Revenue (million), by Country 2025 & 2033
- Figure 40: Europe Vibration Level Switch Market Volume (K Units), by Country 2025 & 2033
- Figure 41: Europe Vibration Level Switch Market Revenue Share (%), by Country 2025 & 2033
- Figure 42: Europe Vibration Level Switch Market Volume Share (%), by Country 2025 & 2033
- Figure 43: Asia Pacific Vibration Level Switch Market Revenue (million), by Technlogy 2025 & 2033
- Figure 44: Asia Pacific Vibration Level Switch Market Volume (K Units), by Technlogy 2025 & 2033
- Figure 45: Asia Pacific Vibration Level Switch Market Revenue Share (%), by Technlogy 2025 & 2033
- Figure 46: Asia Pacific Vibration Level Switch Market Volume Share (%), by Technlogy 2025 & 2033
- Figure 47: Asia Pacific Vibration Level Switch Market Revenue (million), by Type of Connectivity 2025 & 2033
- Figure 48: Asia Pacific Vibration Level Switch Market Volume (K Units), by Type of Connectivity 2025 & 2033
- Figure 49: Asia Pacific Vibration Level Switch Market Revenue Share (%), by Type of Connectivity 2025 & 2033
- Figure 50: Asia Pacific Vibration Level Switch Market Volume Share (%), by Type of Connectivity 2025 & 2033
- Figure 51: Asia Pacific Vibration Level Switch Market Revenue (million), by Application 2025 & 2033
- Figure 52: Asia Pacific Vibration Level Switch Market Volume (K Units), by Application 2025 & 2033
- Figure 53: Asia Pacific Vibration Level Switch Market Revenue Share (%), by Application 2025 & 2033
- Figure 54: Asia Pacific Vibration Level Switch Market Volume Share (%), by Application 2025 & 2033
- Figure 55: Asia Pacific Vibration Level Switch Market Revenue (million), by End-User Industry 2025 & 2033
- Figure 56: Asia Pacific Vibration Level Switch Market Volume (K Units), by End-User Industry 2025 & 2033
- Figure 57: Asia Pacific Vibration Level Switch Market Revenue Share (%), by End-User Industry 2025 & 2033
- Figure 58: Asia Pacific Vibration Level Switch Market Volume Share (%), by End-User Industry 2025 & 2033
- Figure 59: Asia Pacific Vibration Level Switch Market Revenue (million), by Country 2025 & 2033
- Figure 60: Asia Pacific Vibration Level Switch Market Volume (K Units), by Country 2025 & 2033
- Figure 61: Asia Pacific Vibration Level Switch Market Revenue Share (%), by Country 2025 & 2033
- Figure 62: Asia Pacific Vibration Level Switch Market Volume Share (%), by Country 2025 & 2033
- Figure 63: Latin America Vibration Level Switch Market Revenue (million), by Technlogy 2025 & 2033
- Figure 64: Latin America Vibration Level Switch Market Volume (K Units), by Technlogy 2025 & 2033
- Figure 65: Latin America Vibration Level Switch Market Revenue Share (%), by Technlogy 2025 & 2033
- Figure 66: Latin America Vibration Level Switch Market Volume Share (%), by Technlogy 2025 & 2033
- Figure 67: Latin America Vibration Level Switch Market Revenue (million), by Type of Connectivity 2025 & 2033
- Figure 68: Latin America Vibration Level Switch Market Volume (K Units), by Type of Connectivity 2025 & 2033
- Figure 69: Latin America Vibration Level Switch Market Revenue Share (%), by Type of Connectivity 2025 & 2033
- Figure 70: Latin America Vibration Level Switch Market Volume Share (%), by Type of Connectivity 2025 & 2033
- Figure 71: Latin America Vibration Level Switch Market Revenue (million), by Application 2025 & 2033
- Figure 72: Latin America Vibration Level Switch Market Volume (K Units), by Application 2025 & 2033
- Figure 73: Latin America Vibration Level Switch Market Revenue Share (%), by Application 2025 & 2033
- Figure 74: Latin America Vibration Level Switch Market Volume Share (%), by Application 2025 & 2033
- Figure 75: Latin America Vibration Level Switch Market Revenue (million), by End-User Industry 2025 & 2033
- Figure 76: Latin America Vibration Level Switch Market Volume (K Units), by End-User Industry 2025 & 2033
- Figure 77: Latin America Vibration Level Switch Market Revenue Share (%), by End-User Industry 2025 & 2033
- Figure 78: Latin America Vibration Level Switch Market Volume Share (%), by End-User Industry 2025 & 2033
- Figure 79: Latin America Vibration Level Switch Market Revenue (million), by Country 2025 & 2033
- Figure 80: Latin America Vibration Level Switch Market Volume (K Units), by Country 2025 & 2033
- Figure 81: Latin America Vibration Level Switch Market Revenue Share (%), by Country 2025 & 2033
- Figure 82: Latin America Vibration Level Switch Market Volume Share (%), by Country 2025 & 2033
- Figure 83: Middle East and Africa Vibration Level Switch Market Revenue (million), by Technlogy 2025 & 2033
- Figure 84: Middle East and Africa Vibration Level Switch Market Volume (K Units), by Technlogy 2025 & 2033
- Figure 85: Middle East and Africa Vibration Level Switch Market Revenue Share (%), by Technlogy 2025 & 2033
- Figure 86: Middle East and Africa Vibration Level Switch Market Volume Share (%), by Technlogy 2025 & 2033
- Figure 87: Middle East and Africa Vibration Level Switch Market Revenue (million), by Type of Connectivity 2025 & 2033
- Figure 88: Middle East and Africa Vibration Level Switch Market Volume (K Units), by Type of Connectivity 2025 & 2033
- Figure 89: Middle East and Africa Vibration Level Switch Market Revenue Share (%), by Type of Connectivity 2025 & 2033
- Figure 90: Middle East and Africa Vibration Level Switch Market Volume Share (%), by Type of Connectivity 2025 & 2033
- Figure 91: Middle East and Africa Vibration Level Switch Market Revenue (million), by Application 2025 & 2033
- Figure 92: Middle East and Africa Vibration Level Switch Market Volume (K Units), by Application 2025 & 2033
- Figure 93: Middle East and Africa Vibration Level Switch Market Revenue Share (%), by Application 2025 & 2033
- Figure 94: Middle East and Africa Vibration Level Switch Market Volume Share (%), by Application 2025 & 2033
- Figure 95: Middle East and Africa Vibration Level Switch Market Revenue (million), by End-User Industry 2025 & 2033
- Figure 96: Middle East and Africa Vibration Level Switch Market Volume (K Units), by End-User Industry 2025 & 2033
- Figure 97: Middle East and Africa Vibration Level Switch Market Revenue Share (%), by End-User Industry 2025 & 2033
- Figure 98: Middle East and Africa Vibration Level Switch Market Volume Share (%), by End-User Industry 2025 & 2033
- Figure 99: Middle East and Africa Vibration Level Switch Market Revenue (million), by Country 2025 & 2033
- Figure 100: Middle East and Africa Vibration Level Switch Market Volume (K Units), by Country 2025 & 2033
- Figure 101: Middle East and Africa Vibration Level Switch Market Revenue Share (%), by Country 2025 & 2033
- Figure 102: Middle East and Africa Vibration Level Switch Market Volume Share (%), by Country 2025 & 2033
List of Tables
- Table 1: Global Vibration Level Switch Market Revenue million Forecast, by Technlogy 2020 & 2033
- Table 2: Global Vibration Level Switch Market Volume K Units Forecast, by Technlogy 2020 & 2033
- Table 3: Global Vibration Level Switch Market Revenue million Forecast, by Type of Connectivity 2020 & 2033
- Table 4: Global Vibration Level Switch Market Volume K Units Forecast, by Type of Connectivity 2020 & 2033
- Table 5: Global Vibration Level Switch Market Revenue million Forecast, by Application 2020 & 2033
- Table 6: Global Vibration Level Switch Market Volume K Units Forecast, by Application 2020 & 2033
- Table 7: Global Vibration Level Switch Market Revenue million Forecast, by End-User Industry 2020 & 2033
- Table 8: Global Vibration Level Switch Market Volume K Units Forecast, by End-User Industry 2020 & 2033
- Table 9: Global Vibration Level Switch Market Revenue million Forecast, by Region 2020 & 2033
- Table 10: Global Vibration Level Switch Market Volume K Units Forecast, by Region 2020 & 2033
- Table 11: Global Vibration Level Switch Market Revenue million Forecast, by Technlogy 2020 & 2033
- Table 12: Global Vibration Level Switch Market Volume K Units Forecast, by Technlogy 2020 & 2033
- Table 13: Global Vibration Level Switch Market Revenue million Forecast, by Type of Connectivity 2020 & 2033
- Table 14: Global Vibration Level Switch Market Volume K Units Forecast, by Type of Connectivity 2020 & 2033
- Table 15: Global Vibration Level Switch Market Revenue million Forecast, by Application 2020 & 2033
- Table 16: Global Vibration Level Switch Market Volume K Units Forecast, by Application 2020 & 2033
- Table 17: Global Vibration Level Switch Market Revenue million Forecast, by End-User Industry 2020 & 2033
- Table 18: Global Vibration Level Switch Market Volume K Units Forecast, by End-User Industry 2020 & 2033
- Table 19: Global Vibration Level Switch Market Revenue million Forecast, by Country 2020 & 2033
- Table 20: Global Vibration Level Switch Market Volume K Units Forecast, by Country 2020 & 2033
- Table 21: Global Vibration Level Switch Market Revenue million Forecast, by Technlogy 2020 & 2033
- Table 22: Global Vibration Level Switch Market Volume K Units Forecast, by Technlogy 2020 & 2033
- Table 23: Global Vibration Level Switch Market Revenue million Forecast, by Type of Connectivity 2020 & 2033
- Table 24: Global Vibration Level Switch Market Volume K Units Forecast, by Type of Connectivity 2020 & 2033
- Table 25: Global Vibration Level Switch Market Revenue million Forecast, by Application 2020 & 2033
- Table 26: Global Vibration Level Switch Market Volume K Units Forecast, by Application 2020 & 2033
- Table 27: Global Vibration Level Switch Market Revenue million Forecast, by End-User Industry 2020 & 2033
- Table 28: Global Vibration Level Switch Market Volume K Units Forecast, by End-User Industry 2020 & 2033
- Table 29: Global Vibration Level Switch Market Revenue million Forecast, by Country 2020 & 2033
- Table 30: Global Vibration Level Switch Market Volume K Units Forecast, by Country 2020 & 2033
- Table 31: Global Vibration Level Switch Market Revenue million Forecast, by Technlogy 2020 & 2033
- Table 32: Global Vibration Level Switch Market Volume K Units Forecast, by Technlogy 2020 & 2033
- Table 33: Global Vibration Level Switch Market Revenue million Forecast, by Type of Connectivity 2020 & 2033
- Table 34: Global Vibration Level Switch Market Volume K Units Forecast, by Type of Connectivity 2020 & 2033
- Table 35: Global Vibration Level Switch Market Revenue million Forecast, by Application 2020 & 2033
- Table 36: Global Vibration Level Switch Market Volume K Units Forecast, by Application 2020 & 2033
- Table 37: Global Vibration Level Switch Market Revenue million Forecast, by End-User Industry 2020 & 2033
- Table 38: Global Vibration Level Switch Market Volume K Units Forecast, by End-User Industry 2020 & 2033
- Table 39: Global Vibration Level Switch Market Revenue million Forecast, by Country 2020 & 2033
- Table 40: Global Vibration Level Switch Market Volume K Units Forecast, by Country 2020 & 2033
- Table 41: Global Vibration Level Switch Market Revenue million Forecast, by Technlogy 2020 & 2033
- Table 42: Global Vibration Level Switch Market Volume K Units Forecast, by Technlogy 2020 & 2033
- Table 43: Global Vibration Level Switch Market Revenue million Forecast, by Type of Connectivity 2020 & 2033
- Table 44: Global Vibration Level Switch Market Volume K Units Forecast, by Type of Connectivity 2020 & 2033
- Table 45: Global Vibration Level Switch Market Revenue million Forecast, by Application 2020 & 2033
- Table 46: Global Vibration Level Switch Market Volume K Units Forecast, by Application 2020 & 2033
- Table 47: Global Vibration Level Switch Market Revenue million Forecast, by End-User Industry 2020 & 2033
- Table 48: Global Vibration Level Switch Market Volume K Units Forecast, by End-User Industry 2020 & 2033
- Table 49: Global Vibration Level Switch Market Revenue million Forecast, by Country 2020 & 2033
- Table 50: Global Vibration Level Switch Market Volume K Units Forecast, by Country 2020 & 2033
- Table 51: Global Vibration Level Switch Market Revenue million Forecast, by Technlogy 2020 & 2033
- Table 52: Global Vibration Level Switch Market Volume K Units Forecast, by Technlogy 2020 & 2033
- Table 53: Global Vibration Level Switch Market Revenue million Forecast, by Type of Connectivity 2020 & 2033
- Table 54: Global Vibration Level Switch Market Volume K Units Forecast, by Type of Connectivity 2020 & 2033
- Table 55: Global Vibration Level Switch Market Revenue million Forecast, by Application 2020 & 2033
- Table 56: Global Vibration Level Switch Market Volume K Units Forecast, by Application 2020 & 2033
- Table 57: Global Vibration Level Switch Market Revenue million Forecast, by End-User Industry 2020 & 2033
- Table 58: Global Vibration Level Switch Market Volume K Units Forecast, by End-User Industry 2020 & 2033
- Table 59: Global Vibration Level Switch Market Revenue million Forecast, by Country 2020 & 2033
- Table 60: Global Vibration Level Switch Market Volume K Units Forecast, by Country 2020 & 2033
Frequently Asked Questions
1. What is the projected Compound Annual Growth Rate (CAGR) of the Vibration Level Switch Market?
The projected CAGR is approximately 5.7%.
2. Which companies are prominent players in the Vibration Level Switch Market?
Key companies in the market include ABB Ltd, Shenzhen Jiwei Automations Ltd, Vega Grieshaber KG, Endress+Hauser AG, Magnetrol International Inc, Trumen Technologies Pvt Ltd, OleumTech Corporation, Emerson Electric Co, Siemens AG, Dwyer Instruments Inc, Yamamoto Electric Industrial Co Ltd, Sapcon Instruments Pvt Ltd, FineTek Co Ltd, KROHNE Group.
3. What are the main segments of the Vibration Level Switch Market?
The market segments include Technlogy, Type of Connectivity, Application, End-User Industry.
4. Can you provide details about the market size?
The market size is estimated to be USD 867 million as of 2022.
5. What are some drivers contributing to market growth?
Rising need on functional safety of overfill protection systems; Easy handling and setup compared to other point level measurement technologies.
6. What are the notable trends driving market growth?
Chemicals Industry is Expected to Hold Significant Share.
7. Are there any restraints impacting market growth?
Limited performance in highly viscous liquids.
8. Can you provide examples of recent developments in the market?
N/A
9. What pricing options are available for accessing the report?
Pricing options include single-user, multi-user, and enterprise licenses priced at USD 4750, USD 5250, and USD 8750 respectively.
10. Is the market size provided in terms of value or volume?
The market size is provided in terms of value, measured in million and volume, measured in K Units.
11. Are there any specific market keywords associated with the report?
Yes, the market keyword associated with the report is "Vibration Level Switch Market," which aids in identifying and referencing the specific market segment covered.
12. How do I determine which pricing option suits my needs best?
The pricing options vary based on user requirements and access needs. Individual users may opt for single-user licenses, while businesses requiring broader access may choose multi-user or enterprise licenses for cost-effective access to the report.
13. Are there any additional resources or data provided in the Vibration Level Switch Market report?
While the report offers comprehensive insights, it's advisable to review the specific contents or supplementary materials provided to ascertain if additional resources or data are available.
14. How can I stay updated on further developments or reports in the Vibration Level Switch Market?
To stay informed about further developments, trends, and reports in the Vibration Level Switch Market, consider subscribing to industry newsletters, following relevant companies and organizations, or regularly checking reputable industry news sources and publications.
Methodology
Step 1 - Identification of Relevant Samples Size from Population Database


Step 2 - Approaches for Defining Global Market Size (Value, Volume* & Price*)

Note*: In applicable scenarios
Step 3 - Data Sources
Primary Research
- Web Analytics
- Survey Reports
- Research Institute
- Latest Research Reports
- Opinion Leaders
Secondary Research
- Annual Reports
- White Paper
- Latest Press Release
- Industry Association
- Paid Database
- Investor Presentations

Step 4 - Data Triangulation
Involves using different sources of information in order to increase the validity of a study
These sources are likely to be stakeholders in a program - participants, other researchers, program staff, other community members, and so on.
Then we put all data in single framework & apply various statistical tools to find out the dynamic on the market.
During the analysis stage, feedback from the stakeholder groups would be compared to determine areas of agreement as well as areas of divergence