


Key Insights into the Virtual Assistant Services Market
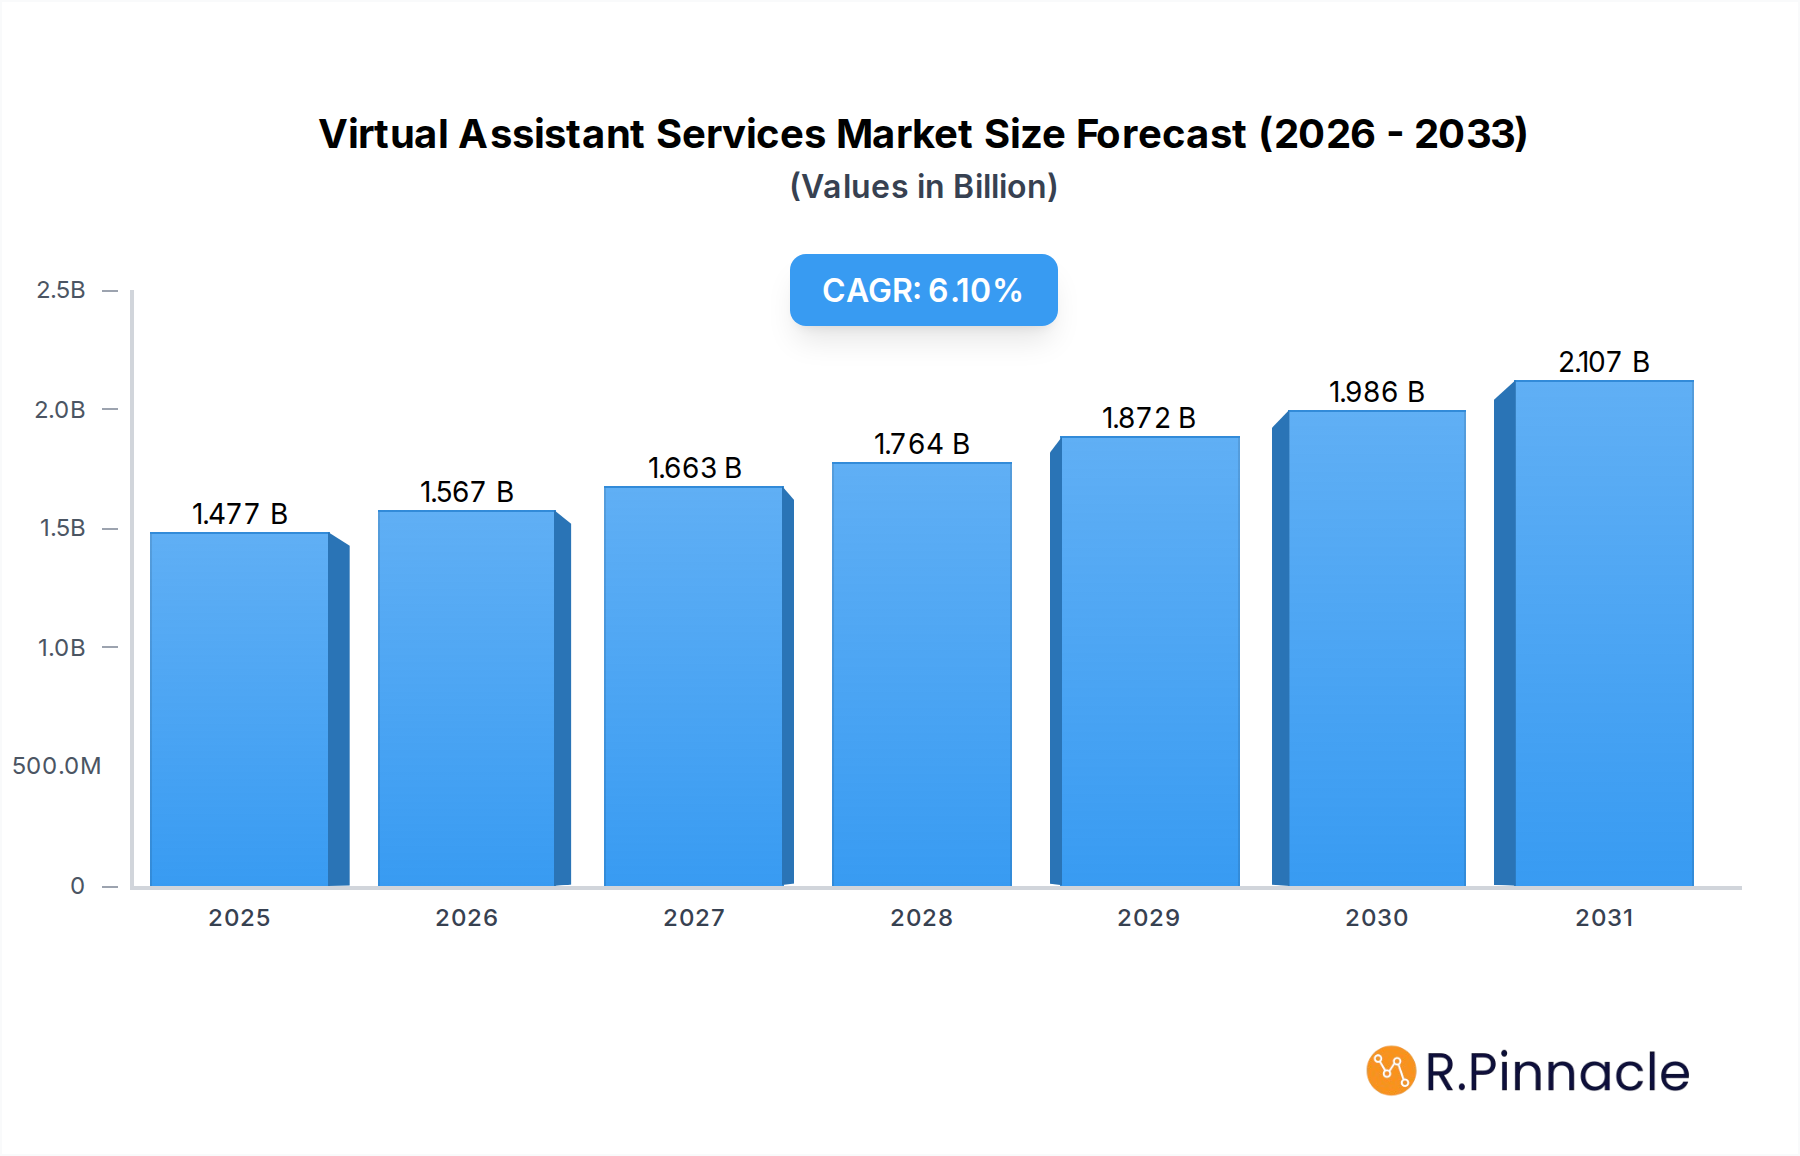
The Global Virtual Assistant Services Market was valued at USD 1392 million in 2023, demonstrating a robust expansion trajectory underpinned by accelerating digital transformation initiatives and the pervasive adoption of remote work models. This market is projected to reach an estimated valuation of approximately USD 2640.8 million by 2034, advancing at a Compound Annual Growth Rate (CAGR) of 6.1% during the forecast period from 2026 to 2034. The primary demand drivers for virtual assistant services stem from organizations' imperative to optimize operational costs, enhance efficiency, and reallocate internal resources towards core competencies. Small and Medium-sized Businesses (SMBs), in particular, are increasingly leveraging these services to access specialized skills without the overheads associated with full-time hires.
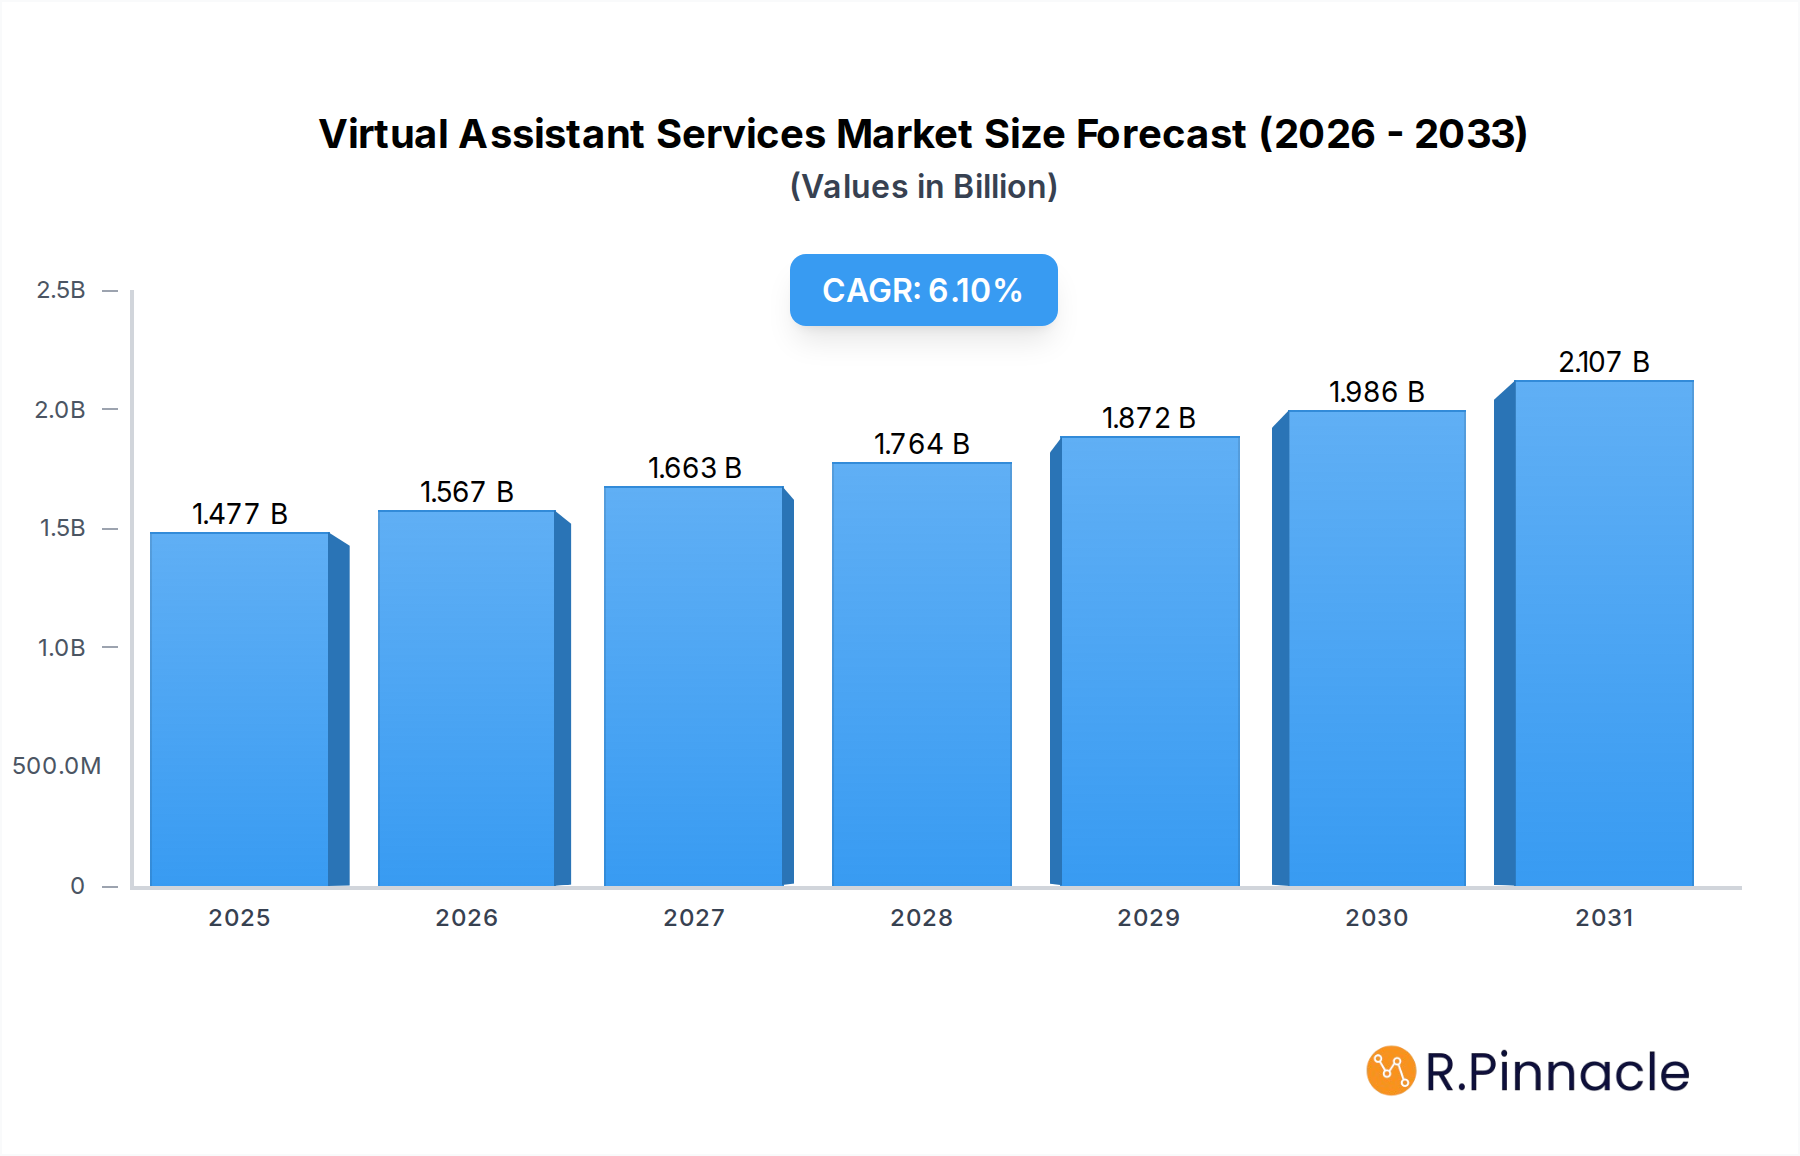
Virtual Assistant Services Market Size (In Billion)

Macro tailwinds significantly contributing to this growth include continuous technological advancements, particularly in areas like artificial intelligence (AI) and machine learning (ML), which empower virtual assistants with enhanced capabilities and broader task execution scopes. The globalization of the workforce and the burgeoning gig economy further expand the talent pool and service delivery models, making virtual assistant services more accessible and cost-effective. Furthermore, the increasing complexity of business operations across various sectors necessitates specialized administrative and technical support, which virtual assistants proficiently provide. The market is also being propelled by the rising demand for efficient customer interaction and support, with virtual assistants playing a pivotal role in augmenting customer service capabilities. The forward-looking outlook indicates sustained expansion, with significant integration of advanced Artificial Intelligence Market capabilities, leading to more sophisticated and specialized service offerings. As businesses continue to prioritize agility and scalability, the Virtual Assistant Services Market is poised for consistent growth, becoming an indispensable component of modern operational frameworks.
Virtual Assistant Services Company Market Share
The Dominance of Administrative Virtual Assistant Services Market
Within the diverse landscape of the Virtual Assistant Services Market, the Administrative Virtual Assistant Market segment stands out as the single largest by revenue share, acting as a foundational pillar for market expansion. This dominance is attributable to the universal need across businesses, regardless of size or industry, for efficient management of routine, time-consuming administrative tasks. These tasks encompass scheduling, email management, data entry, document preparation, travel arrangements, and basic research, which, while essential, can divert internal staff from higher-value strategic activities. The ability of administrative virtual assistants to cost-effectively handle these operational necessities provides significant relief to businesses, allowing them to streamline workflows and improve overall productivity.
Several factors contribute to its continued market leadership. Firstly, administrative support is often the initial point of entry for many businesses exploring virtual assistant services, due to the immediate and tangible benefits of outsourcing non-core, repetitive duties. This segment serves a broad spectrum of end-users, from individual entrepreneurs and freelancers to large enterprises seeking to optimize their back-office functions. Companies such as Virtalent, MyOutDesk, Belay Solutions, and Prialto have established strong footholds in this segment, offering comprehensive administrative support tailored to various client needs. Their strategic profiles often emphasize reliability, efficiency, and the ability to seamlessly integrate with client operations.
Moreover, the Administrative Virtual Assistant Market is experiencing sustained growth rather than consolidation. The increasing volume of administrative tasks driven by digital proliferation and remote working setups ensures a continuous demand. Technological advancements, though often highlighted in more technical virtual assistant roles, also bolster administrative services by enabling faster task completion through automation tools and efficient communication platforms. This leads to enhanced service quality and broader task capabilities for administrative virtual assistants. As the overall Virtual Assistant Services Market matures, the Administrative Virtual Assistant Market segment is expected to not only maintain its leading position but also evolve, potentially incorporating more sophisticated project coordination and digital organization tasks, further cementing its essential role in the modern business environment.
Key Market Drivers and Constraints in Virtual Assistant Services Market
The Virtual Assistant Services Market is profoundly influenced by a confluence of accelerating drivers and persistent constraints. A primary driver is the global trend of digital transformation and the ubiquitous adoption of remote work paradigms. The shift towards digital-first operations, exacerbated by recent global events, has made businesses more receptive to virtual solutions. A significant metric illustrating this is the increasing investment by enterprises in cloud-based software and collaboration tools, which inherently support remote operational models. This broad embrace of digital tools creates a fertile environment for virtual assistant services to thrive, as they integrate seamlessly into these new workflows, facilitating everything from administrative tasks to specialized technical support. The ongoing expansion of the Cloud Computing Market further underpins this shift, providing the scalable infrastructure necessary for distributed teams and virtual service delivery.
Another critical driver is the imperative for cost optimization and enhanced operational efficiency. Businesses, particularly SMBs, are under constant pressure to reduce overheads. Virtual assistant services offer a compelling alternative to traditional full-time employment, circumventing costs associated with salaries, benefits, office space, and recruitment. For instance, a recent industry survey indicated that businesses could reduce operational costs by up to 70% by outsourcing specific tasks to virtual assistants compared to hiring in-house staff. This financial incentive is a powerful catalyst for adoption. Furthermore, the growth of the Business Process Outsourcing Market signals a broader acceptance of externalizing non-core functions, with virtual assistant services fitting squarely into this strategic approach.
Technological advancements, particularly in Artificial Intelligence (AI) and Natural Language Processing (NLP), are transformative drivers. The integration of sophisticated AI algorithms allows virtual assistants to perform more complex tasks, understand nuanced instructions, and provide more intelligent support. This directly impacts the capabilities of the Customer Facing Virtual Assistant Market by enabling more natural and effective customer interactions. The evolution of the Natural Language Processing Market has significantly improved voice and text-based communication with virtual assistants, leading to more seamless user experiences. However, the market faces significant constraints, including data security and privacy concerns. As virtual assistants handle sensitive business and personal information, breaches or mismanagement can have severe repercussions. Regulatory frameworks like GDPR and CCPA impose strict compliance requirements, adding complexity for providers. Another constraint is the perceived lack of quality control and consistency. Ensuring uniform service quality across diverse virtual assistant providers and individual assistants remains a challenge, impacting client trust and long-term engagement.
Competitive Ecosystem of Virtual Assistant Services Market
The Virtual Assistant Services Market is characterized by a fragmented yet dynamic competitive landscape, encompassing a blend of established global players and niche service providers. Companies differentiate themselves through specialized offerings, pricing models, and technological integration, particularly in advanced AI capabilities.
- Virtalent: A UK-based firm known for providing highly skilled virtual assistants, focusing on quality matching and long-term client relationships for executive and business support. Its client base spans startups to large enterprises seeking premium administrative and marketing assistance.
- MyTasker: An India-based service offering a wide range of virtual assistant support, from administrative and technical to creative and marketing tasks. They emphasize affordability and round-the-clock service to cater to a global clientele.
- MyOutDesk: Specializes in providing virtual assistants primarily to the real estate industry in North America, focusing on back-office, administrative, and marketing support to help agents and brokers scale their operations.
- Belay Solutions: A U.S.-based company that provides virtual assistants and bookkeepers, known for its rigorous hiring process and focus on matching clients with high-caliber, experienced professionals, particularly for executive and marketing support.
- Okay Relax: Offers a subscription-based model for various virtual assistant services, including scheduling, research, and data entry, catering to busy professionals and small businesses seeking flexible support.
- WoodBows: Provides dedicated virtual assistants for a multitude of tasks, including administrative, executive, and marketing support, with an emphasis on tailored solutions and strong client communication.
- Prialto: Focuses on executive administrative assistance, offering highly trained virtual executive assistants to help busy professionals manage their schedules, communications, and projects, enhancing productivity.
- Fancy Hands: Operates on a task-based model, offering small, quick tasks to a pool of U.S.-based virtual assistants, ideal for individuals and businesses needing on-demand support for specific projects.
- Time Etc: A long-standing provider of virtual assistant services, matching clients with experienced assistants for administrative, marketing, and PA tasks, emphasizing consistent quality and personalized support.
- Magic: Known for its on-demand virtual assistant services available via text, offering a wide array of support from personal tasks to business operations, leveraging technology for quick request fulfillment.
- Upwork: While primarily a freelancing platform, Upwork connects clients with independent virtual assistants globally, offering flexibility in hiring for specific projects or ongoing support, and integrating various payment and management tools.
- Uassist.ME: A BPO company providing bilingual virtual assistants from El Salvador, specializing in administrative, marketing, and customer service support for U.S. and Canadian businesses.
- Virtual Assistant Canada: Focuses on connecting Canadian businesses with local virtual assistants, offering services that align with Canadian business culture and legal requirements.
- Virtual Gurus: A Canadian-based company providing virtual assistants and virtual teams, emphasizing high-quality matches and comprehensive support for diverse business needs across industries.
- Pepper Virtual Assistant Services: Offers virtual assistant solutions, often emphasizing personalized service and proactive support for administrative, technical, and creative tasks.
- CIBC: While primarily a financial institution, its mention suggests involvement in broader business services, possibly through digital tools or partnerships related to business efficiency, or as a large enterprise consumer of VA services.
- Valenta: A global provider of outsourcing and consulting services, including virtual assistant solutions, helping businesses streamline operations and achieve growth through strategic support.
- Zirtual: Provides dedicated, U.S.-based virtual executive assistants to help professionals manage their daily tasks, focusing on quality, confidentiality, and high-level support.
- Nuance: A technology company known for its conversational AI solutions; its inclusion here points to its role as a technology enabler for advanced virtual assistant platforms, particularly in voice-based services.
- Fidelity: A major financial services company; its presence suggests either a significant internal adoption of virtual assistant tools for efficiency or strategic investments/offerings in related tech-enabled services.
Recent Developments & Milestones in Virtual Assistant Services Market
June 2023: Several leading virtual assistant platforms announced the integration of advanced Natural Language Processing Market capabilities into their service offerings, significantly enhancing their ability to understand and process complex client requests, particularly for the Customer Facing Virtual Assistant Market. August 2023: A strategic alliance was forged between major virtual assistant service providers and leading Cloud Computing Market infrastructure vendors to offer enhanced data security, scalability, and disaster recovery solutions, critical for enterprise-level clients. November 2023: Upwork introduced new AI-powered matching algorithms designed to more effectively connect clients with virtual assistants possessing niche skills, reflecting the increasing influence of the Artificial Intelligence Market on talent acquisition and deployment. January 2024: MyOutDesk reported a significant expansion in its European operations, driven by increasing adoption rates among small and medium-sized businesses seeking cost-effective administrative and sales support solutions. March 2024: Valenta, a global outsourcing and consulting firm, launched specialized finance and accounting virtual assistant services, targeting the growing demand for outsourced financial support among SMBs and large enterprises. April 2024: Fancy Hands unveiled an upgraded mobile application with enhanced voice command features, aiming to improve accessibility and convenience for users requesting on-demand administrative tasks. May 2024: A consortium of virtual assistant service providers initiated a joint training program focusing on cybersecurity best practices and compliance with global data privacy regulations (e.g., GDPR, CCPA), raising industry standards.
Regional Market Breakdown for Virtual Assistant Services Market
The Virtual Assistant Services Market exhibits distinct regional dynamics, driven by varying economic conditions, technological adoption rates, and labor market characteristics across key geographies. Comparing at least four major regions—North America, Europe, Asia Pacific, and Middle East & Africa—provides insight into market maturity and growth potential.
North America holds the largest revenue share in the Virtual Assistant Services Market, primarily due to the early and widespread adoption of digital technologies, a large concentration of tech-savvy businesses, and a robust ecosystem of startups and large enterprises. The region’s demand is fueled by the sustained push for digital transformation, prevalent remote work culture, and a strong emphasis on operational efficiency and cost savings. The United States, in particular, contributes significantly to this dominance, showing a high CAGR driven by constant innovation in service delivery and advanced integration of AI into virtual assistant platforms. This region is a mature market, yet continues to innovate and expand its service offerings, especially in specialized areas.
Europe represents another substantial segment, demonstrating strong growth, particularly in Western European countries like the United Kingdom, Germany, and France. The primary demand driver here is the increasing need for multi-lingual virtual assistants to cater to diverse linguistic markets and the region's focus on cost-efficient business models. Regulatory frameworks, such as GDPR, also push companies towards compliant and secure virtual assistant services, influencing market offerings. While mature in some aspects, several European sub-regions are experiencing rapid adoption, contributing to a healthy regional CAGR.
Asia Pacific is poised to be the fastest-growing region in the Virtual Assistant Services Market, experiencing a remarkably high CAGR. This growth is propelled by rapid digitalization initiatives across countries like India, China, and the ASEAN nations, coupled with the emergence of a vast number of new startups and SMBs. The availability of a large, skilled, and cost-competitive virtual assistant talent pool, particularly in countries like India and the Philippines, also makes the region a significant hub for service providers. Furthermore, the increasing adoption of Business Process Outsourcing Market models by Western businesses looking to leverage global talent pools is a key demand driver.
Middle East & Africa (MEA), while currently holding a smaller market share, is an emerging market with significant growth potential. The region's demand is driven by ongoing economic diversification efforts, increasing foreign investment in technology, and a growing emphasis on digital infrastructure development. Countries within the GCC (Gulf Cooperation Council) are leading this growth, with businesses gradually adopting virtual assistant services to enhance competitiveness and streamline operations. The region is witnessing a gradual but steady increase in adoption, contributing to a moderate but accelerating CAGR, as it seeks to modernize its business services landscape.
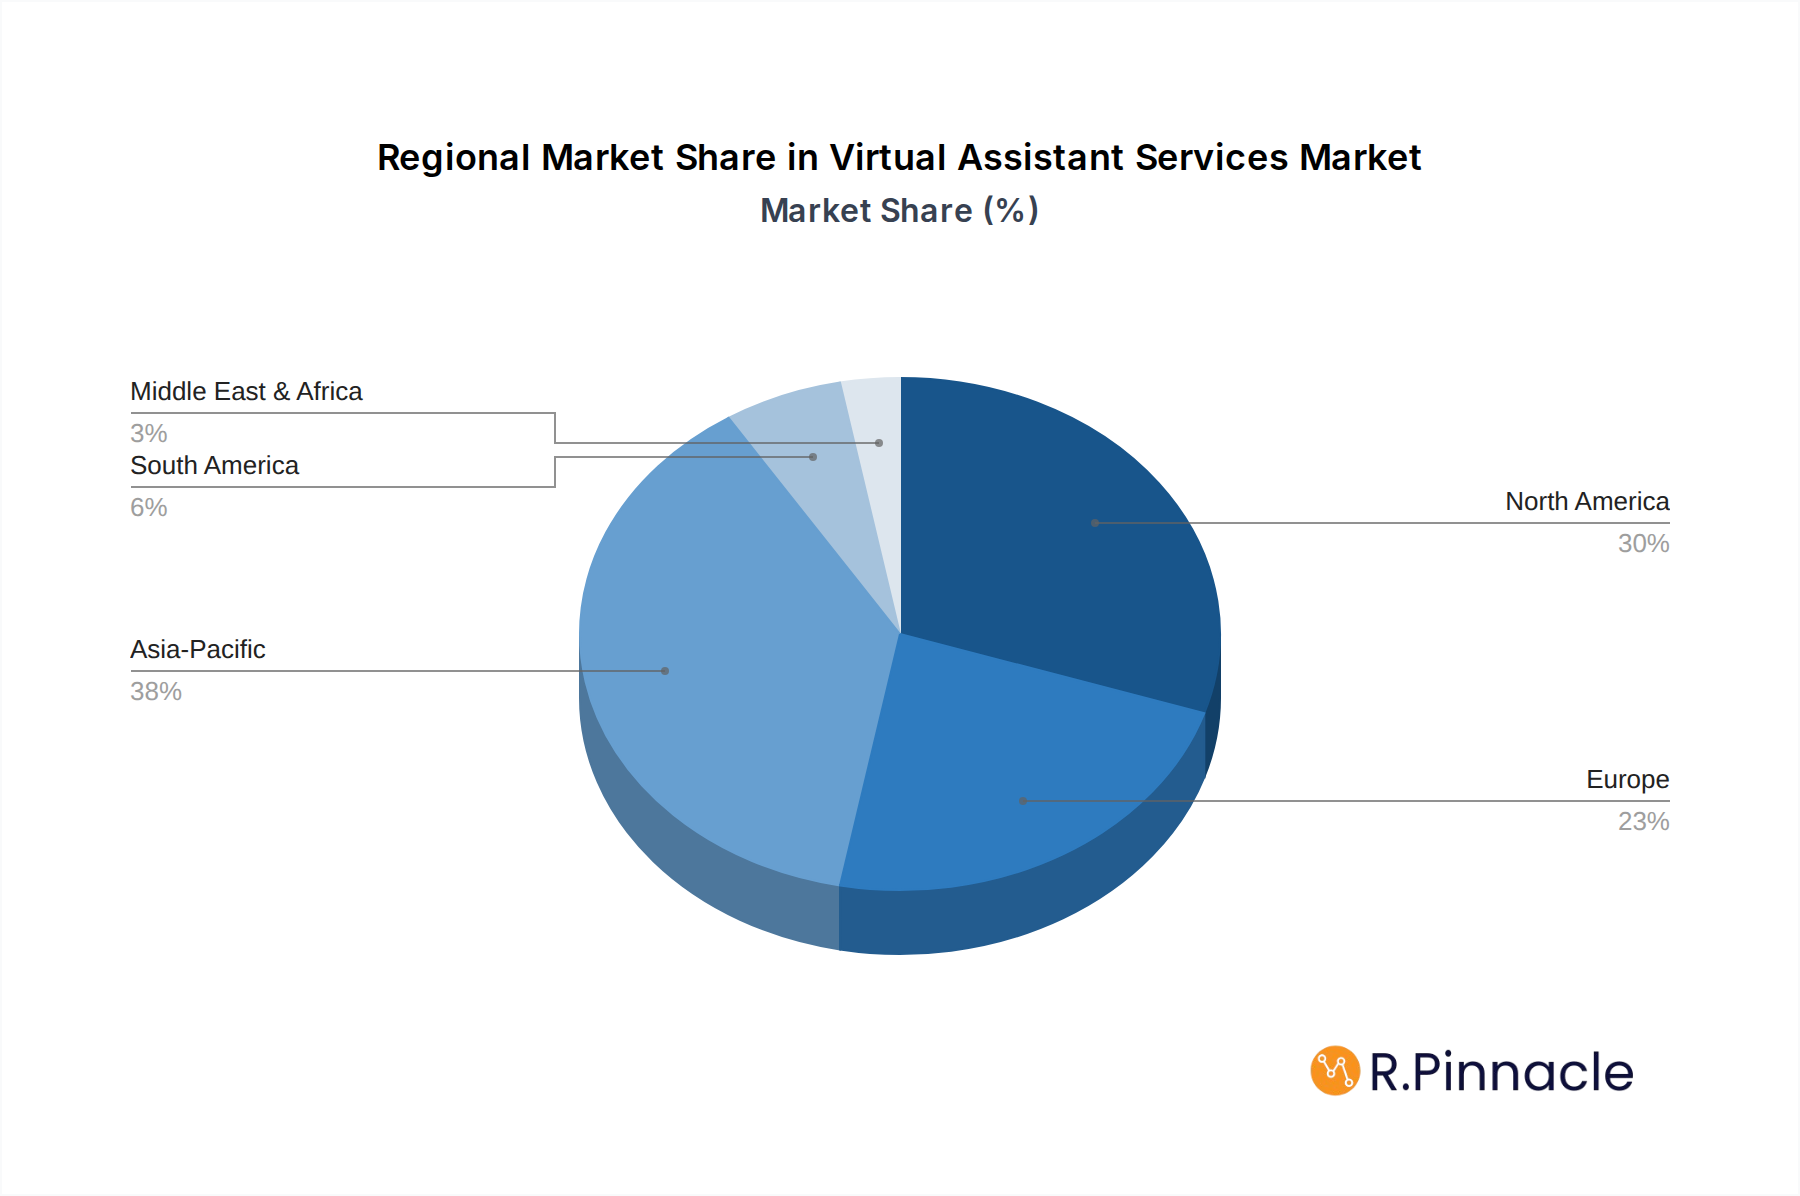
Virtual Assistant Services Regional Market Share
Supply Chain & Raw Material Dynamics for Virtual Assistant Services Market
Unlike traditional manufacturing sectors, the Virtual Assistant Services Market does not rely on physical "raw materials" in the conventional sense. Instead, its supply chain is built upon intellectual capital, technological infrastructure, and human resources. The upstream dependencies include: talent pool acquisition and training (skilled virtual assistants with expertise in administrative, technical, creative, or customer service domains); software platforms (Customer Relationship Management (CRM) systems, project management tools, communication platforms, and specialized industry software); and underlying technological components (Artificial Intelligence, Machine Learning algorithms, Natural Language Processing Market capabilities, and Data Analytics Market tools). The availability of robust internet infrastructure and cloud computing services, integral to the Cloud Computing Market, is also a critical upstream dependency.
Sourcing risks primarily revolve around talent scarcity for highly specialized skills, especially as the demand for niche virtual assistants grows. This can lead to increased acquisition costs and longer recruitment cycles. Data privacy regulations (e.g., GDPR, CCPA) pose a significant risk to cross-border talent acquisition and data handling, requiring providers to invest heavily in compliance and secure infrastructure. Another risk factor is the licensing costs of specialized software and AI/ML components, which can fluctuate based on vendor pricing strategies and technological advancements.
Price volatility of "key inputs" mainly pertains to talent costs (hourly rates or monthly retainers for virtual assistants), which can vary significantly based on geographic location, skill level, and demand-supply dynamics. For instance, highly specialized virtual assistants in developed economies command higher rates compared to those in emerging markets. Software subscription costs and data storage expenses, while generally stable, can see incremental increases or shifts based on feature upgrades or data usage. Historically, supply chain disruptions in this market primarily manifest as internet infrastructure outages, geopolitical events impacting cross-border Business Process Outsourcing Market operations, or data center failures. These disruptions can temporarily hinder service delivery, causing delays, communication breakdowns, and impacting client satisfaction. The shift to a more distributed global workforce has also introduced new challenges related to cybersecurity and ensuring consistent service quality across diverse operational environments.
Regulatory & Policy Landscape Shaping Virtual Assistant Services Market
The Virtual Assistant Services Market operates within an evolving and complex regulatory and policy landscape, which significantly influences service delivery, data management, and operational frameworks across different geographies. Key regulatory frameworks primarily focus on data privacy, labor laws, and consumer protection.
Data Privacy and Protection: This is paramount for the Virtual Assistant Services Market. Major frameworks include the General Data Protection Regulation (GDPR) in Europe, the California Consumer Privacy Act (CCPA) in the United States, and similar country-specific data protection laws (e.g., Brazil's LGPD, India's Personal Data Protection Bill). These regulations impose strict requirements on how personal and sensitive client data is collected, processed, stored, and transferred. Compliance necessitates robust data encryption, secure data handling protocols, and transparent privacy policies, particularly for virtual assistants dealing with sensitive information in sectors like healthcare or finance. The increasing global emphasis on data localization and cross-border data transfer rules presents ongoing challenges for providers serving international clients.
Labor Laws and Worker Classification: The classification of virtual assistants as independent contractors versus employees is a critical area. Various jurisdictions have differing rules on "gig workers," impacting tax obligations, benefits, and labor protections. For instance, the "ABC test" in California for independent contractors has implications for how virtual assistant companies structure their engagements. These policies directly affect the pricing models and operational costs for virtual assistant providers and influence the overall Managed IT Services Market, which often employs similar contractor models. Regulatory changes in this area can lead to increased administrative burdens and potential shifts in talent acquisition strategies.
Consumer Protection and Service Standards: Regulations related to service level agreements (SLAs), dispute resolution mechanisms, and fair advertising practices are also relevant. These ensure transparency in service offerings and protect clients from fraudulent or substandard services. Industry-specific standards, while not always legally mandated, often serve as de facto benchmarks for quality and reliability. For example, for a Customer Facing Virtual Assistant Market segment, adherence to high service standards directly impacts customer satisfaction and retention.
Recent policy changes include a growing trend towards stricter enforcement of data privacy laws, with significant fines for non-compliance, pushing virtual assistant providers to invest more in cybersecurity and compliance teams. Discussions around defining and protecting the rights of "gig economy" workers are also ongoing globally, which could potentially impact the flexibility and cost-effectiveness of virtual assistant services. The projected market impact of these regulations includes increased operational costs due to compliance requirements, a heightened need for robust data security infrastructure, and a potential shift towards providers who can demonstrate strong regulatory adherence and offer transparent, legally compliant services. This regulatory environment encourages more professionalized service delivery but can also pose barriers to entry for smaller, less resourced providers.
Virtual Assistant Services Segmentation
-
1. Type
- 1.1. Administrative Virtual Assistant
- 1.2. Customer Facing Virtual Assistant
- 1.3. Creative/Design Virtual Assistant
- 1.4. Technical Virtual Assistant
- 1.5. Finance/Accounting Virtual Assistant
-
2. Channel
- 2.1. Text-based
- 2.2. Voice-based
- 2.3. Omnichannel/Multichannel
-
3. Pricing
- 3.1. Hourly/Task-Based
- 3.2. Retainer / Package-based
- 3.3. Subscription-based
-
4. End User
- 4.1. Individuals
- 4.2. SMBs
- 4.3. Large Enterprises
- 4.4. Government and Public
Virtual Assistant Services Segmentation By Geography
-
1. North America
- 1.1. United States
- 1.2. Canada
- 1.3. Mexico
-
2. South America
- 2.1. Brazil
- 2.2. Argentina
- 2.3. Rest of South America
-
3. Europe
- 3.1. United Kingdom
- 3.2. Germany
- 3.3. France
- 3.4. Italy
- 3.5. Spain
- 3.6. Russia
- 3.7. Benelux
- 3.8. Nordics
- 3.9. Rest of Europe
-
4. Middle East & Africa
- 4.1. Turkey
- 4.2. Israel
- 4.3. GCC
- 4.4. North Africa
- 4.5. South Africa
- 4.6. Rest of Middle East & Africa
-
5. Asia Pacific
- 5.1. China
- 5.2. India
- 5.3. Japan
- 5.4. South Korea
- 5.5. ASEAN
- 5.6. Oceania
- 5.7. Rest of Asia Pacific
Virtual Assistant Services Regional Market Share
Geographic Coverage of Virtual Assistant Services
Virtual Assistant Services REPORT HIGHLIGHTS
| Aspects | Details |
|---|---|
| Study Period | 2020-2034 |
| Base Year | 2025 |
| Estimated Year | 2026 |
| Forecast Period | 2026-2034 |
| Historical Period | 2020-2025 |
| Growth Rate | CAGR of 6.1% from 2020-2034 |
| Segmentation |
|
Table of Contents
- 1. Introduction
- 1.1. Research Scope
- 1.2. Market Segmentation
- 1.3. Research Objective
- 1.4. Definitions and Assumptions
- 2. Executive Summary
- 2.1. Market Snapshot
- 3. Market Dynamics
- 3.1. Market Drivers
- 3.2. Market Restrains
- 3.3. Market Trends
- 3.4. Market Opportunities
- 4. Market Factor Analysis
- 4.1. Porters Five Forces
- 4.1.1. Bargaining Power of Suppliers
- 4.1.2. Bargaining Power of Buyers
- 4.1.3. Threat of New Entrants
- 4.1.4. Threat of Substitutes
- 4.1.5. Competitive Rivalry
- 4.2. PESTEL analysis
- 4.3. BCG Analysis
- 4.3.1. Stars (High Growth, High Market Share)
- 4.3.2. Cash Cows (Low Growth, High Market Share)
- 4.3.3. Question Mark (High Growth, Low Market Share)
- 4.3.4. Dogs (Low Growth, Low Market Share)
- 4.4. Ansoff Matrix Analysis
- 4.5. Supply Chain Analysis
- 4.6. Regulatory Landscape
- 4.7. Current Market Potential and Opportunity Assessment (TAM–SAM–SOM Framework)
- 4.8. PRI Analyst Note
- 4.1. Porters Five Forces
- 5. Market Analysis, Insights and Forecast 2021-2033
- 5.1. Market Analysis, Insights and Forecast - by Type
- 5.1.1. Administrative Virtual Assistant
- 5.1.2. Customer Facing Virtual Assistant
- 5.1.3. Creative/Design Virtual Assistant
- 5.1.4. Technical Virtual Assistant
- 5.1.5. Finance/Accounting Virtual Assistant
- 5.2. Market Analysis, Insights and Forecast - by Channel
- 5.2.1. Text-based
- 5.2.2. Voice-based
- 5.2.3. Omnichannel/Multichannel
- 5.3. Market Analysis, Insights and Forecast - by Pricing
- 5.3.1. Hourly/Task-Based
- 5.3.2. Retainer / Package-based
- 5.3.3. Subscription-based
- 5.4. Market Analysis, Insights and Forecast - by End User
- 5.4.1. Individuals
- 5.4.2. SMBs
- 5.4.3. Large Enterprises
- 5.4.4. Government and Public
- 5.5. Market Analysis, Insights and Forecast - by Region
- 5.5.1. North America
- 5.5.2. South America
- 5.5.3. Europe
- 5.5.4. Middle East & Africa
- 5.5.5. Asia Pacific
- 5.1. Market Analysis, Insights and Forecast - by Type
- 6. Global Virtual Assistant Services Analysis, Insights and Forecast, 2021-2033
- 6.1. Market Analysis, Insights and Forecast - by Type
- 6.1.1. Administrative Virtual Assistant
- 6.1.2. Customer Facing Virtual Assistant
- 6.1.3. Creative/Design Virtual Assistant
- 6.1.4. Technical Virtual Assistant
- 6.1.5. Finance/Accounting Virtual Assistant
- 6.2. Market Analysis, Insights and Forecast - by Channel
- 6.2.1. Text-based
- 6.2.2. Voice-based
- 6.2.3. Omnichannel/Multichannel
- 6.3. Market Analysis, Insights and Forecast - by Pricing
- 6.3.1. Hourly/Task-Based
- 6.3.2. Retainer / Package-based
- 6.3.3. Subscription-based
- 6.4. Market Analysis, Insights and Forecast - by End User
- 6.4.1. Individuals
- 6.4.2. SMBs
- 6.4.3. Large Enterprises
- 6.4.4. Government and Public
- 6.1. Market Analysis, Insights and Forecast - by Type
- 7. North America Virtual Assistant Services Analysis, Insights and Forecast, 2020-2032
- 7.1. Market Analysis, Insights and Forecast - by Type
- 7.1.1. Administrative Virtual Assistant
- 7.1.2. Customer Facing Virtual Assistant
- 7.1.3. Creative/Design Virtual Assistant
- 7.1.4. Technical Virtual Assistant
- 7.1.5. Finance/Accounting Virtual Assistant
- 7.2. Market Analysis, Insights and Forecast - by Channel
- 7.2.1. Text-based
- 7.2.2. Voice-based
- 7.2.3. Omnichannel/Multichannel
- 7.3. Market Analysis, Insights and Forecast - by Pricing
- 7.3.1. Hourly/Task-Based
- 7.3.2. Retainer / Package-based
- 7.3.3. Subscription-based
- 7.4. Market Analysis, Insights and Forecast - by End User
- 7.4.1. Individuals
- 7.4.2. SMBs
- 7.4.3. Large Enterprises
- 7.4.4. Government and Public
- 7.1. Market Analysis, Insights and Forecast - by Type
- 8. South America Virtual Assistant Services Analysis, Insights and Forecast, 2020-2032
- 8.1. Market Analysis, Insights and Forecast - by Type
- 8.1.1. Administrative Virtual Assistant
- 8.1.2. Customer Facing Virtual Assistant
- 8.1.3. Creative/Design Virtual Assistant
- 8.1.4. Technical Virtual Assistant
- 8.1.5. Finance/Accounting Virtual Assistant
- 8.2. Market Analysis, Insights and Forecast - by Channel
- 8.2.1. Text-based
- 8.2.2. Voice-based
- 8.2.3. Omnichannel/Multichannel
- 8.3. Market Analysis, Insights and Forecast - by Pricing
- 8.3.1. Hourly/Task-Based
- 8.3.2. Retainer / Package-based
- 8.3.3. Subscription-based
- 8.4. Market Analysis, Insights and Forecast - by End User
- 8.4.1. Individuals
- 8.4.2. SMBs
- 8.4.3. Large Enterprises
- 8.4.4. Government and Public
- 8.1. Market Analysis, Insights and Forecast - by Type
- 9. Europe Virtual Assistant Services Analysis, Insights and Forecast, 2020-2032
- 9.1. Market Analysis, Insights and Forecast - by Type
- 9.1.1. Administrative Virtual Assistant
- 9.1.2. Customer Facing Virtual Assistant
- 9.1.3. Creative/Design Virtual Assistant
- 9.1.4. Technical Virtual Assistant
- 9.1.5. Finance/Accounting Virtual Assistant
- 9.2. Market Analysis, Insights and Forecast - by Channel
- 9.2.1. Text-based
- 9.2.2. Voice-based
- 9.2.3. Omnichannel/Multichannel
- 9.3. Market Analysis, Insights and Forecast - by Pricing
- 9.3.1. Hourly/Task-Based
- 9.3.2. Retainer / Package-based
- 9.3.3. Subscription-based
- 9.4. Market Analysis, Insights and Forecast - by End User
- 9.4.1. Individuals
- 9.4.2. SMBs
- 9.4.3. Large Enterprises
- 9.4.4. Government and Public
- 9.1. Market Analysis, Insights and Forecast - by Type
- 10. Middle East & Africa Virtual Assistant Services Analysis, Insights and Forecast, 2020-2032
- 10.1. Market Analysis, Insights and Forecast - by Type
- 10.1.1. Administrative Virtual Assistant
- 10.1.2. Customer Facing Virtual Assistant
- 10.1.3. Creative/Design Virtual Assistant
- 10.1.4. Technical Virtual Assistant
- 10.1.5. Finance/Accounting Virtual Assistant
- 10.2. Market Analysis, Insights and Forecast - by Channel
- 10.2.1. Text-based
- 10.2.2. Voice-based
- 10.2.3. Omnichannel/Multichannel
- 10.3. Market Analysis, Insights and Forecast - by Pricing
- 10.3.1. Hourly/Task-Based
- 10.3.2. Retainer / Package-based
- 10.3.3. Subscription-based
- 10.4. Market Analysis, Insights and Forecast - by End User
- 10.4.1. Individuals
- 10.4.2. SMBs
- 10.4.3. Large Enterprises
- 10.4.4. Government and Public
- 10.1. Market Analysis, Insights and Forecast - by Type
- 11. Asia Pacific Virtual Assistant Services Analysis, Insights and Forecast, 2020-2032
- 11.1. Market Analysis, Insights and Forecast - by Type
- 11.1.1. Administrative Virtual Assistant
- 11.1.2. Customer Facing Virtual Assistant
- 11.1.3. Creative/Design Virtual Assistant
- 11.1.4. Technical Virtual Assistant
- 11.1.5. Finance/Accounting Virtual Assistant
- 11.2. Market Analysis, Insights and Forecast - by Channel
- 11.2.1. Text-based
- 11.2.2. Voice-based
- 11.2.3. Omnichannel/Multichannel
- 11.3. Market Analysis, Insights and Forecast - by Pricing
- 11.3.1. Hourly/Task-Based
- 11.3.2. Retainer / Package-based
- 11.3.3. Subscription-based
- 11.4. Market Analysis, Insights and Forecast - by End User
- 11.4.1. Individuals
- 11.4.2. SMBs
- 11.4.3. Large Enterprises
- 11.4.4. Government and Public
- 11.1. Market Analysis, Insights and Forecast - by Type
- 12. Competitive Analysis
- 12.1. Company Profiles
- 12.1.1 Virtalent
- 12.1.1.1. Company Overview
- 12.1.1.2. Products
- 12.1.1.3. Company Financials
- 12.1.1.4. SWOT Analysis
- 12.1.2 MyTasker
- 12.1.2.1. Company Overview
- 12.1.2.2. Products
- 12.1.2.3. Company Financials
- 12.1.2.4. SWOT Analysis
- 12.1.3 MyOutDesk
- 12.1.3.1. Company Overview
- 12.1.3.2. Products
- 12.1.3.3. Company Financials
- 12.1.3.4. SWOT Analysis
- 12.1.4 Belay Solutions
- 12.1.4.1. Company Overview
- 12.1.4.2. Products
- 12.1.4.3. Company Financials
- 12.1.4.4. SWOT Analysis
- 12.1.5 Okay Relax
- 12.1.5.1. Company Overview
- 12.1.5.2. Products
- 12.1.5.3. Company Financials
- 12.1.5.4. SWOT Analysis
- 12.1.6 WoodBows
- 12.1.6.1. Company Overview
- 12.1.6.2. Products
- 12.1.6.3. Company Financials
- 12.1.6.4. SWOT Analysis
- 12.1.7 Prialto
- 12.1.7.1. Company Overview
- 12.1.7.2. Products
- 12.1.7.3. Company Financials
- 12.1.7.4. SWOT Analysis
- 12.1.8 Fancy Hands
- 12.1.8.1. Company Overview
- 12.1.8.2. Products
- 12.1.8.3. Company Financials
- 12.1.8.4. SWOT Analysis
- 12.1.9 Time Etc
- 12.1.9.1. Company Overview
- 12.1.9.2. Products
- 12.1.9.3. Company Financials
- 12.1.9.4. SWOT Analysis
- 12.1.10 Magic
- 12.1.10.1. Company Overview
- 12.1.10.2. Products
- 12.1.10.3. Company Financials
- 12.1.10.4. SWOT Analysis
- 12.1.11 Upwork
- 12.1.11.1. Company Overview
- 12.1.11.2. Products
- 12.1.11.3. Company Financials
- 12.1.11.4. SWOT Analysis
- 12.1.12 Uassist.ME
- 12.1.12.1. Company Overview
- 12.1.12.2. Products
- 12.1.12.3. Company Financials
- 12.1.12.4. SWOT Analysis
- 12.1.13 Virtual Assistant Canada
- 12.1.13.1. Company Overview
- 12.1.13.2. Products
- 12.1.13.3. Company Financials
- 12.1.13.4. SWOT Analysis
- 12.1.14 Virtual Gurus
- 12.1.14.1. Company Overview
- 12.1.14.2. Products
- 12.1.14.3. Company Financials
- 12.1.14.4. SWOT Analysis
- 12.1.15 Pepper Virtual Assistant Services
- 12.1.15.1. Company Overview
- 12.1.15.2. Products
- 12.1.15.3. Company Financials
- 12.1.15.4. SWOT Analysis
- 12.1.16 CIBC
- 12.1.16.1. Company Overview
- 12.1.16.2. Products
- 12.1.16.3. Company Financials
- 12.1.16.4. SWOT Analysis
- 12.1.17 Valenta
- 12.1.17.1. Company Overview
- 12.1.17.2. Products
- 12.1.17.3. Company Financials
- 12.1.17.4. SWOT Analysis
- 12.1.18 Zirtual
- 12.1.18.1. Company Overview
- 12.1.18.2. Products
- 12.1.18.3. Company Financials
- 12.1.18.4. SWOT Analysis
- 12.1.19 Nuance
- 12.1.19.1. Company Overview
- 12.1.19.2. Products
- 12.1.19.3. Company Financials
- 12.1.19.4. SWOT Analysis
- 12.1.20 Fidelity
- 12.1.20.1. Company Overview
- 12.1.20.2. Products
- 12.1.20.3. Company Financials
- 12.1.20.4. SWOT Analysis
- 12.1.21 Others
- 12.1.21.1. Company Overview
- 12.1.21.2. Products
- 12.1.21.3. Company Financials
- 12.1.21.4. SWOT Analysis
- 12.1.1 Virtalent
- 12.2. Market Entropy
- 12.2.1 Company's Key Areas Served
- 12.2.2 Recent Developments
- 12.3. Company Market Share Analysis 2025
- 12.3.1 Top 5 Companies Market Share Analysis
- 12.3.2 Top 3 Companies Market Share Analysis
- 12.4. List of Potential Customers
- 13. Research Methodology
List of Figures
- Figure 1: Global Virtual Assistant Services Revenue Breakdown (million, %) by Region 2025 & 2033
- Figure 2: North America Virtual Assistant Services Revenue (million), by Type 2025 & 2033
- Figure 3: North America Virtual Assistant Services Revenue Share (%), by Type 2025 & 2033
- Figure 4: North America Virtual Assistant Services Revenue (million), by Channel 2025 & 2033
- Figure 5: North America Virtual Assistant Services Revenue Share (%), by Channel 2025 & 2033
- Figure 6: North America Virtual Assistant Services Revenue (million), by Pricing 2025 & 2033
- Figure 7: North America Virtual Assistant Services Revenue Share (%), by Pricing 2025 & 2033
- Figure 8: North America Virtual Assistant Services Revenue (million), by End User 2025 & 2033
- Figure 9: North America Virtual Assistant Services Revenue Share (%), by End User 2025 & 2033
- Figure 10: North America Virtual Assistant Services Revenue (million), by Country 2025 & 2033
- Figure 11: North America Virtual Assistant Services Revenue Share (%), by Country 2025 & 2033
- Figure 12: South America Virtual Assistant Services Revenue (million), by Type 2025 & 2033
- Figure 13: South America Virtual Assistant Services Revenue Share (%), by Type 2025 & 2033
- Figure 14: South America Virtual Assistant Services Revenue (million), by Channel 2025 & 2033
- Figure 15: South America Virtual Assistant Services Revenue Share (%), by Channel 2025 & 2033
- Figure 16: South America Virtual Assistant Services Revenue (million), by Pricing 2025 & 2033
- Figure 17: South America Virtual Assistant Services Revenue Share (%), by Pricing 2025 & 2033
- Figure 18: South America Virtual Assistant Services Revenue (million), by End User 2025 & 2033
- Figure 19: South America Virtual Assistant Services Revenue Share (%), by End User 2025 & 2033
- Figure 20: South America Virtual Assistant Services Revenue (million), by Country 2025 & 2033
- Figure 21: South America Virtual Assistant Services Revenue Share (%), by Country 2025 & 2033
- Figure 22: Europe Virtual Assistant Services Revenue (million), by Type 2025 & 2033
- Figure 23: Europe Virtual Assistant Services Revenue Share (%), by Type 2025 & 2033
- Figure 24: Europe Virtual Assistant Services Revenue (million), by Channel 2025 & 2033
- Figure 25: Europe Virtual Assistant Services Revenue Share (%), by Channel 2025 & 2033
- Figure 26: Europe Virtual Assistant Services Revenue (million), by Pricing 2025 & 2033
- Figure 27: Europe Virtual Assistant Services Revenue Share (%), by Pricing 2025 & 2033
- Figure 28: Europe Virtual Assistant Services Revenue (million), by End User 2025 & 2033
- Figure 29: Europe Virtual Assistant Services Revenue Share (%), by End User 2025 & 2033
- Figure 30: Europe Virtual Assistant Services Revenue (million), by Country 2025 & 2033
- Figure 31: Europe Virtual Assistant Services Revenue Share (%), by Country 2025 & 2033
- Figure 32: Middle East & Africa Virtual Assistant Services Revenue (million), by Type 2025 & 2033
- Figure 33: Middle East & Africa Virtual Assistant Services Revenue Share (%), by Type 2025 & 2033
- Figure 34: Middle East & Africa Virtual Assistant Services Revenue (million), by Channel 2025 & 2033
- Figure 35: Middle East & Africa Virtual Assistant Services Revenue Share (%), by Channel 2025 & 2033
- Figure 36: Middle East & Africa Virtual Assistant Services Revenue (million), by Pricing 2025 & 2033
- Figure 37: Middle East & Africa Virtual Assistant Services Revenue Share (%), by Pricing 2025 & 2033
- Figure 38: Middle East & Africa Virtual Assistant Services Revenue (million), by End User 2025 & 2033
- Figure 39: Middle East & Africa Virtual Assistant Services Revenue Share (%), by End User 2025 & 2033
- Figure 40: Middle East & Africa Virtual Assistant Services Revenue (million), by Country 2025 & 2033
- Figure 41: Middle East & Africa Virtual Assistant Services Revenue Share (%), by Country 2025 & 2033
- Figure 42: Asia Pacific Virtual Assistant Services Revenue (million), by Type 2025 & 2033
- Figure 43: Asia Pacific Virtual Assistant Services Revenue Share (%), by Type 2025 & 2033
- Figure 44: Asia Pacific Virtual Assistant Services Revenue (million), by Channel 2025 & 2033
- Figure 45: Asia Pacific Virtual Assistant Services Revenue Share (%), by Channel 2025 & 2033
- Figure 46: Asia Pacific Virtual Assistant Services Revenue (million), by Pricing 2025 & 2033
- Figure 47: Asia Pacific Virtual Assistant Services Revenue Share (%), by Pricing 2025 & 2033
- Figure 48: Asia Pacific Virtual Assistant Services Revenue (million), by End User 2025 & 2033
- Figure 49: Asia Pacific Virtual Assistant Services Revenue Share (%), by End User 2025 & 2033
- Figure 50: Asia Pacific Virtual Assistant Services Revenue (million), by Country 2025 & 2033
- Figure 51: Asia Pacific Virtual Assistant Services Revenue Share (%), by Country 2025 & 2033
List of Tables
- Table 1: Global Virtual Assistant Services Revenue million Forecast, by Type 2020 & 2033
- Table 2: Global Virtual Assistant Services Revenue million Forecast, by Channel 2020 & 2033
- Table 3: Global Virtual Assistant Services Revenue million Forecast, by Pricing 2020 & 2033
- Table 4: Global Virtual Assistant Services Revenue million Forecast, by End User 2020 & 2033
- Table 5: Global Virtual Assistant Services Revenue million Forecast, by Region 2020 & 2033
- Table 6: Global Virtual Assistant Services Revenue million Forecast, by Type 2020 & 2033
- Table 7: Global Virtual Assistant Services Revenue million Forecast, by Channel 2020 & 2033
- Table 8: Global Virtual Assistant Services Revenue million Forecast, by Pricing 2020 & 2033
- Table 9: Global Virtual Assistant Services Revenue million Forecast, by End User 2020 & 2033
- Table 10: Global Virtual Assistant Services Revenue million Forecast, by Country 2020 & 2033
- Table 11: United States Virtual Assistant Services Revenue (million) Forecast, by Application 2020 & 2033
- Table 12: Canada Virtual Assistant Services Revenue (million) Forecast, by Application 2020 & 2033
- Table 13: Mexico Virtual Assistant Services Revenue (million) Forecast, by Application 2020 & 2033
- Table 14: Global Virtual Assistant Services Revenue million Forecast, by Type 2020 & 2033
- Table 15: Global Virtual Assistant Services Revenue million Forecast, by Channel 2020 & 2033
- Table 16: Global Virtual Assistant Services Revenue million Forecast, by Pricing 2020 & 2033
- Table 17: Global Virtual Assistant Services Revenue million Forecast, by End User 2020 & 2033
- Table 18: Global Virtual Assistant Services Revenue million Forecast, by Country 2020 & 2033
- Table 19: Brazil Virtual Assistant Services Revenue (million) Forecast, by Application 2020 & 2033
- Table 20: Argentina Virtual Assistant Services Revenue (million) Forecast, by Application 2020 & 2033
- Table 21: Rest of South America Virtual Assistant Services Revenue (million) Forecast, by Application 2020 & 2033
- Table 22: Global Virtual Assistant Services Revenue million Forecast, by Type 2020 & 2033
- Table 23: Global Virtual Assistant Services Revenue million Forecast, by Channel 2020 & 2033
- Table 24: Global Virtual Assistant Services Revenue million Forecast, by Pricing 2020 & 2033
- Table 25: Global Virtual Assistant Services Revenue million Forecast, by End User 2020 & 2033
- Table 26: Global Virtual Assistant Services Revenue million Forecast, by Country 2020 & 2033
- Table 27: United Kingdom Virtual Assistant Services Revenue (million) Forecast, by Application 2020 & 2033
- Table 28: Germany Virtual Assistant Services Revenue (million) Forecast, by Application 2020 & 2033
- Table 29: France Virtual Assistant Services Revenue (million) Forecast, by Application 2020 & 2033
- Table 30: Italy Virtual Assistant Services Revenue (million) Forecast, by Application 2020 & 2033
- Table 31: Spain Virtual Assistant Services Revenue (million) Forecast, by Application 2020 & 2033
- Table 32: Russia Virtual Assistant Services Revenue (million) Forecast, by Application 2020 & 2033
- Table 33: Benelux Virtual Assistant Services Revenue (million) Forecast, by Application 2020 & 2033
- Table 34: Nordics Virtual Assistant Services Revenue (million) Forecast, by Application 2020 & 2033
- Table 35: Rest of Europe Virtual Assistant Services Revenue (million) Forecast, by Application 2020 & 2033
- Table 36: Global Virtual Assistant Services Revenue million Forecast, by Type 2020 & 2033
- Table 37: Global Virtual Assistant Services Revenue million Forecast, by Channel 2020 & 2033
- Table 38: Global Virtual Assistant Services Revenue million Forecast, by Pricing 2020 & 2033
- Table 39: Global Virtual Assistant Services Revenue million Forecast, by End User 2020 & 2033
- Table 40: Global Virtual Assistant Services Revenue million Forecast, by Country 2020 & 2033
- Table 41: Turkey Virtual Assistant Services Revenue (million) Forecast, by Application 2020 & 2033
- Table 42: Israel Virtual Assistant Services Revenue (million) Forecast, by Application 2020 & 2033
- Table 43: GCC Virtual Assistant Services Revenue (million) Forecast, by Application 2020 & 2033
- Table 44: North Africa Virtual Assistant Services Revenue (million) Forecast, by Application 2020 & 2033
- Table 45: South Africa Virtual Assistant Services Revenue (million) Forecast, by Application 2020 & 2033
- Table 46: Rest of Middle East & Africa Virtual Assistant Services Revenue (million) Forecast, by Application 2020 & 2033
- Table 47: Global Virtual Assistant Services Revenue million Forecast, by Type 2020 & 2033
- Table 48: Global Virtual Assistant Services Revenue million Forecast, by Channel 2020 & 2033
- Table 49: Global Virtual Assistant Services Revenue million Forecast, by Pricing 2020 & 2033
- Table 50: Global Virtual Assistant Services Revenue million Forecast, by End User 2020 & 2033
- Table 51: Global Virtual Assistant Services Revenue million Forecast, by Country 2020 & 2033
- Table 52: China Virtual Assistant Services Revenue (million) Forecast, by Application 2020 & 2033
- Table 53: India Virtual Assistant Services Revenue (million) Forecast, by Application 2020 & 2033
- Table 54: Japan Virtual Assistant Services Revenue (million) Forecast, by Application 2020 & 2033
- Table 55: South Korea Virtual Assistant Services Revenue (million) Forecast, by Application 2020 & 2033
- Table 56: ASEAN Virtual Assistant Services Revenue (million) Forecast, by Application 2020 & 2033
- Table 57: Oceania Virtual Assistant Services Revenue (million) Forecast, by Application 2020 & 2033
- Table 58: Rest of Asia Pacific Virtual Assistant Services Revenue (million) Forecast, by Application 2020 & 2033
Frequently Asked Questions
1. What is the projected Compound Annual Growth Rate (CAGR) of the Virtual Assistant Services?
The projected CAGR is approximately 6.1%.
2. Which companies are prominent players in the Virtual Assistant Services?
Key companies in the market include Virtalent, MyTasker, MyOutDesk, Belay Solutions, Okay Relax, WoodBows, Prialto, Fancy Hands, Time Etc, Magic, Upwork, Uassist.ME, Virtual Assistant Canada, Virtual Gurus, Pepper Virtual Assistant Services, CIBC, Valenta, Zirtual, Nuance, Fidelity, Others.
3. What are the main segments of the Virtual Assistant Services?
The market segments include Type, Channel, Pricing, End User.
4. Can you provide details about the market size?
The market size is estimated to be USD 1392 million as of 2022.
5. What are some drivers contributing to market growth?
N/A
6. What are the notable trends driving market growth?
N/A
7. Are there any restraints impacting market growth?
N/A
8. Can you provide examples of recent developments in the market?
N/A
9. What pricing options are available for accessing the report?
Pricing options include single-user, multi-user, and enterprise licenses priced at USD 3950.00, USD 5925.00, and USD 7900.00 respectively.
10. Is the market size provided in terms of value or volume?
The market size is provided in terms of value, measured in million.
11. Are there any specific market keywords associated with the report?
Yes, the market keyword associated with the report is "Virtual Assistant Services," which aids in identifying and referencing the specific market segment covered.
12. How do I determine which pricing option suits my needs best?
The pricing options vary based on user requirements and access needs. Individual users may opt for single-user licenses, while businesses requiring broader access may choose multi-user or enterprise licenses for cost-effective access to the report.
13. Are there any additional resources or data provided in the Virtual Assistant Services report?
While the report offers comprehensive insights, it's advisable to review the specific contents or supplementary materials provided to ascertain if additional resources or data are available.
14. How can I stay updated on further developments or reports in the Virtual Assistant Services?
To stay informed about further developments, trends, and reports in the Virtual Assistant Services, consider subscribing to industry newsletters, following relevant companies and organizations, or regularly checking reputable industry news sources and publications.
Methodology
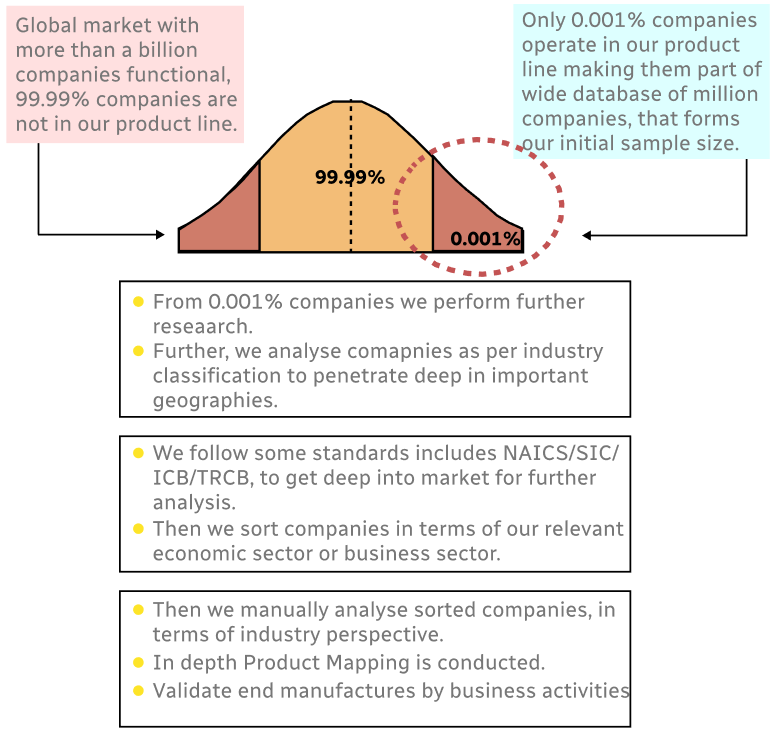
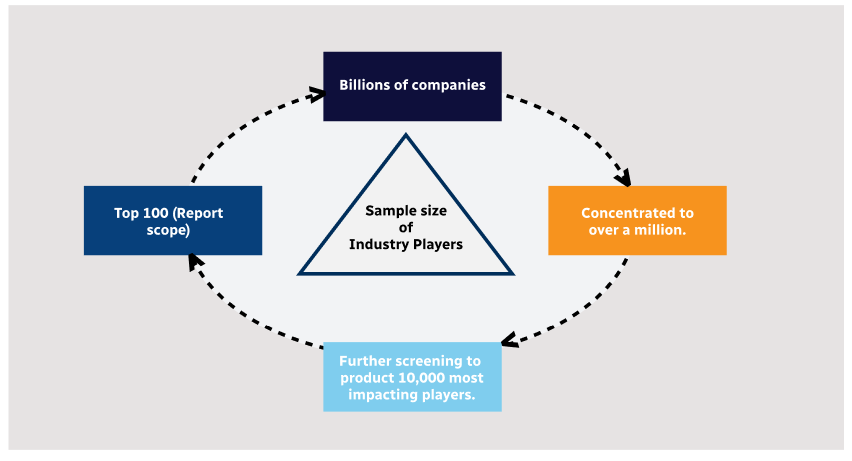
Step 1 - Identification of Relevant Samples Size from Population Database
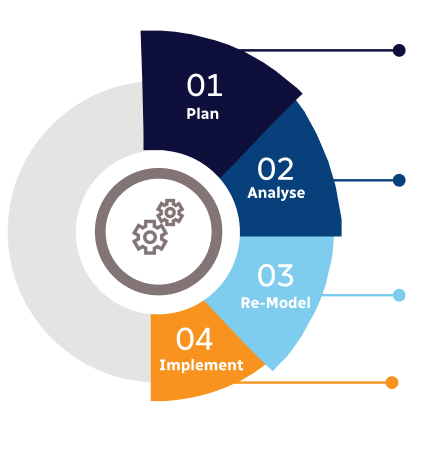
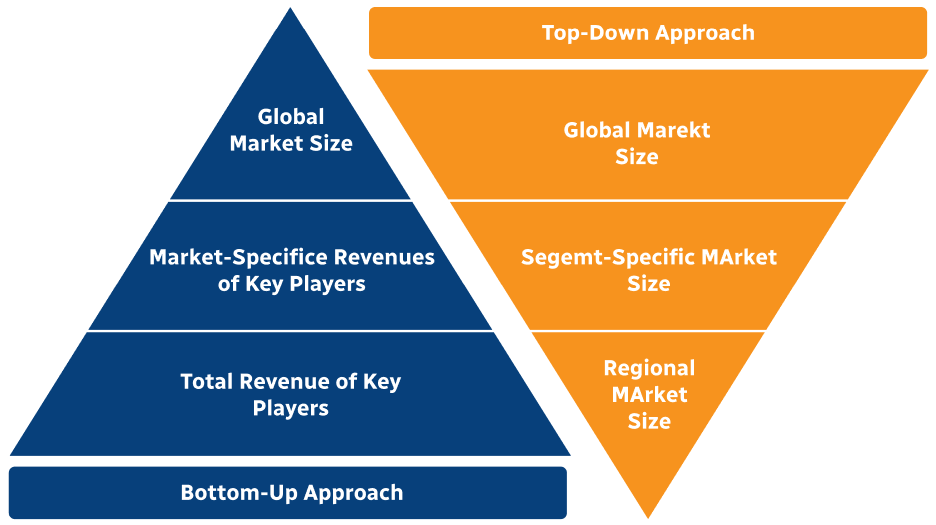
Step 2 - Approaches for Defining Global Market Size (Value, Volume* & Price*)
Note*: In applicable scenarios
Step 3 - Data Sources
Primary Research
- Web Analytics
- Survey Reports
- Research Institute
- Latest Research Reports
- Opinion Leaders
Secondary Research
- Annual Reports
- White Paper
- Latest Press Release
- Industry Association
- Paid Database
- Investor Presentations
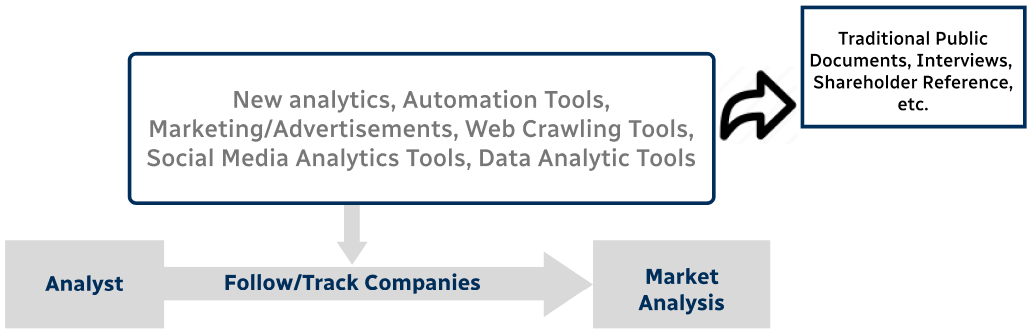
Step 4 - Data Triangulation
Involves using different sources of information in order to increase the validity of a study
These sources are likely to be stakeholders in a program - participants, other researchers, program staff, other community members, and so on.
Then we put all data in single framework & apply various statistical tools to find out the dynamic on the market.
During the analysis stage, feedback from the stakeholder groups would be compared to determine areas of agreement as well as areas of divergence