

Key Insights
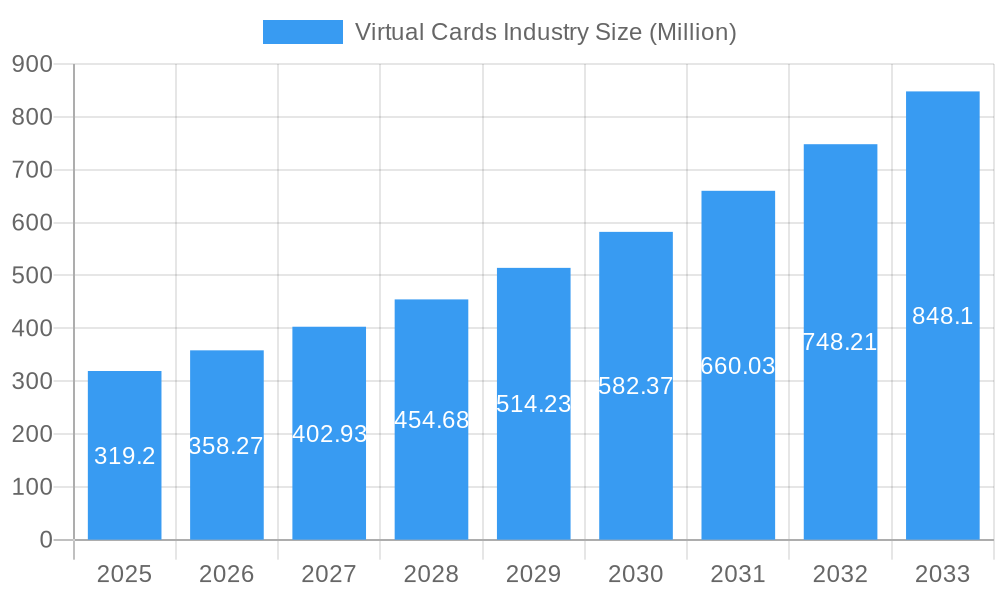
The virtual cards market, valued at $319.20 million in 2025, is experiencing robust growth, projected to expand at a Compound Annual Growth Rate (CAGR) exceeding 12% from 2025 to 2033. This surge is driven by several key factors. The increasing adoption of digital payment methods across both B2B and B2C sectors is a primary driver, fueled by the convenience, security, and enhanced control offered by virtual cards. Furthermore, the rising need for efficient expense management solutions within businesses and the growing preference for contactless transactions among consumers are significantly boosting market demand. Specific segments like B2B virtual cards are witnessing particularly strong growth due to their ability to streamline procurement processes and improve financial oversight. The geographically diverse market, with notable contributions from North America and Europe, shows strong potential for expansion in Asia-Pacific and other emerging markets as digital infrastructure improves and financial inclusion initiatives advance. Competition is intense, with established players like American Express and Mastercard alongside fintech disruptors vying for market share. While regulatory hurdles and security concerns pose some challenges, the overall market outlook remains exceptionally positive.
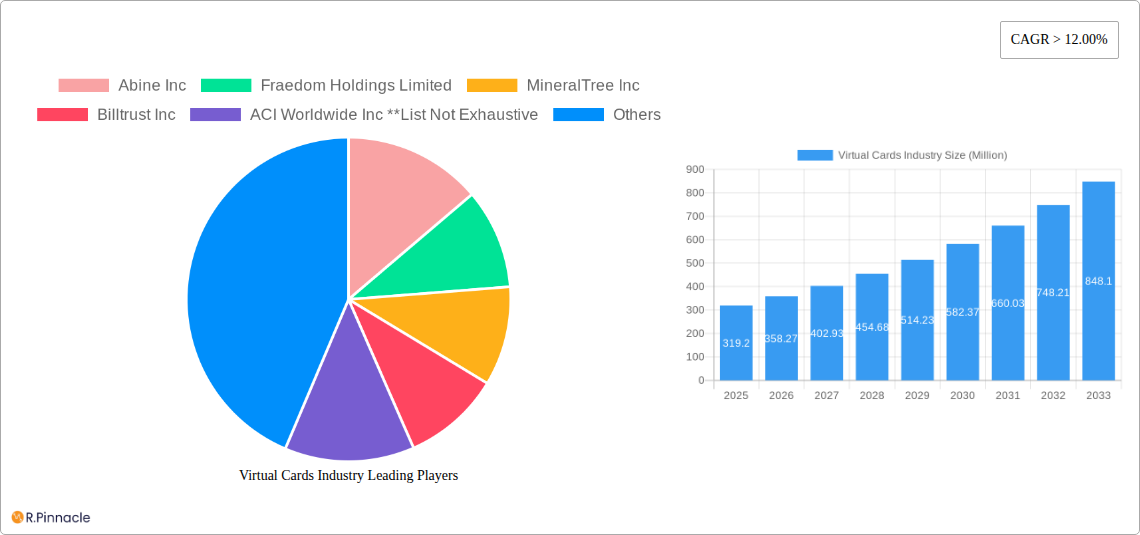
Virtual Cards Industry Market Size (In Million)
The market segmentation reveals strong demand across various product types. B2B virtual cards, offering streamlined payment and expense management, are witnessing significant adoption by businesses of all sizes. Similarly, B2C virtual cards, particularly those facilitating remote payments and POS transactions, are gaining popularity due to the increasing preference for contactless and digital payments. The consumer use segment represents a substantial portion of the market, driven by the convenience and security features offered by virtual cards. The business use segment is also expanding rapidly, reflecting the growing need for efficient financial management within organizations. Geographic expansion presents significant opportunities; while North America and Europe currently hold substantial market share, regions like Asia-Pacific are poised for substantial growth given the rising adoption of digital payments and increasing smartphone penetration. The competitive landscape is dynamic, with a mix of established financial institutions and innovative fintech companies competing to provide innovative and secure virtual card solutions.
Virtual Cards Industry Company Market Share
Virtual Cards Industry Report: 2019-2033 Market Analysis & Forecast
This comprehensive report provides a detailed analysis of the global virtual cards industry, offering invaluable insights for industry professionals, investors, and strategic decision-makers. The study period covers 2019-2033, with a base year of 2025 and a forecast period of 2025-2033. The report projects a market valued at $xx Million in 2025, experiencing robust growth throughout the forecast period.
Virtual Cards Industry Market Structure & Innovation Trends
The virtual cards market exhibits a moderately concentrated structure, with key players like Mastercard Incorporated, American Express Company, and JPMorgan Chase & Co holding significant market share. However, the emergence of fintech companies and innovative payment solutions is fostering increased competition. Innovation is driven by advancements in mobile technology, digital wallets, and enhanced security features. Regulatory frameworks, particularly concerning data privacy and fraud prevention, significantly influence market dynamics. Product substitutes, such as traditional physical cards and other digital payment methods, exert competitive pressure. End-user demographics are evolving, with a significant increase in both consumer and business adoption. M&A activity is considerable, with deal values exceeding $xx Million in recent years, indicating industry consolidation and strategic expansion.
- Market Concentration: Moderately concentrated, with top players holding approximately xx% market share (2024).
- Innovation Drivers: Mobile technology, enhanced security, digital wallets.
- Regulatory Frameworks: GDPR, PSD2, and regional payment regulations impact market operations.
- M&A Activity: Deal values exceeding $xx Million annually in recent years.
Virtual Cards Industry Market Dynamics & Trends
The virtual cards market is undergoing a period of robust expansion, propelled by the accelerating shift towards digital payments, the burgeoning e-commerce landscape, and an ever-increasing demand for secure, swift, and streamlined transaction processing. Disruptive technological advancements, including the transformative potential of blockchain technology and the sophisticated capabilities of AI-powered fraud detection systems, are actively reshaping the industry's trajectory. Concurrently, consumer preferences are evolving, leaning towards the convenience of contactless payments and the demand for personalized financial solutions that cater to individual needs. This dynamic environment is characterized by intense competitive pressures, which are, in turn, fostering groundbreaking innovation and driving down operational costs. For the projected forecast period spanning 2025-2033, the Compound Annual Growth Rate (CAGR) is estimated to be around xx%, with market penetration anticipated to reach approximately xx% by the conclusion of 2033.
Dominant Regions & Segments in Virtual Cards Industry
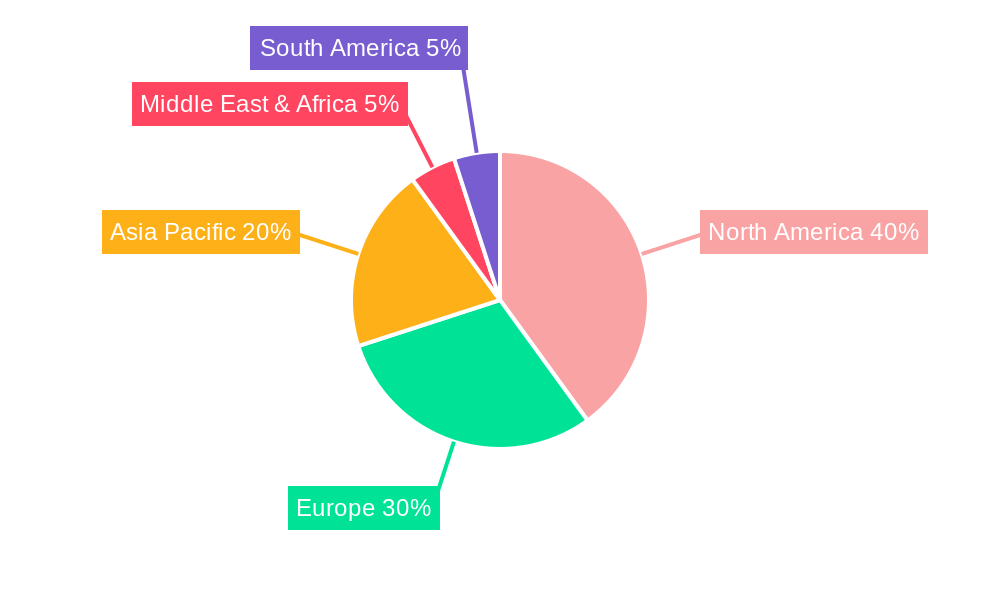
Currently, the North American region commands a leading position in the virtual cards market, a dominance attributed to its advanced technological infrastructure, high levels of internet penetration, and a well-established consumer propensity for adopting digital payment methods. However, the Asia-Pacific region is on the cusp of witnessing substantial growth, fueled by its rapid economic expansion and the pervasive increase in smartphone usage. Within the various segments of the market:
-
Product Type: B2B virtual cards presently hold the most significant market share, largely driven by the imperative for more efficient and streamlined business-to-business transactions. B2C remote payment virtual cards are experiencing remarkable growth, largely propelled by the surge in online shopping activities. B2C POS virtual cards are also steadily gaining momentum and market traction.
-
End User: Business use continues to be the dominant category, primarily owing to the needs of corporate expense management and procurement processes. Consumer use is also exhibiting considerable growth, driven by the inherent convenience and enhanced security that virtual cards offer.
-
Key Drivers (Regional):
- North America: Characterized by its sophisticated technology infrastructure and a high degree of digital literacy among its population.
- Asia-Pacific: Driven by rapid economic development and a continually rising smartphone penetration rate.
- Europe: Influenced by stringent regulatory frameworks that are actively encouraging the adoption of secure and compliant payment methods.
Virtual Cards Industry Product Innovations
Recent product innovations focus on enhancing security, improving user experience, and integrating with other financial services. The incorporation of biometric authentication, tokenization, and AI-powered fraud prevention is becoming increasingly common. Virtual cards are being integrated with loyalty programs and other reward systems to improve customer engagement. These innovations are improving market fit by addressing key pain points such as fraud risk and transaction complexities.
Report Scope & Segmentation Analysis
This comprehensive report meticulously segments the virtual cards market based on product type, encompassing B2B Virtual Cards, B2C Remote Payment Virtual Cards, and B2C POS Virtual Cards, as well as by end-user, including Consumer Use and Business Use. Each segment undergoes in-depth analysis, evaluating market size, growth projections, and prevailing competitive dynamics. Detailed and precise forecasts are provided for each segment for the period spanning 2025-2033. B2B virtual cards are projected to expand at a Compound Annual Growth Rate (CAGR) of approximately xx%, while the B2C segments collectively anticipate a projected CAGR of around xx%. The business use segment is anticipated to maintain its dominance in terms of revenue generation.
Key Drivers of Virtual Cards Industry Growth
Several factors are driving the growth of the virtual cards industry. Technological advancements, such as the development of contactless payment technologies and improved mobile payment platforms, are significant drivers. Economic factors, such as the rise of e-commerce and the increasing adoption of digital payments, are fueling market expansion. Favorable regulatory environments, which encourage the use of secure and efficient payment methods, also contribute to market growth. Examples include the increasing adoption of EMV standards and regulations fostering open banking initiatives.
Challenges in the Virtual Cards Industry Sector
The virtual cards industry faces several challenges. Stringent regulatory compliance requirements, particularly regarding data security and fraud prevention, pose a significant hurdle. Supply chain disruptions can impact the availability of essential components and services. Intense competition from established players and new entrants puts pressure on margins. The cost of maintaining robust security measures, which require constant updates to address evolving threats, also presents a significant challenge. These factors combined can reduce market expansion by approximately xx% annually.
Emerging Opportunities in Virtual Cards Industry
The virtual cards industry is a fertile ground for emerging opportunities. The strategic expansion into new and developing economies, particularly those with high smartphone penetration rates, presents substantial avenues for exponential growth. Furthermore, the seamless integration of virtual cards with a wider ecosystem of financial services, such as advanced budgeting applications and rewarding loyalty programs, opens up significant prospects for deepening customer engagement and enhancing user experience. The ongoing integration of cutting-edge blockchain technology and sophisticated AI for ensuring secure and highly efficient transactions is poised to further accelerate adoption rates and unlock new market potentials.
Leading Players in the Virtual Cards Industry Market
- Abine Inc
- Fraedom Holdings Limited
- MineralTree Inc
- Billtrust Inc
- ACI Worldwide Inc
- American Express Company
- Mastercard Incorporated
- JPMorgan Chase & Co
- Alipay com Co Ltd
- Skrill USA Inc
Key Developments in Virtual Cards Industry
- December 2023: Conferma Pay and Mastercard expanded their partnership to enable mobile virtual card payments, significantly boosting the adoption of contactless payments for corporate clients.
- May 2022: Mastercard and OPay partnered to expand digital commerce across the Middle East and Africa, fostering financial inclusion and driving market growth in previously underserved regions.
Future Outlook for Virtual Cards Industry Market
The virtual cards industry is poised for continued growth, driven by ongoing technological advancements, expanding digital adoption, and increasing demand for secure and convenient payment solutions. Strategic partnerships, innovative product development, and expansion into new markets will be key factors shaping future market dynamics. The market is anticipated to witness significant growth, exceeding $xx Million by 2033.
Virtual Cards Industry Segmentation
-
1. Product Type
- 1.1. B2B Virtual Cards
- 1.2. B2C Remote Payment Virtual Cards
- 1.3. B2C POS Virtual Cards
-
2. End User
- 2.1. Consumer Use
- 2.2. Business Use
Virtual Cards Industry Segmentation By Geography
-
1. North America
- 1.1. United States
- 1.2. Canada
- 1.3. Rest of North America
-
2. South America
- 2.1. Brazil
- 2.2. Peru
- 2.3. Rest of South America
-
3. Europe
- 3.1. United Kingdom
- 3.2. Germany
- 3.3. Rest of Europe
-
4. Asia Pacific
- 4.1. India
- 4.2. Japan
- 4.3. Rest of Asia Pacific
- 5. Middle East
-
6. Saudi Arabia
- 6.1. United Arab Emirates
- 6.2. Rest of Middle East
Virtual Cards Industry Regional Market Share
Geographic Coverage of Virtual Cards Industry
Virtual Cards Industry REPORT HIGHLIGHTS
| Aspects | Details |
|---|---|
| Study Period | 2020-2034 |
| Base Year | 2025 |
| Estimated Year | 2026 |
| Forecast Period | 2026-2034 |
| Historical Period | 2020-2025 |
| Growth Rate | CAGR of > 12.00% from 2020-2034 |
| Segmentation |
|
Table of Contents
- 1. Introduction
- 1.1. Research Scope
- 1.2. Market Segmentation
- 1.3. Research Objective
- 1.4. Definitions and Assumptions
- 2. Executive Summary
- 2.1. Market Snapshot
- 3. Market Dynamics
- 3.1. Market Drivers
- 3.2. Market Restrains
- 3.3. Market Trends
- 3.4. Market Opportunities
- 4. Market Factor Analysis
- 4.1. Porters Five Forces
- 4.1.1. Bargaining Power of Suppliers
- 4.1.2. Bargaining Power of Buyers
- 4.1.3. Threat of New Entrants
- 4.1.4. Threat of Substitutes
- 4.1.5. Competitive Rivalry
- 4.2. PESTEL analysis
- 4.3. BCG Analysis
- 4.3.1. Stars (High Growth, High Market Share)
- 4.3.2. Cash Cows (Low Growth, High Market Share)
- 4.3.3. Question Mark (High Growth, Low Market Share)
- 4.3.4. Dogs (Low Growth, Low Market Share)
- 4.4. Ansoff Matrix Analysis
- 4.5. Supply Chain Analysis
- 4.6. Regulatory Landscape
- 4.7. Current Market Potential and Opportunity Assessment (TAM–SAM–SOM Framework)
- 4.8. PRI Analyst Note
- 4.1. Porters Five Forces
- 5. Market Analysis, Insights and Forecast 2021-2033
- 5.1. Market Analysis, Insights and Forecast - by Product Type
- 5.1.1. B2B Virtual Cards
- 5.1.2. B2C Remote Payment Virtual Cards
- 5.1.3. B2C POS Virtual Cards
- 5.2. Market Analysis, Insights and Forecast - by End User
- 5.2.1. Consumer Use
- 5.2.2. Business Use
- 5.3. Market Analysis, Insights and Forecast - by Region
- 5.3.1. North America
- 5.3.2. South America
- 5.3.3. Europe
- 5.3.4. Asia Pacific
- 5.3.5. Middle East
- 5.3.6. Saudi Arabia
- 5.1. Market Analysis, Insights and Forecast - by Product Type
- 6. Virtual Cards Industry Analysis, Insights and Forecast, 2021-2033
- 6.1. Market Analysis, Insights and Forecast - by Product Type
- 6.1.1. B2B Virtual Cards
- 6.1.2. B2C Remote Payment Virtual Cards
- 6.1.3. B2C POS Virtual Cards
- 6.2. Market Analysis, Insights and Forecast - by End User
- 6.2.1. Consumer Use
- 6.2.2. Business Use
- 6.1. Market Analysis, Insights and Forecast - by Product Type
- 7. North America Virtual Cards Industry Analysis, Insights and Forecast, 2020-2032
- 7.1. Market Analysis, Insights and Forecast - by Product Type
- 7.1.1. B2B Virtual Cards
- 7.1.2. B2C Remote Payment Virtual Cards
- 7.1.3. B2C POS Virtual Cards
- 7.2. Market Analysis, Insights and Forecast - by End User
- 7.2.1. Consumer Use
- 7.2.2. Business Use
- 7.1. Market Analysis, Insights and Forecast - by Product Type
- 8. South America Virtual Cards Industry Analysis, Insights and Forecast, 2020-2032
- 8.1. Market Analysis, Insights and Forecast - by Product Type
- 8.1.1. B2B Virtual Cards
- 8.1.2. B2C Remote Payment Virtual Cards
- 8.1.3. B2C POS Virtual Cards
- 8.2. Market Analysis, Insights and Forecast - by End User
- 8.2.1. Consumer Use
- 8.2.2. Business Use
- 8.1. Market Analysis, Insights and Forecast - by Product Type
- 9. Europe Virtual Cards Industry Analysis, Insights and Forecast, 2020-2032
- 9.1. Market Analysis, Insights and Forecast - by Product Type
- 9.1.1. B2B Virtual Cards
- 9.1.2. B2C Remote Payment Virtual Cards
- 9.1.3. B2C POS Virtual Cards
- 9.2. Market Analysis, Insights and Forecast - by End User
- 9.2.1. Consumer Use
- 9.2.2. Business Use
- 9.1. Market Analysis, Insights and Forecast - by Product Type
- 10. Asia Pacific Virtual Cards Industry Analysis, Insights and Forecast, 2020-2032
- 10.1. Market Analysis, Insights and Forecast - by Product Type
- 10.1.1. B2B Virtual Cards
- 10.1.2. B2C Remote Payment Virtual Cards
- 10.1.3. B2C POS Virtual Cards
- 10.2. Market Analysis, Insights and Forecast - by End User
- 10.2.1. Consumer Use
- 10.2.2. Business Use
- 10.1. Market Analysis, Insights and Forecast - by Product Type
- 11. Middle East Virtual Cards Industry Analysis, Insights and Forecast, 2020-2032
- 11.1. Market Analysis, Insights and Forecast - by Product Type
- 11.1.1. B2B Virtual Cards
- 11.1.2. B2C Remote Payment Virtual Cards
- 11.1.3. B2C POS Virtual Cards
- 11.2. Market Analysis, Insights and Forecast - by End User
- 11.2.1. Consumer Use
- 11.2.2. Business Use
- 11.1. Market Analysis, Insights and Forecast - by Product Type
- 12. Saudi Arabia Virtual Cards Industry Analysis, Insights and Forecast, 2020-2032
- 12.1. Market Analysis, Insights and Forecast - by Product Type
- 12.1.1. B2B Virtual Cards
- 12.1.2. B2C Remote Payment Virtual Cards
- 12.1.3. B2C POS Virtual Cards
- 12.2. Market Analysis, Insights and Forecast - by End User
- 12.2.1. Consumer Use
- 12.2.2. Business Use
- 12.1. Market Analysis, Insights and Forecast - by Product Type
- 13. Competitive Analysis
- 13.1. Company Profiles
- 13.1.1 Abine Inc
- 13.1.1.1. Company Overview
- 13.1.1.2. Products
- 13.1.1.3. Company Financials
- 13.1.1.4. SWOT Analysis
- 13.1.2 Fraedom Holdings Limited
- 13.1.2.1. Company Overview
- 13.1.2.2. Products
- 13.1.2.3. Company Financials
- 13.1.2.4. SWOT Analysis
- 13.1.3 MineralTree Inc
- 13.1.3.1. Company Overview
- 13.1.3.2. Products
- 13.1.3.3. Company Financials
- 13.1.3.4. SWOT Analysis
- 13.1.4 Billtrust Inc
- 13.1.4.1. Company Overview
- 13.1.4.2. Products
- 13.1.4.3. Company Financials
- 13.1.4.4. SWOT Analysis
- 13.1.5 ACI Worldwide Inc **List Not Exhaustive
- 13.1.5.1. Company Overview
- 13.1.5.2. Products
- 13.1.5.3. Company Financials
- 13.1.5.4. SWOT Analysis
- 13.1.6 American Express Company
- 13.1.6.1. Company Overview
- 13.1.6.2. Products
- 13.1.6.3. Company Financials
- 13.1.6.4. SWOT Analysis
- 13.1.7 Mastercard Incorporated
- 13.1.7.1. Company Overview
- 13.1.7.2. Products
- 13.1.7.3. Company Financials
- 13.1.7.4. SWOT Analysis
- 13.1.8 JPMorgan Chase & Co
- 13.1.8.1. Company Overview
- 13.1.8.2. Products
- 13.1.8.3. Company Financials
- 13.1.8.4. SWOT Analysis
- 13.1.9 Alipay com Co Ltd
- 13.1.9.1. Company Overview
- 13.1.9.2. Products
- 13.1.9.3. Company Financials
- 13.1.9.4. SWOT Analysis
- 13.1.10 Skrill USA Inc
- 13.1.10.1. Company Overview
- 13.1.10.2. Products
- 13.1.10.3. Company Financials
- 13.1.10.4. SWOT Analysis
- 13.1.1 Abine Inc
- 13.2. Market Entropy
- 13.2.1 Company's Key Areas Served
- 13.2.2 Recent Developments
- 13.3. Company Market Share Analysis 2025
- 13.3.1 Top 5 Companies Market Share Analysis
- 13.3.2 Top 3 Companies Market Share Analysis
- 13.4. List of Potential Customers
- 14. Research Methodology
List of Figures
- Figure 1: Virtual Cards Industry Revenue Breakdown (Million, %) by Product 2025 & 2033
- Figure 2: Virtual Cards Industry Share (%) by Company 2025
List of Tables
- Table 1: Virtual Cards Industry Revenue Million Forecast, by Product Type 2020 & 2033
- Table 2: Virtual Cards Industry Revenue Million Forecast, by End User 2020 & 2033
- Table 3: Virtual Cards Industry Revenue Million Forecast, by Region 2020 & 2033
- Table 4: Virtual Cards Industry Revenue Million Forecast, by Product Type 2020 & 2033
- Table 5: Virtual Cards Industry Revenue Million Forecast, by End User 2020 & 2033
- Table 6: Virtual Cards Industry Revenue Million Forecast, by Country 2020 & 2033
- Table 7: United States Virtual Cards Industry Revenue (Million) Forecast, by Application 2020 & 2033
- Table 8: Canada Virtual Cards Industry Revenue (Million) Forecast, by Application 2020 & 2033
- Table 9: Rest of North America Virtual Cards Industry Revenue (Million) Forecast, by Application 2020 & 2033
- Table 10: Virtual Cards Industry Revenue Million Forecast, by Product Type 2020 & 2033
- Table 11: Virtual Cards Industry Revenue Million Forecast, by End User 2020 & 2033
- Table 12: Virtual Cards Industry Revenue Million Forecast, by Country 2020 & 2033
- Table 13: Brazil Virtual Cards Industry Revenue (Million) Forecast, by Application 2020 & 2033
- Table 14: Peru Virtual Cards Industry Revenue (Million) Forecast, by Application 2020 & 2033
- Table 15: Rest of South America Virtual Cards Industry Revenue (Million) Forecast, by Application 2020 & 2033
- Table 16: Virtual Cards Industry Revenue Million Forecast, by Product Type 2020 & 2033
- Table 17: Virtual Cards Industry Revenue Million Forecast, by End User 2020 & 2033
- Table 18: Virtual Cards Industry Revenue Million Forecast, by Country 2020 & 2033
- Table 19: United Kingdom Virtual Cards Industry Revenue (Million) Forecast, by Application 2020 & 2033
- Table 20: Germany Virtual Cards Industry Revenue (Million) Forecast, by Application 2020 & 2033
- Table 21: Rest of Europe Virtual Cards Industry Revenue (Million) Forecast, by Application 2020 & 2033
- Table 22: Virtual Cards Industry Revenue Million Forecast, by Product Type 2020 & 2033
- Table 23: Virtual Cards Industry Revenue Million Forecast, by End User 2020 & 2033
- Table 24: Virtual Cards Industry Revenue Million Forecast, by Country 2020 & 2033
- Table 25: India Virtual Cards Industry Revenue (Million) Forecast, by Application 2020 & 2033
- Table 26: Japan Virtual Cards Industry Revenue (Million) Forecast, by Application 2020 & 2033
- Table 27: Rest of Asia Pacific Virtual Cards Industry Revenue (Million) Forecast, by Application 2020 & 2033
- Table 28: Virtual Cards Industry Revenue Million Forecast, by Product Type 2020 & 2033
- Table 29: Virtual Cards Industry Revenue Million Forecast, by End User 2020 & 2033
- Table 30: Virtual Cards Industry Revenue Million Forecast, by Country 2020 & 2033
- Table 31: Virtual Cards Industry Revenue Million Forecast, by Product Type 2020 & 2033
- Table 32: Virtual Cards Industry Revenue Million Forecast, by End User 2020 & 2033
- Table 33: Virtual Cards Industry Revenue Million Forecast, by Country 2020 & 2033
- Table 34: United Arab Emirates Virtual Cards Industry Revenue (Million) Forecast, by Application 2020 & 2033
- Table 35: Rest of Middle East Virtual Cards Industry Revenue (Million) Forecast, by Application 2020 & 2033
Frequently Asked Questions
1. What is the projected Compound Annual Growth Rate (CAGR) of the Virtual Cards Industry?
The projected CAGR is approximately > 12.00%.
2. Which companies are prominent players in the Virtual Cards Industry?
Key companies in the market include Abine Inc, Fraedom Holdings Limited, MineralTree Inc, Billtrust Inc, ACI Worldwide Inc **List Not Exhaustive, American Express Company, Mastercard Incorporated, JPMorgan Chase & Co, Alipay com Co Ltd, Skrill USA Inc.
3. What are the main segments of the Virtual Cards Industry?
The market segments include Product Type, End User.
4. Can you provide details about the market size?
The market size is estimated to be USD 319.20 Million as of 2022.
5. What are some drivers contributing to market growth?
Digital Transformation is Driving the Market.
6. What are the notable trends driving market growth?
Increasing Online Transactions is Augmenting the Virtual Cards Market in Asia-Pacific.
7. Are there any restraints impacting market growth?
Connectivity and Technical Issues is Restraining the Market.
8. Can you provide examples of recent developments in the market?
December 2023: Conferma Pay and Mastercard expanded their partnership to enable mobile virtual card payments. Mastercard’s commercial bank clients were expected to be able to offer the convenience of contactless virtual card payments to their corporate customers using Conferma Pay.
9. What pricing options are available for accessing the report?
Pricing options include single-user, multi-user, and enterprise licenses priced at USD 3800, USD 4500, and USD 5800 respectively.
10. Is the market size provided in terms of value or volume?
The market size is provided in terms of value, measured in Million.
11. Are there any specific market keywords associated with the report?
Yes, the market keyword associated with the report is "Virtual Cards Industry," which aids in identifying and referencing the specific market segment covered.
12. How do I determine which pricing option suits my needs best?
The pricing options vary based on user requirements and access needs. Individual users may opt for single-user licenses, while businesses requiring broader access may choose multi-user or enterprise licenses for cost-effective access to the report.
13. Are there any additional resources or data provided in the Virtual Cards Industry report?
While the report offers comprehensive insights, it's advisable to review the specific contents or supplementary materials provided to ascertain if additional resources or data are available.
14. How can I stay updated on further developments or reports in the Virtual Cards Industry?
To stay informed about further developments, trends, and reports in the Virtual Cards Industry, consider subscribing to industry newsletters, following relevant companies and organizations, or regularly checking reputable industry news sources and publications.
Methodology
Step 1 - Identification of Relevant Samples Size from Population Database


Step 2 - Approaches for Defining Global Market Size (Value, Volume* & Price*)

Note*: In applicable scenarios
Step 3 - Data Sources
Primary Research
- Web Analytics
- Survey Reports
- Research Institute
- Latest Research Reports
- Opinion Leaders
Secondary Research
- Annual Reports
- White Paper
- Latest Press Release
- Industry Association
- Paid Database
- Investor Presentations

Step 4 - Data Triangulation
Involves using different sources of information in order to increase the validity of a study
These sources are likely to be stakeholders in a program - participants, other researchers, program staff, other community members, and so on.
Then we put all data in single framework & apply various statistical tools to find out the dynamic on the market.
During the analysis stage, feedback from the stakeholder groups would be compared to determine areas of agreement as well as areas of divergence