

Key Insights
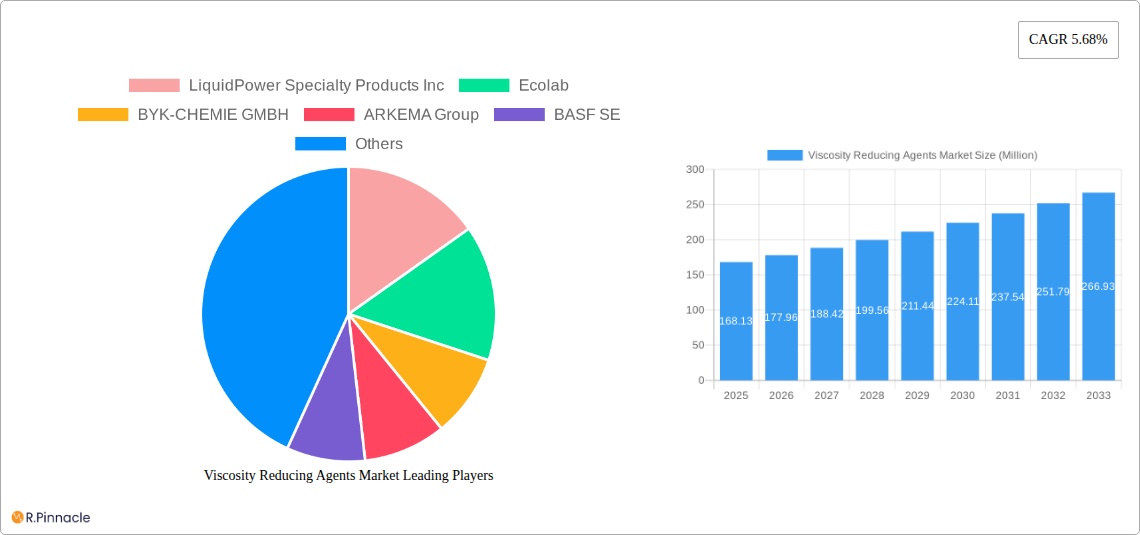
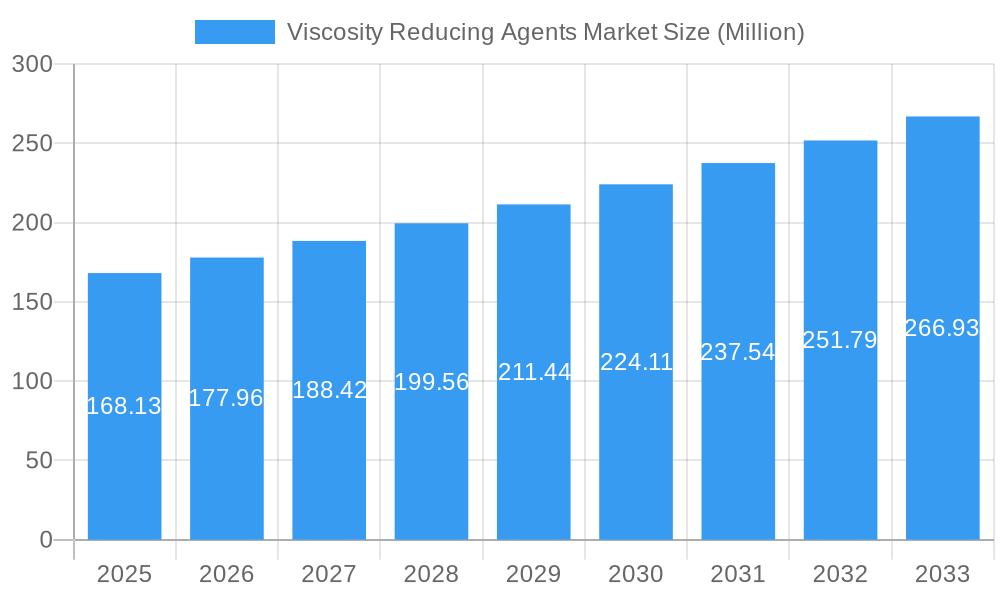
The global viscosity reducing agents market, valued at $168.13 million in 2025, is projected to experience robust growth, driven by a compound annual growth rate (CAGR) of 5.68% from 2025 to 2033. This expansion is fueled by several key factors. The burgeoning oil and gas industry, demanding efficient extraction and transportation of viscous fluids, significantly contributes to market growth. Furthermore, the increasing demand for high-performance paints and coatings, requiring viscosity modifiers for optimal application and durability, boosts market volume. The plastics industry's reliance on viscosity control during manufacturing processes also serves as a major driver. Advances in additive technology, leading to the development of more effective and environmentally friendly viscosity reducers, further stimulate market expansion. Specific segments like drag reducing agents and surfactants & additives are expected to witness significant growth due to their wide-ranging applications across various end-use industries. Geographic expansion, particularly in rapidly developing economies of Asia-Pacific, presents lucrative opportunities for market players.
Viscosity Reducing Agents Market Market Size (In Million)
However, the market faces certain constraints. Fluctuations in raw material prices and stringent environmental regulations concerning the use of certain chemicals can impact market growth. Competition among established players and the emergence of new entrants can also put pressure on profit margins. Nevertheless, the overall market outlook remains positive, with continuous innovation and the development of sustainable solutions likely to mitigate these challenges. The market is segmented by type (drag reducing agents, surfactants & additives, dispersing agents, others) and end-user industry (oil & gas, paints & coatings, plastics, other manufacturing industries). Key players such as LiquidPower Specialty Products Inc, Ecolab, BYK-CHEMIE GMBH, and BASF SE are actively engaged in research and development, contributing to market innovation and expansion. The strategic partnerships and acquisitions undertaken by these companies further influence market dynamics, driving competition and shaping future growth trajectories.
Viscosity Reducing Agents Market Company Market Share
Viscosity Reducing Agents Market: A Comprehensive Report (2019-2033)
This in-depth report provides a comprehensive analysis of the Viscosity Reducing Agents market, offering valuable insights for industry professionals, investors, and stakeholders. The study covers the period 2019-2033, with 2025 as the base year and a forecast period of 2025-2033. The report utilizes a robust methodology to analyze market trends, dynamics, and future growth potential, incorporating data from the historical period (2019-2024) and providing detailed segmentations across type and end-user industries. The market size is valued in Millions throughout the report.
Viscosity Reducing Agents Market Structure & Innovation Trends
The Viscosity Reducing Agents market exhibits a moderately concentrated structure, with key players like Ecolab, BASF SE, and The Lubrizol Corporation holding significant market share. Market share data for 2024 estimates BASF SE at approximately xx%, Ecolab at xx%, and Lubrizol at xx%, while the remaining market share is distributed across other players including LiquidPower Specialty Products Inc, BYK-CHEMIE GMBH, ARKEMA Group, Alberta Treating Chemicals LTD, Qflo, Oil Flux, Baker Hughes Company, NuGenTecx, CHINAFLOC, and Innospec. Innovation is primarily driven by the need for improved efficiency, reduced environmental impact, and the development of specialized agents for niche applications. Regulatory frameworks, particularly those concerning environmental protection and chemical safety, significantly influence market dynamics. Product substitutes, such as alternative rheology modifiers, pose a competitive threat, although their market penetration remains relatively low. The market has witnessed several mergers and acquisitions (M&A) activities in recent years, with deal values ranging from xx Million to xx Million, primarily focused on expanding product portfolios and geographic reach. End-user demographics are heavily influenced by industry trends in oil & gas, paints & coatings, and plastics manufacturing.
Viscosity Reducing Agents Market Dynamics & Trends
The global Viscosity Reducing Agents market is projected to experience a Compound Annual Growth Rate (CAGR) of xx% during the forecast period (2025-2033). This growth is fueled by several key factors, including the increasing demand for efficient drilling fluids in the oil & gas sector, the expanding paints and coatings industry, and the rising use of viscosity reducing agents in plastics manufacturing. Technological advancements, such as the development of bio-based and environmentally friendly agents, are disrupting the market landscape, driving a shift towards sustainable solutions. Consumer preferences are evolving towards high-performance, cost-effective, and environmentally conscious products. Competitive dynamics are characterized by intense rivalry among established players and the emergence of new entrants offering innovative products and technologies. Market penetration of new viscosity reducers remains at xx% as of 2024, expected to rise to xx% by 2033, primarily due to innovations in the oil and gas sector.
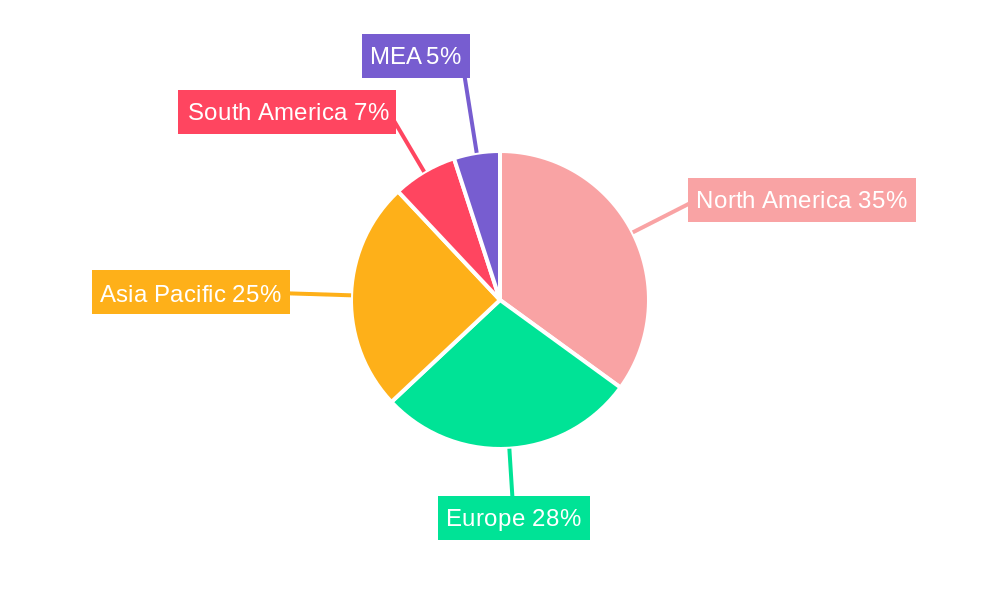
Dominant Regions & Segments in Viscosity Reducing Agents Market
Dominant Region: North America currently holds the largest market share, driven by robust growth in the oil & gas and paints & coatings sectors. This dominance is further reinforced by strong technological advancements and a well-established industrial base. Europe holds a significant market share and is also witnessing continuous growth.
Dominant Segments:
- By Type: Drag Reducing Agents currently represent the largest segment due to its wide applications in pipelines and fluid transfer. Surfactants & Additives is expected to witness significant growth driven by increasing demand for enhanced performance in various applications.
- By End-user Industry: The Oil & Gas sector dominates the market due to extensive usage in drilling and production operations. The Paints & Coatings industry exhibits robust growth potential as these applications require specialized viscosity modifiers.
Key drivers for regional dominance include favorable economic policies supporting industrial growth, well-developed infrastructure facilitating efficient production and distribution, and the presence of major industry players.
Viscosity Reducing Agents Market Product Innovations
Recent product developments focus on enhancing performance characteristics such as temperature stability, shear thinning behavior, and environmental compatibility. New applications are emerging in various industries, particularly in advanced materials and nanotechnology. These innovations provide competitive advantages by improving efficiency, reducing costs, and meeting stringent environmental regulations. The trend is toward developing bio-based and sustainable solutions to address growing environmental concerns.
Report Scope & Segmentation Analysis
The report comprehensively analyzes the Viscosity Reducing Agents market based on type and end-user industry.
By Type: Drag Reducing Agents, Surfactants & Additives, Dispersing Agents, and Others. Each segment's growth projection, market size, and competitive landscape are detailed within the report.
By End-user Industry: Oil & Gas, Paints & Coatings, Plastics, and Other Manufacturing Industries. Each segment's market dynamics, including growth rates and key players, are examined.
Key Drivers of Viscosity Reducing Agents Market Growth
The market's growth is primarily driven by technological advancements leading to improved product efficiency, increasing demand from major end-use industries like oil & gas and paints & coatings, and supportive government policies promoting sustainable solutions. Stringent environmental regulations are also driving the adoption of eco-friendly viscosity reducing agents.
Challenges in the Viscosity Reducing Agents Market Sector
Challenges include fluctuating raw material prices, intense competition, and stringent regulatory compliance requirements. Supply chain disruptions can impact production and distribution, while competitive pressures necessitate continuous innovation and cost optimization. These factors can lead to price volatility and reduced profit margins.
Emerging Opportunities in Viscosity Reducing Agents Market
Emerging opportunities lie in the development of bio-based and sustainable alternatives, expansion into niche markets such as additive manufacturing and 3D printing, and the application of advanced technologies like nanotechnology to enhance product performance. Growth in developing economies also presents significant opportunities for market expansion.
Leading Players in the Viscosity Reducing Agents Market Market
- LiquidPower Specialty Products Inc
- Ecolab
- BYK-CHEMIE GMBH
- ARKEMA Group
- BASF SE
- Alberta Treating Chemicals LTD
- Qflo
- The Lubrizol Corporation
- Oil Flux
- Baker Hughes Company
- NuGenTecx
- CHINAFLOC
- Innospec
Key Developments in Viscosity Reducing Agents Market Industry
- January 2023: BASF SE launched a new range of sustainable viscosity reducing agents.
- June 2022: Ecolab acquired a smaller competitor, expanding its market share.
- October 2021: A new joint venture between ARKEMA Group and a Chinese company was announced, focused on the Asian market.
- (Add further developments with year/month as available)
Future Outlook for Viscosity Reducing Agents Market Market
The Viscosity Reducing Agents market is poised for sustained growth, driven by technological innovations, expanding end-use industries, and the increasing adoption of sustainable solutions. Strategic partnerships, product diversification, and market expansion into emerging economies will be crucial for success in this dynamic market. The rising demand for high-performance, cost-effective, and environmentally friendly products will continue to shape future market trends.
Viscosity Reducing Agents Market Segmentation
-
1. Type
- 1.1. Drag Reducing Agents
- 1.2. Surfactants & Additives
- 1.3. Dispersing Agents
- 1.4. Others
-
2. End-user Industry
- 2.1. Oil & Gas
- 2.2. Paints & Coatings
- 2.3. Plastics
- 2.4. Other Manufacturing Industries
Viscosity Reducing Agents Market Segmentation By Geography
-
1. Asia Pacific
- 1.1. China
- 1.2. India
- 1.3. Japan
- 1.4. South Korea
- 1.5. Rest of Asia Pacific
-
2. North America
- 2.1. United States
- 2.2. Canada
- 2.3. Mexico
-
3. Europe
- 3.1. Germany
- 3.2. United Kingdom
- 3.3. Italy
- 3.4. France
- 3.5. Rest of Europe
-
4. South America
- 4.1. Brazil
- 4.2. Argentina
- 4.3. Rest of South America
-
5. Middle East and Africa
- 5.1. Saudi Arabia
- 5.2. South Africa
- 5.3. Rest of Middle East and Africa
Viscosity Reducing Agents Market Regional Market Share
Geographic Coverage of Viscosity Reducing Agents Market
Viscosity Reducing Agents Market REPORT HIGHLIGHTS
| Aspects | Details |
|---|---|
| Study Period | 2020-2034 |
| Base Year | 2025 |
| Estimated Year | 2026 |
| Forecast Period | 2026-2034 |
| Historical Period | 2020-2025 |
| Growth Rate | CAGR of 5.68% from 2020-2034 |
| Segmentation |
|
Table of Contents
- 1. Introduction
- 1.1. Research Scope
- 1.2. Market Segmentation
- 1.3. Research Objective
- 1.4. Definitions and Assumptions
- 2. Executive Summary
- 2.1. Market Snapshot
- 3. Market Dynamics
- 3.1. Market Drivers
- 3.2. Market Restrains
- 3.3. Market Trends
- 3.4. Market Opportunities
- 4. Market Factor Analysis
- 4.1. Porters Five Forces
- 4.1.1. Bargaining Power of Suppliers
- 4.1.2. Bargaining Power of Buyers
- 4.1.3. Threat of New Entrants
- 4.1.4. Threat of Substitutes
- 4.1.5. Competitive Rivalry
- 4.2. PESTEL analysis
- 4.3. BCG Analysis
- 4.3.1. Stars (High Growth, High Market Share)
- 4.3.2. Cash Cows (Low Growth, High Market Share)
- 4.3.3. Question Mark (High Growth, Low Market Share)
- 4.3.4. Dogs (Low Growth, Low Market Share)
- 4.4. Ansoff Matrix Analysis
- 4.5. Supply Chain Analysis
- 4.6. Regulatory Landscape
- 4.7. Current Market Potential and Opportunity Assessment (TAM–SAM–SOM Framework)
- 4.8. PRI Analyst Note
- 4.1. Porters Five Forces
- 5. Market Analysis, Insights and Forecast 2021-2033
- 5.1. Market Analysis, Insights and Forecast - by Type
- 5.1.1. Drag Reducing Agents
- 5.1.2. Surfactants & Additives
- 5.1.3. Dispersing Agents
- 5.1.4. Others
- 5.2. Market Analysis, Insights and Forecast - by End-user Industry
- 5.2.1. Oil & Gas
- 5.2.2. Paints & Coatings
- 5.2.3. Plastics
- 5.2.4. Other Manufacturing Industries
- 5.3. Market Analysis, Insights and Forecast - by Region
- 5.3.1. Asia Pacific
- 5.3.2. North America
- 5.3.3. Europe
- 5.3.4. South America
- 5.3.5. Middle East and Africa
- 5.1. Market Analysis, Insights and Forecast - by Type
- 6. Global Viscosity Reducing Agents Market Analysis, Insights and Forecast, 2021-2033
- 6.1. Market Analysis, Insights and Forecast - by Type
- 6.1.1. Drag Reducing Agents
- 6.1.2. Surfactants & Additives
- 6.1.3. Dispersing Agents
- 6.1.4. Others
- 6.2. Market Analysis, Insights and Forecast - by End-user Industry
- 6.2.1. Oil & Gas
- 6.2.2. Paints & Coatings
- 6.2.3. Plastics
- 6.2.4. Other Manufacturing Industries
- 6.1. Market Analysis, Insights and Forecast - by Type
- 7. Asia Pacific Viscosity Reducing Agents Market Analysis, Insights and Forecast, 2020-2032
- 7.1. Market Analysis, Insights and Forecast - by Type
- 7.1.1. Drag Reducing Agents
- 7.1.2. Surfactants & Additives
- 7.1.3. Dispersing Agents
- 7.1.4. Others
- 7.2. Market Analysis, Insights and Forecast - by End-user Industry
- 7.2.1. Oil & Gas
- 7.2.2. Paints & Coatings
- 7.2.3. Plastics
- 7.2.4. Other Manufacturing Industries
- 7.1. Market Analysis, Insights and Forecast - by Type
- 8. North America Viscosity Reducing Agents Market Analysis, Insights and Forecast, 2020-2032
- 8.1. Market Analysis, Insights and Forecast - by Type
- 8.1.1. Drag Reducing Agents
- 8.1.2. Surfactants & Additives
- 8.1.3. Dispersing Agents
- 8.1.4. Others
- 8.2. Market Analysis, Insights and Forecast - by End-user Industry
- 8.2.1. Oil & Gas
- 8.2.2. Paints & Coatings
- 8.2.3. Plastics
- 8.2.4. Other Manufacturing Industries
- 8.1. Market Analysis, Insights and Forecast - by Type
- 9. Europe Viscosity Reducing Agents Market Analysis, Insights and Forecast, 2020-2032
- 9.1. Market Analysis, Insights and Forecast - by Type
- 9.1.1. Drag Reducing Agents
- 9.1.2. Surfactants & Additives
- 9.1.3. Dispersing Agents
- 9.1.4. Others
- 9.2. Market Analysis, Insights and Forecast - by End-user Industry
- 9.2.1. Oil & Gas
- 9.2.2. Paints & Coatings
- 9.2.3. Plastics
- 9.2.4. Other Manufacturing Industries
- 9.1. Market Analysis, Insights and Forecast - by Type
- 10. South America Viscosity Reducing Agents Market Analysis, Insights and Forecast, 2020-2032
- 10.1. Market Analysis, Insights and Forecast - by Type
- 10.1.1. Drag Reducing Agents
- 10.1.2. Surfactants & Additives
- 10.1.3. Dispersing Agents
- 10.1.4. Others
- 10.2. Market Analysis, Insights and Forecast - by End-user Industry
- 10.2.1. Oil & Gas
- 10.2.2. Paints & Coatings
- 10.2.3. Plastics
- 10.2.4. Other Manufacturing Industries
- 10.1. Market Analysis, Insights and Forecast - by Type
- 11. Middle East and Africa Viscosity Reducing Agents Market Analysis, Insights and Forecast, 2020-2032
- 11.1. Market Analysis, Insights and Forecast - by Type
- 11.1.1. Drag Reducing Agents
- 11.1.2. Surfactants & Additives
- 11.1.3. Dispersing Agents
- 11.1.4. Others
- 11.2. Market Analysis, Insights and Forecast - by End-user Industry
- 11.2.1. Oil & Gas
- 11.2.2. Paints & Coatings
- 11.2.3. Plastics
- 11.2.4. Other Manufacturing Industries
- 11.1. Market Analysis, Insights and Forecast - by Type
- 12. Competitive Analysis
- 12.1. Company Profiles
- 12.1.1 LiquidPower Specialty Products Inc
- 12.1.1.1. Company Overview
- 12.1.1.2. Products
- 12.1.1.3. Company Financials
- 12.1.1.4. SWOT Analysis
- 12.1.2 Ecolab
- 12.1.2.1. Company Overview
- 12.1.2.2. Products
- 12.1.2.3. Company Financials
- 12.1.2.4. SWOT Analysis
- 12.1.3 BYK-CHEMIE GMBH
- 12.1.3.1. Company Overview
- 12.1.3.2. Products
- 12.1.3.3. Company Financials
- 12.1.3.4. SWOT Analysis
- 12.1.4 ARKEMA Group
- 12.1.4.1. Company Overview
- 12.1.4.2. Products
- 12.1.4.3. Company Financials
- 12.1.4.4. SWOT Analysis
- 12.1.5 BASF SE
- 12.1.5.1. Company Overview
- 12.1.5.2. Products
- 12.1.5.3. Company Financials
- 12.1.5.4. SWOT Analysis
- 12.1.6 Alberta Treating Chemicals LTD
- 12.1.6.1. Company Overview
- 12.1.6.2. Products
- 12.1.6.3. Company Financials
- 12.1.6.4. SWOT Analysis
- 12.1.7 Qflo
- 12.1.7.1. Company Overview
- 12.1.7.2. Products
- 12.1.7.3. Company Financials
- 12.1.7.4. SWOT Analysis
- 12.1.8 The Lubrizol Corporation
- 12.1.8.1. Company Overview
- 12.1.8.2. Products
- 12.1.8.3. Company Financials
- 12.1.8.4. SWOT Analysis
- 12.1.9 Oil Flux
- 12.1.9.1. Company Overview
- 12.1.9.2. Products
- 12.1.9.3. Company Financials
- 12.1.9.4. SWOT Analysis
- 12.1.10 Baker Hughes Company
- 12.1.10.1. Company Overview
- 12.1.10.2. Products
- 12.1.10.3. Company Financials
- 12.1.10.4. SWOT Analysis
- 12.1.11 NuGenTecx
- 12.1.11.1. Company Overview
- 12.1.11.2. Products
- 12.1.11.3. Company Financials
- 12.1.11.4. SWOT Analysis
- 12.1.12 CHINAFLOC
- 12.1.12.1. Company Overview
- 12.1.12.2. Products
- 12.1.12.3. Company Financials
- 12.1.12.4. SWOT Analysis
- 12.1.13 Innospec
- 12.1.13.1. Company Overview
- 12.1.13.2. Products
- 12.1.13.3. Company Financials
- 12.1.13.4. SWOT Analysis
- 12.1.1 LiquidPower Specialty Products Inc
- 12.2. Market Entropy
- 12.2.1 Company's Key Areas Served
- 12.2.2 Recent Developments
- 12.3. Company Market Share Analysis 2025
- 12.3.1 Top 5 Companies Market Share Analysis
- 12.3.2 Top 3 Companies Market Share Analysis
- 12.4. List of Potential Customers
- 13. Research Methodology
List of Figures
- Figure 1: Global Viscosity Reducing Agents Market Revenue Breakdown (Million, %) by Region 2025 & 2033
- Figure 2: Global Viscosity Reducing Agents Market Volume Breakdown (K Tons, %) by Region 2025 & 2033
- Figure 3: Asia Pacific Viscosity Reducing Agents Market Revenue (Million), by Type 2025 & 2033
- Figure 4: Asia Pacific Viscosity Reducing Agents Market Volume (K Tons), by Type 2025 & 2033
- Figure 5: Asia Pacific Viscosity Reducing Agents Market Revenue Share (%), by Type 2025 & 2033
- Figure 6: Asia Pacific Viscosity Reducing Agents Market Volume Share (%), by Type 2025 & 2033
- Figure 7: Asia Pacific Viscosity Reducing Agents Market Revenue (Million), by End-user Industry 2025 & 2033
- Figure 8: Asia Pacific Viscosity Reducing Agents Market Volume (K Tons), by End-user Industry 2025 & 2033
- Figure 9: Asia Pacific Viscosity Reducing Agents Market Revenue Share (%), by End-user Industry 2025 & 2033
- Figure 10: Asia Pacific Viscosity Reducing Agents Market Volume Share (%), by End-user Industry 2025 & 2033
- Figure 11: Asia Pacific Viscosity Reducing Agents Market Revenue (Million), by Country 2025 & 2033
- Figure 12: Asia Pacific Viscosity Reducing Agents Market Volume (K Tons), by Country 2025 & 2033
- Figure 13: Asia Pacific Viscosity Reducing Agents Market Revenue Share (%), by Country 2025 & 2033
- Figure 14: Asia Pacific Viscosity Reducing Agents Market Volume Share (%), by Country 2025 & 2033
- Figure 15: North America Viscosity Reducing Agents Market Revenue (Million), by Type 2025 & 2033
- Figure 16: North America Viscosity Reducing Agents Market Volume (K Tons), by Type 2025 & 2033
- Figure 17: North America Viscosity Reducing Agents Market Revenue Share (%), by Type 2025 & 2033
- Figure 18: North America Viscosity Reducing Agents Market Volume Share (%), by Type 2025 & 2033
- Figure 19: North America Viscosity Reducing Agents Market Revenue (Million), by End-user Industry 2025 & 2033
- Figure 20: North America Viscosity Reducing Agents Market Volume (K Tons), by End-user Industry 2025 & 2033
- Figure 21: North America Viscosity Reducing Agents Market Revenue Share (%), by End-user Industry 2025 & 2033
- Figure 22: North America Viscosity Reducing Agents Market Volume Share (%), by End-user Industry 2025 & 2033
- Figure 23: North America Viscosity Reducing Agents Market Revenue (Million), by Country 2025 & 2033
- Figure 24: North America Viscosity Reducing Agents Market Volume (K Tons), by Country 2025 & 2033
- Figure 25: North America Viscosity Reducing Agents Market Revenue Share (%), by Country 2025 & 2033
- Figure 26: North America Viscosity Reducing Agents Market Volume Share (%), by Country 2025 & 2033
- Figure 27: Europe Viscosity Reducing Agents Market Revenue (Million), by Type 2025 & 2033
- Figure 28: Europe Viscosity Reducing Agents Market Volume (K Tons), by Type 2025 & 2033
- Figure 29: Europe Viscosity Reducing Agents Market Revenue Share (%), by Type 2025 & 2033
- Figure 30: Europe Viscosity Reducing Agents Market Volume Share (%), by Type 2025 & 2033
- Figure 31: Europe Viscosity Reducing Agents Market Revenue (Million), by End-user Industry 2025 & 2033
- Figure 32: Europe Viscosity Reducing Agents Market Volume (K Tons), by End-user Industry 2025 & 2033
- Figure 33: Europe Viscosity Reducing Agents Market Revenue Share (%), by End-user Industry 2025 & 2033
- Figure 34: Europe Viscosity Reducing Agents Market Volume Share (%), by End-user Industry 2025 & 2033
- Figure 35: Europe Viscosity Reducing Agents Market Revenue (Million), by Country 2025 & 2033
- Figure 36: Europe Viscosity Reducing Agents Market Volume (K Tons), by Country 2025 & 2033
- Figure 37: Europe Viscosity Reducing Agents Market Revenue Share (%), by Country 2025 & 2033
- Figure 38: Europe Viscosity Reducing Agents Market Volume Share (%), by Country 2025 & 2033
- Figure 39: South America Viscosity Reducing Agents Market Revenue (Million), by Type 2025 & 2033
- Figure 40: South America Viscosity Reducing Agents Market Volume (K Tons), by Type 2025 & 2033
- Figure 41: South America Viscosity Reducing Agents Market Revenue Share (%), by Type 2025 & 2033
- Figure 42: South America Viscosity Reducing Agents Market Volume Share (%), by Type 2025 & 2033
- Figure 43: South America Viscosity Reducing Agents Market Revenue (Million), by End-user Industry 2025 & 2033
- Figure 44: South America Viscosity Reducing Agents Market Volume (K Tons), by End-user Industry 2025 & 2033
- Figure 45: South America Viscosity Reducing Agents Market Revenue Share (%), by End-user Industry 2025 & 2033
- Figure 46: South America Viscosity Reducing Agents Market Volume Share (%), by End-user Industry 2025 & 2033
- Figure 47: South America Viscosity Reducing Agents Market Revenue (Million), by Country 2025 & 2033
- Figure 48: South America Viscosity Reducing Agents Market Volume (K Tons), by Country 2025 & 2033
- Figure 49: South America Viscosity Reducing Agents Market Revenue Share (%), by Country 2025 & 2033
- Figure 50: South America Viscosity Reducing Agents Market Volume Share (%), by Country 2025 & 2033
- Figure 51: Middle East and Africa Viscosity Reducing Agents Market Revenue (Million), by Type 2025 & 2033
- Figure 52: Middle East and Africa Viscosity Reducing Agents Market Volume (K Tons), by Type 2025 & 2033
- Figure 53: Middle East and Africa Viscosity Reducing Agents Market Revenue Share (%), by Type 2025 & 2033
- Figure 54: Middle East and Africa Viscosity Reducing Agents Market Volume Share (%), by Type 2025 & 2033
- Figure 55: Middle East and Africa Viscosity Reducing Agents Market Revenue (Million), by End-user Industry 2025 & 2033
- Figure 56: Middle East and Africa Viscosity Reducing Agents Market Volume (K Tons), by End-user Industry 2025 & 2033
- Figure 57: Middle East and Africa Viscosity Reducing Agents Market Revenue Share (%), by End-user Industry 2025 & 2033
- Figure 58: Middle East and Africa Viscosity Reducing Agents Market Volume Share (%), by End-user Industry 2025 & 2033
- Figure 59: Middle East and Africa Viscosity Reducing Agents Market Revenue (Million), by Country 2025 & 2033
- Figure 60: Middle East and Africa Viscosity Reducing Agents Market Volume (K Tons), by Country 2025 & 2033
- Figure 61: Middle East and Africa Viscosity Reducing Agents Market Revenue Share (%), by Country 2025 & 2033
- Figure 62: Middle East and Africa Viscosity Reducing Agents Market Volume Share (%), by Country 2025 & 2033
List of Tables
- Table 1: Global Viscosity Reducing Agents Market Revenue Million Forecast, by Type 2020 & 2033
- Table 2: Global Viscosity Reducing Agents Market Volume K Tons Forecast, by Type 2020 & 2033
- Table 3: Global Viscosity Reducing Agents Market Revenue Million Forecast, by End-user Industry 2020 & 2033
- Table 4: Global Viscosity Reducing Agents Market Volume K Tons Forecast, by End-user Industry 2020 & 2033
- Table 5: Global Viscosity Reducing Agents Market Revenue Million Forecast, by Region 2020 & 2033
- Table 6: Global Viscosity Reducing Agents Market Volume K Tons Forecast, by Region 2020 & 2033
- Table 7: Global Viscosity Reducing Agents Market Revenue Million Forecast, by Type 2020 & 2033
- Table 8: Global Viscosity Reducing Agents Market Volume K Tons Forecast, by Type 2020 & 2033
- Table 9: Global Viscosity Reducing Agents Market Revenue Million Forecast, by End-user Industry 2020 & 2033
- Table 10: Global Viscosity Reducing Agents Market Volume K Tons Forecast, by End-user Industry 2020 & 2033
- Table 11: Global Viscosity Reducing Agents Market Revenue Million Forecast, by Country 2020 & 2033
- Table 12: Global Viscosity Reducing Agents Market Volume K Tons Forecast, by Country 2020 & 2033
- Table 13: China Viscosity Reducing Agents Market Revenue (Million) Forecast, by Application 2020 & 2033
- Table 14: China Viscosity Reducing Agents Market Volume (K Tons) Forecast, by Application 2020 & 2033
- Table 15: India Viscosity Reducing Agents Market Revenue (Million) Forecast, by Application 2020 & 2033
- Table 16: India Viscosity Reducing Agents Market Volume (K Tons) Forecast, by Application 2020 & 2033
- Table 17: Japan Viscosity Reducing Agents Market Revenue (Million) Forecast, by Application 2020 & 2033
- Table 18: Japan Viscosity Reducing Agents Market Volume (K Tons) Forecast, by Application 2020 & 2033
- Table 19: South Korea Viscosity Reducing Agents Market Revenue (Million) Forecast, by Application 2020 & 2033
- Table 20: South Korea Viscosity Reducing Agents Market Volume (K Tons) Forecast, by Application 2020 & 2033
- Table 21: Rest of Asia Pacific Viscosity Reducing Agents Market Revenue (Million) Forecast, by Application 2020 & 2033
- Table 22: Rest of Asia Pacific Viscosity Reducing Agents Market Volume (K Tons) Forecast, by Application 2020 & 2033
- Table 23: Global Viscosity Reducing Agents Market Revenue Million Forecast, by Type 2020 & 2033
- Table 24: Global Viscosity Reducing Agents Market Volume K Tons Forecast, by Type 2020 & 2033
- Table 25: Global Viscosity Reducing Agents Market Revenue Million Forecast, by End-user Industry 2020 & 2033
- Table 26: Global Viscosity Reducing Agents Market Volume K Tons Forecast, by End-user Industry 2020 & 2033
- Table 27: Global Viscosity Reducing Agents Market Revenue Million Forecast, by Country 2020 & 2033
- Table 28: Global Viscosity Reducing Agents Market Volume K Tons Forecast, by Country 2020 & 2033
- Table 29: United States Viscosity Reducing Agents Market Revenue (Million) Forecast, by Application 2020 & 2033
- Table 30: United States Viscosity Reducing Agents Market Volume (K Tons) Forecast, by Application 2020 & 2033
- Table 31: Canada Viscosity Reducing Agents Market Revenue (Million) Forecast, by Application 2020 & 2033
- Table 32: Canada Viscosity Reducing Agents Market Volume (K Tons) Forecast, by Application 2020 & 2033
- Table 33: Mexico Viscosity Reducing Agents Market Revenue (Million) Forecast, by Application 2020 & 2033
- Table 34: Mexico Viscosity Reducing Agents Market Volume (K Tons) Forecast, by Application 2020 & 2033
- Table 35: Global Viscosity Reducing Agents Market Revenue Million Forecast, by Type 2020 & 2033
- Table 36: Global Viscosity Reducing Agents Market Volume K Tons Forecast, by Type 2020 & 2033
- Table 37: Global Viscosity Reducing Agents Market Revenue Million Forecast, by End-user Industry 2020 & 2033
- Table 38: Global Viscosity Reducing Agents Market Volume K Tons Forecast, by End-user Industry 2020 & 2033
- Table 39: Global Viscosity Reducing Agents Market Revenue Million Forecast, by Country 2020 & 2033
- Table 40: Global Viscosity Reducing Agents Market Volume K Tons Forecast, by Country 2020 & 2033
- Table 41: Germany Viscosity Reducing Agents Market Revenue (Million) Forecast, by Application 2020 & 2033
- Table 42: Germany Viscosity Reducing Agents Market Volume (K Tons) Forecast, by Application 2020 & 2033
- Table 43: United Kingdom Viscosity Reducing Agents Market Revenue (Million) Forecast, by Application 2020 & 2033
- Table 44: United Kingdom Viscosity Reducing Agents Market Volume (K Tons) Forecast, by Application 2020 & 2033
- Table 45: Italy Viscosity Reducing Agents Market Revenue (Million) Forecast, by Application 2020 & 2033
- Table 46: Italy Viscosity Reducing Agents Market Volume (K Tons) Forecast, by Application 2020 & 2033
- Table 47: France Viscosity Reducing Agents Market Revenue (Million) Forecast, by Application 2020 & 2033
- Table 48: France Viscosity Reducing Agents Market Volume (K Tons) Forecast, by Application 2020 & 2033
- Table 49: Rest of Europe Viscosity Reducing Agents Market Revenue (Million) Forecast, by Application 2020 & 2033
- Table 50: Rest of Europe Viscosity Reducing Agents Market Volume (K Tons) Forecast, by Application 2020 & 2033
- Table 51: Global Viscosity Reducing Agents Market Revenue Million Forecast, by Type 2020 & 2033
- Table 52: Global Viscosity Reducing Agents Market Volume K Tons Forecast, by Type 2020 & 2033
- Table 53: Global Viscosity Reducing Agents Market Revenue Million Forecast, by End-user Industry 2020 & 2033
- Table 54: Global Viscosity Reducing Agents Market Volume K Tons Forecast, by End-user Industry 2020 & 2033
- Table 55: Global Viscosity Reducing Agents Market Revenue Million Forecast, by Country 2020 & 2033
- Table 56: Global Viscosity Reducing Agents Market Volume K Tons Forecast, by Country 2020 & 2033
- Table 57: Brazil Viscosity Reducing Agents Market Revenue (Million) Forecast, by Application 2020 & 2033
- Table 58: Brazil Viscosity Reducing Agents Market Volume (K Tons) Forecast, by Application 2020 & 2033
- Table 59: Argentina Viscosity Reducing Agents Market Revenue (Million) Forecast, by Application 2020 & 2033
- Table 60: Argentina Viscosity Reducing Agents Market Volume (K Tons) Forecast, by Application 2020 & 2033
- Table 61: Rest of South America Viscosity Reducing Agents Market Revenue (Million) Forecast, by Application 2020 & 2033
- Table 62: Rest of South America Viscosity Reducing Agents Market Volume (K Tons) Forecast, by Application 2020 & 2033
- Table 63: Global Viscosity Reducing Agents Market Revenue Million Forecast, by Type 2020 & 2033
- Table 64: Global Viscosity Reducing Agents Market Volume K Tons Forecast, by Type 2020 & 2033
- Table 65: Global Viscosity Reducing Agents Market Revenue Million Forecast, by End-user Industry 2020 & 2033
- Table 66: Global Viscosity Reducing Agents Market Volume K Tons Forecast, by End-user Industry 2020 & 2033
- Table 67: Global Viscosity Reducing Agents Market Revenue Million Forecast, by Country 2020 & 2033
- Table 68: Global Viscosity Reducing Agents Market Volume K Tons Forecast, by Country 2020 & 2033
- Table 69: Saudi Arabia Viscosity Reducing Agents Market Revenue (Million) Forecast, by Application 2020 & 2033
- Table 70: Saudi Arabia Viscosity Reducing Agents Market Volume (K Tons) Forecast, by Application 2020 & 2033
- Table 71: South Africa Viscosity Reducing Agents Market Revenue (Million) Forecast, by Application 2020 & 2033
- Table 72: South Africa Viscosity Reducing Agents Market Volume (K Tons) Forecast, by Application 2020 & 2033
- Table 73: Rest of Middle East and Africa Viscosity Reducing Agents Market Revenue (Million) Forecast, by Application 2020 & 2033
- Table 74: Rest of Middle East and Africa Viscosity Reducing Agents Market Volume (K Tons) Forecast, by Application 2020 & 2033
Frequently Asked Questions
1. What is the projected Compound Annual Growth Rate (CAGR) of the Viscosity Reducing Agents Market?
The projected CAGR is approximately 5.68%.
2. Which companies are prominent players in the Viscosity Reducing Agents Market?
Key companies in the market include LiquidPower Specialty Products Inc, Ecolab, BYK-CHEMIE GMBH, ARKEMA Group, BASF SE, Alberta Treating Chemicals LTD, Qflo, The Lubrizol Corporation, Oil Flux, Baker Hughes Company, NuGenTecx, CHINAFLOC, Innospec.
3. What are the main segments of the Viscosity Reducing Agents Market?
The market segments include Type, End-user Industry.
4. Can you provide details about the market size?
The market size is estimated to be USD 168.13 Million as of 2022.
5. What are some drivers contributing to market growth?
; Growing Demand From the Oil & Gas Industry; Other Drivers.
6. What are the notable trends driving market growth?
Growing Demand from the Oil & Gas Industry.
7. Are there any restraints impacting market growth?
; Stringent Environmental Regulations; Unfavourable Conditions Arising Due to the COVID-19 Outbreak.
8. Can you provide examples of recent developments in the market?
N/A
9. What pricing options are available for accessing the report?
Pricing options include single-user, multi-user, and enterprise licenses priced at USD 3,950, USD 4,950, and USD 6,950 respectively.
10. Is the market size provided in terms of value or volume?
The market size is provided in terms of value, measured in Million and volume, measured in K Tons.
11. Are there any specific market keywords associated with the report?
Yes, the market keyword associated with the report is "Viscosity Reducing Agents Market," which aids in identifying and referencing the specific market segment covered.
12. How do I determine which pricing option suits my needs best?
The pricing options vary based on user requirements and access needs. Individual users may opt for single-user licenses, while businesses requiring broader access may choose multi-user or enterprise licenses for cost-effective access to the report.
13. Are there any additional resources or data provided in the Viscosity Reducing Agents Market report?
While the report offers comprehensive insights, it's advisable to review the specific contents or supplementary materials provided to ascertain if additional resources or data are available.
14. How can I stay updated on further developments or reports in the Viscosity Reducing Agents Market?
To stay informed about further developments, trends, and reports in the Viscosity Reducing Agents Market, consider subscribing to industry newsletters, following relevant companies and organizations, or regularly checking reputable industry news sources and publications.
Methodology
Step 1 - Identification of Relevant Samples Size from Population Database


Step 2 - Approaches for Defining Global Market Size (Value, Volume* & Price*)

Note*: In applicable scenarios
Step 3 - Data Sources
Primary Research
- Web Analytics
- Survey Reports
- Research Institute
- Latest Research Reports
- Opinion Leaders
Secondary Research
- Annual Reports
- White Paper
- Latest Press Release
- Industry Association
- Paid Database
- Investor Presentations

Step 4 - Data Triangulation
Involves using different sources of information in order to increase the validity of a study
These sources are likely to be stakeholders in a program - participants, other researchers, program staff, other community members, and so on.
Then we put all data in single framework & apply various statistical tools to find out the dynamic on the market.
During the analysis stage, feedback from the stakeholder groups would be compared to determine areas of agreement as well as areas of divergence