

Key Insights
The global waxing market is poised for robust expansion, projected to reach $25.5 billion by 2033, with a compound annual growth rate (CAGR) of 9.1% from a base year of 2025. This growth is underpinned by escalating demand for specialized waxes across diverse sectors, including cosmetics, candle manufacturing, food processing, and industrial applications. The increasing preference for natural and sustainable wax alternatives, alongside advancements in formulation and processing technologies, are key drivers. However, market expansion may be tempered by volatile raw material costs and environmental considerations associated with certain wax production methods. The market is segmented by wax type (paraffin, microcrystalline, beeswax, etc.), application, and geographical region. Leading players are focusing on innovation and market consolidation, while niche players are emphasizing specialized applications and sustainable practices.
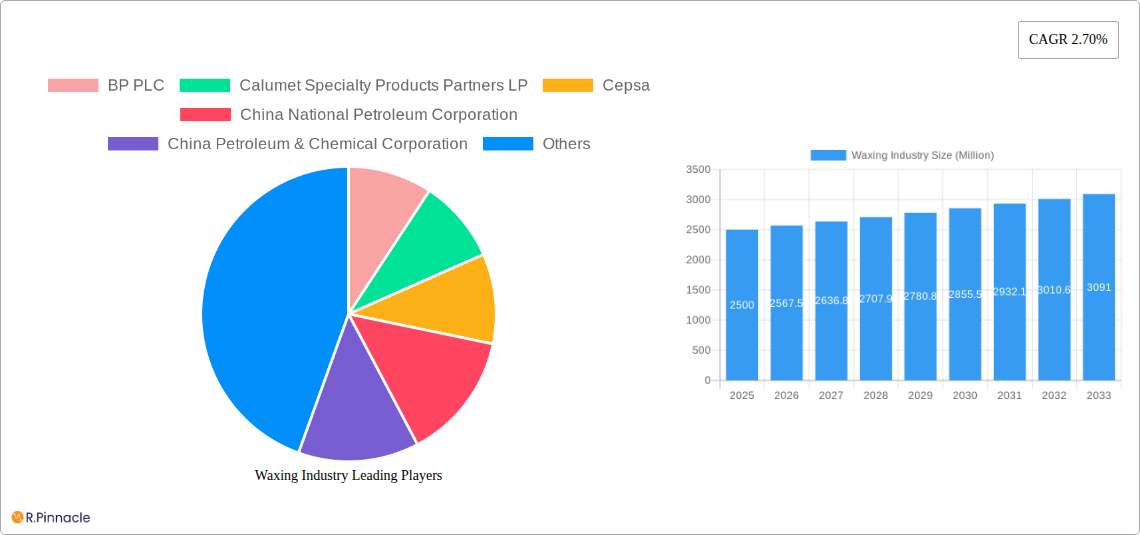
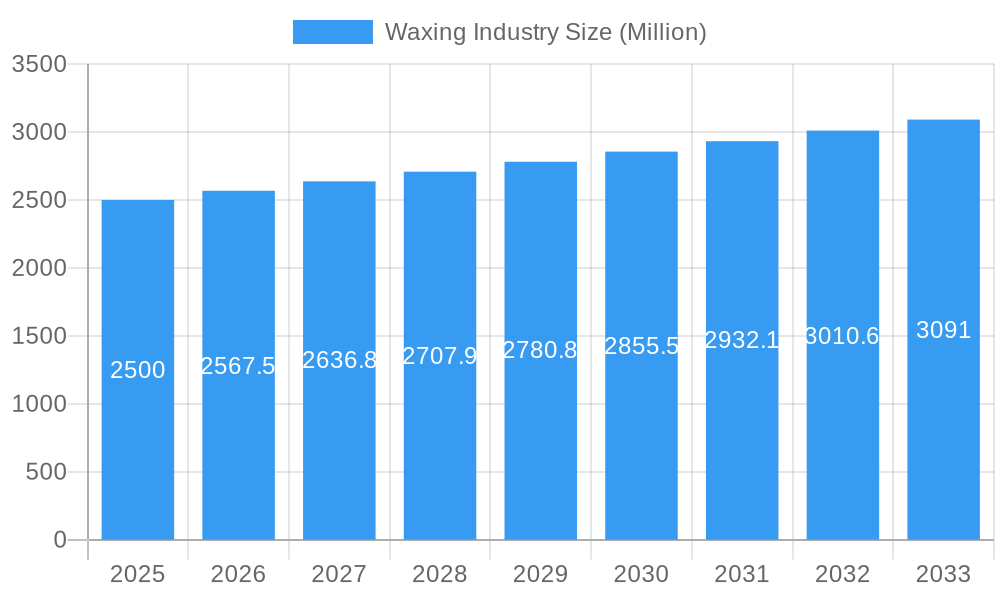
Waxing Industry Market Size (In Billion)
The competitive landscape features a mix of large multinational corporations and agile, specialized enterprises. Global giants capitalize on scale and extensive resources for broad market penetration and diverse product offerings, whereas smaller firms concentrate on specific market segments and eco-friendly production. Emerging economies are expected to drive significant growth due to rapid industrialization and rising consumer expenditure, contrasting with more stable expansion in developed markets. Continuous adaptation to evolving consumer preferences, stringent environmental regulations, and technological breakthroughs necessitates a strong focus on innovation and sustainability for sustained competitive advantage. Detailed segment and regional analysis will offer further insights into market dynamics and future opportunities.
Waxing Industry Company Market Share
Global Waxing Industry Market Analysis: Growth, Trends, and Forecast (2019-2033)
This comprehensive report delivers an in-depth analysis of the global waxing industry, forecasting a market value exceeding $25.5 billion by 2033. It examines market structure, innovation trends, dynamics, regional leadership, product advancements, and future projections, providing critical insights for industry stakeholders, investors, and strategic planners. The analysis incorporates data from the historical period (2019-2024), base year (2025), and projections through 2033.
Waxing Industry Market Structure & Innovation Trends
This section analyzes the competitive landscape, highlighting market concentration, innovation drivers, regulatory frameworks, and M&A activities within the $XX Million waxing industry. We delve into the market share held by key players such as BP PLC, Exxon Mobil Corporation, Sasol, and others, examining their strategic moves and market influence. The report also analyzes the impact of M&A activities, such as the March 2022 acquisition of Sasol Wax GmbH by AWAX s.p.a., which holds a xx% market share post-acquisition, impacting the overall market structure and competitive dynamics, resulting in a xx% change in market concentration. Further analysis includes examination of regulatory compliance, substitution products, and the impact of end-user demographics on market demand. The total value of M&A deals in the period 2019-2024 is estimated at $XX Million.
- Market Concentration: xx% controlled by top 5 players.
- Innovation Drivers: Growing demand for specialized waxes in various industries.
- Regulatory Frameworks: Impact of environmental regulations on production processes.
- Product Substitutes: Analysis of alternative materials and their market penetration.
- M&A Activities: Detailed analysis of key mergers and acquisitions, including deal values and their implications.
Waxing Industry Market Dynamics & Trends
This section explores the key drivers and trends shaping the waxing industry’s growth trajectory. We analyze the Compound Annual Growth Rate (CAGR) and market penetration rate for different wax types and applications, providing a detailed understanding of market dynamics. Factors impacting growth include technological advancements, changing consumer preferences, and shifts in competitive dynamics. The report projects a CAGR of xx% during the forecast period (2025-2033), driven by increasing demand from key sectors such as packaging, cosmetics, and automotive industries. Market penetration in developing economies is expected to increase by xx% in the next decade.
Dominant Regions & Segments in Waxing Industry
This section identifies the leading regions and segments within the global waxing market. Detailed analysis pinpoints the key drivers of dominance, encompassing economic policies, infrastructure development, and consumer behavior. The report highlights the dominance of [Region Name] due to [Reasons - e.g., strong industrial base, favorable government policies, high consumption rates].
- Key Drivers in [Dominant Region]:
- Strong industrial base
- Favorable government policies
- High consumption rates
- Robust infrastructure
Waxing Industry Product Innovations
This section summarizes recent product developments and applications, emphasizing technological trends and their impact on market competitiveness. Innovation in wax formulations, such as the development of bio-based waxes and specialized high-performance waxes, is driving market growth and creating new opportunities for industry players. These innovations improve product performance, broaden application areas, and enhance the sustainability profile of the products.
Report Scope & Segmentation Analysis
The report provides a detailed segmentation analysis, covering various product types (e.g., paraffin wax, microcrystalline wax, polyethylene wax), applications (e.g., candles, coatings, adhesives), and geographical regions. Each segment's market size, growth projections, and competitive dynamics are analyzed thoroughly. This provides a detailed understanding of the opportunities within different sub-sectors of the waxing industry.
Key Drivers of Waxing Industry Growth
Several factors contribute to the growth of the waxing industry. Technological advancements in wax production and formulation, the rising demand for specialized waxes in various industries (e.g., cosmetics, packaging, pharmaceuticals), and supportive government policies driving the adoption of sustainable waxes are major contributors. Economic growth in emerging markets also fuels market expansion.
Challenges in the Waxing Industry Sector
The waxing industry faces challenges including fluctuations in raw material prices, stringent environmental regulations impacting production processes, and increasing competition from substitute materials. These factors influence profitability and necessitate strategic adaptation by industry players. The estimated impact of these challenges on industry profit margins is around xx%.
Emerging Opportunities in Waxing Industry
The waxing industry presents several emerging opportunities, including the growing demand for bio-based and sustainable waxes, the expansion into new applications, and the development of high-performance waxes tailored to specific needs. These trends open avenues for innovation and market expansion.
Leading Players in the Waxing Industry Market
- BP PLC
- Calumet Specialty Products Partners LP
- Cepsa
- China National Petroleum Corporation
- China Petroleum & Chemical Corporation
- Eni SpA
- Exxon Mobil Corporation
- H&R Group
- Ilumina Wax d o o
- Kemipex
- Nippon Siero Co Ltd
- Petrobras
- Petro Canada Lubricants Inc
- Sasol
- The International Group Inc
- CALWAX
*List Not Exhaustive
Key Developments in Waxing Industry
- March 2022: Sasol sold its German subsidiary Sasol Wax GmbH to AWAX s.p.a., impacting market share and competitive dynamics.
Future Outlook for Waxing Industry Market
The future of the waxing industry appears promising, driven by continued innovation, expanding applications, and the increasing demand for specialized and sustainable waxes. Strategic partnerships, investments in research and development, and a focus on sustainability will be crucial for success in this dynamic market. The market is expected to grow at a steady pace, spurred by various growth accelerators identified in the report.
Waxing Industry Segmentation
-
1. Type
- 1.1. Petroleum and Mineral Wax
- 1.2. Synthetic Wax
- 1.3. Natural Wax
-
2. Application
- 2.1. Cosmetics
- 2.2. Packaging
- 2.3. Candle Making
- 2.4. Adhesives
- 2.5. Rubber
- 2.6. Other Applications
Waxing Industry Segmentation By Geography
-
1. Asia Pacific
- 1.1. China
- 1.2. India
- 1.3. Japan
- 1.4. South Korea
- 1.5. ASEAN Countries
- 1.6. Rest of Asia Pacific
-
2. North America
- 2.1. United States
- 2.2. Canada
- 2.3. Mexico
-
3. Europe
- 3.1. Germany
- 3.2. United Kingdom
- 3.3. France
- 3.4. Italy
- 3.5. Spain
- 3.6. Rest of Europe
-
4. South America
- 4.1. Argentina
- 4.2. Brazil
- 4.3. Rest of South America
-
5. Middle East and Africa
- 5.1. Saudi Arabia
- 5.2. South Africa
- 5.3. Rest of Middle East and Africa
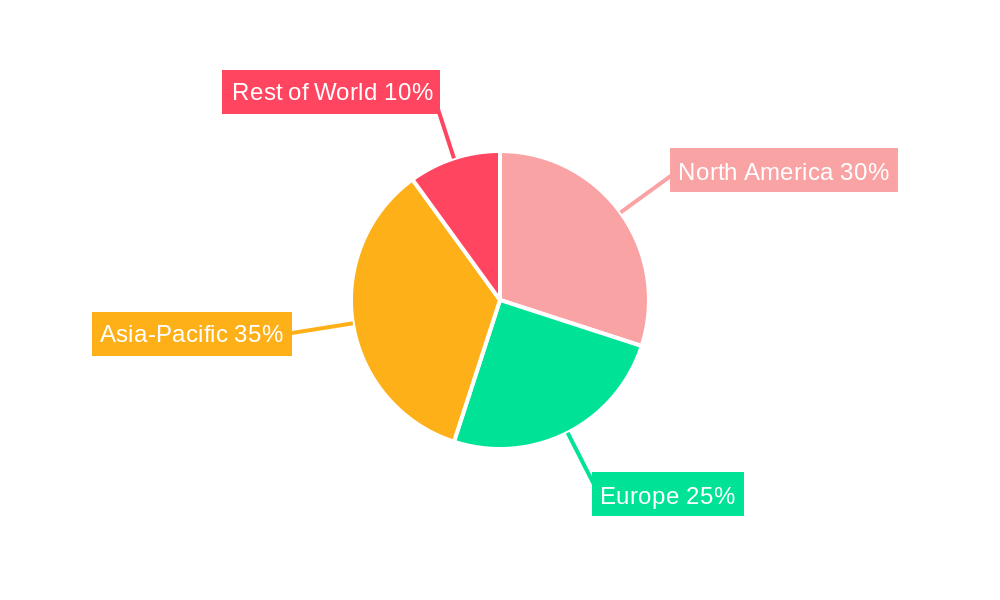
Waxing Industry Regional Market Share
Geographic Coverage of Waxing Industry
Waxing Industry REPORT HIGHLIGHTS
| Aspects | Details |
|---|---|
| Study Period | 2020-2034 |
| Base Year | 2025 |
| Estimated Year | 2026 |
| Forecast Period | 2026-2034 |
| Historical Period | 2020-2025 |
| Growth Rate | CAGR of 9.1% from 2020-2034 |
| Segmentation |
|
Table of Contents
- 1. Introduction
- 1.1. Research Scope
- 1.2. Market Segmentation
- 1.3. Research Objective
- 1.4. Definitions and Assumptions
- 2. Executive Summary
- 2.1. Market Snapshot
- 3. Market Dynamics
- 3.1. Market Drivers
- 3.2. Market Restrains
- 3.3. Market Trends
- 3.4. Market Opportunities
- 4. Market Factor Analysis
- 4.1. Porters Five Forces
- 4.1.1. Bargaining Power of Suppliers
- 4.1.2. Bargaining Power of Buyers
- 4.1.3. Threat of New Entrants
- 4.1.4. Threat of Substitutes
- 4.1.5. Competitive Rivalry
- 4.2. PESTEL analysis
- 4.3. BCG Analysis
- 4.3.1. Stars (High Growth, High Market Share)
- 4.3.2. Cash Cows (Low Growth, High Market Share)
- 4.3.3. Question Mark (High Growth, Low Market Share)
- 4.3.4. Dogs (Low Growth, Low Market Share)
- 4.4. Ansoff Matrix Analysis
- 4.5. Supply Chain Analysis
- 4.6. Regulatory Landscape
- 4.7. Current Market Potential and Opportunity Assessment (TAM–SAM–SOM Framework)
- 4.8. PRI Analyst Note
- 4.1. Porters Five Forces
- 5. Market Analysis, Insights and Forecast 2021-2033
- 5.1. Market Analysis, Insights and Forecast - by Type
- 5.1.1. Petroleum and Mineral Wax
- 5.1.2. Synthetic Wax
- 5.1.3. Natural Wax
- 5.2. Market Analysis, Insights and Forecast - by Application
- 5.2.1. Cosmetics
- 5.2.2. Packaging
- 5.2.3. Candle Making
- 5.2.4. Adhesives
- 5.2.5. Rubber
- 5.2.6. Other Applications
- 5.3. Market Analysis, Insights and Forecast - by Region
- 5.3.1. Asia Pacific
- 5.3.2. North America
- 5.3.3. Europe
- 5.3.4. South America
- 5.3.5. Middle East and Africa
- 5.1. Market Analysis, Insights and Forecast - by Type
- 6. Global Waxing Industry Analysis, Insights and Forecast, 2021-2033
- 6.1. Market Analysis, Insights and Forecast - by Type
- 6.1.1. Petroleum and Mineral Wax
- 6.1.2. Synthetic Wax
- 6.1.3. Natural Wax
- 6.2. Market Analysis, Insights and Forecast - by Application
- 6.2.1. Cosmetics
- 6.2.2. Packaging
- 6.2.3. Candle Making
- 6.2.4. Adhesives
- 6.2.5. Rubber
- 6.2.6. Other Applications
- 6.1. Market Analysis, Insights and Forecast - by Type
- 7. Asia Pacific Waxing Industry Analysis, Insights and Forecast, 2020-2032
- 7.1. Market Analysis, Insights and Forecast - by Type
- 7.1.1. Petroleum and Mineral Wax
- 7.1.2. Synthetic Wax
- 7.1.3. Natural Wax
- 7.2. Market Analysis, Insights and Forecast - by Application
- 7.2.1. Cosmetics
- 7.2.2. Packaging
- 7.2.3. Candle Making
- 7.2.4. Adhesives
- 7.2.5. Rubber
- 7.2.6. Other Applications
- 7.1. Market Analysis, Insights and Forecast - by Type
- 8. North America Waxing Industry Analysis, Insights and Forecast, 2020-2032
- 8.1. Market Analysis, Insights and Forecast - by Type
- 8.1.1. Petroleum and Mineral Wax
- 8.1.2. Synthetic Wax
- 8.1.3. Natural Wax
- 8.2. Market Analysis, Insights and Forecast - by Application
- 8.2.1. Cosmetics
- 8.2.2. Packaging
- 8.2.3. Candle Making
- 8.2.4. Adhesives
- 8.2.5. Rubber
- 8.2.6. Other Applications
- 8.1. Market Analysis, Insights and Forecast - by Type
- 9. Europe Waxing Industry Analysis, Insights and Forecast, 2020-2032
- 9.1. Market Analysis, Insights and Forecast - by Type
- 9.1.1. Petroleum and Mineral Wax
- 9.1.2. Synthetic Wax
- 9.1.3. Natural Wax
- 9.2. Market Analysis, Insights and Forecast - by Application
- 9.2.1. Cosmetics
- 9.2.2. Packaging
- 9.2.3. Candle Making
- 9.2.4. Adhesives
- 9.2.5. Rubber
- 9.2.6. Other Applications
- 9.1. Market Analysis, Insights and Forecast - by Type
- 10. South America Waxing Industry Analysis, Insights and Forecast, 2020-2032
- 10.1. Market Analysis, Insights and Forecast - by Type
- 10.1.1. Petroleum and Mineral Wax
- 10.1.2. Synthetic Wax
- 10.1.3. Natural Wax
- 10.2. Market Analysis, Insights and Forecast - by Application
- 10.2.1. Cosmetics
- 10.2.2. Packaging
- 10.2.3. Candle Making
- 10.2.4. Adhesives
- 10.2.5. Rubber
- 10.2.6. Other Applications
- 10.1. Market Analysis, Insights and Forecast - by Type
- 11. Middle East and Africa Waxing Industry Analysis, Insights and Forecast, 2020-2032
- 11.1. Market Analysis, Insights and Forecast - by Type
- 11.1.1. Petroleum and Mineral Wax
- 11.1.2. Synthetic Wax
- 11.1.3. Natural Wax
- 11.2. Market Analysis, Insights and Forecast - by Application
- 11.2.1. Cosmetics
- 11.2.2. Packaging
- 11.2.3. Candle Making
- 11.2.4. Adhesives
- 11.2.5. Rubber
- 11.2.6. Other Applications
- 11.1. Market Analysis, Insights and Forecast - by Type
- 12. Competitive Analysis
- 12.1. Company Profiles
- 12.1.1 BP PLC
- 12.1.1.1. Company Overview
- 12.1.1.2. Products
- 12.1.1.3. Company Financials
- 12.1.1.4. SWOT Analysis
- 12.1.2 Calumet Specialty Products Partners LP
- 12.1.2.1. Company Overview
- 12.1.2.2. Products
- 12.1.2.3. Company Financials
- 12.1.2.4. SWOT Analysis
- 12.1.3 Cepsa
- 12.1.3.1. Company Overview
- 12.1.3.2. Products
- 12.1.3.3. Company Financials
- 12.1.3.4. SWOT Analysis
- 12.1.4 China National Petroleum Corporation
- 12.1.4.1. Company Overview
- 12.1.4.2. Products
- 12.1.4.3. Company Financials
- 12.1.4.4. SWOT Analysis
- 12.1.5 China Petroleum & Chemical Corporation
- 12.1.5.1. Company Overview
- 12.1.5.2. Products
- 12.1.5.3. Company Financials
- 12.1.5.4. SWOT Analysis
- 12.1.6 Eni SpA
- 12.1.6.1. Company Overview
- 12.1.6.2. Products
- 12.1.6.3. Company Financials
- 12.1.6.4. SWOT Analysis
- 12.1.7 Exxon Mobil Corporation
- 12.1.7.1. Company Overview
- 12.1.7.2. Products
- 12.1.7.3. Company Financials
- 12.1.7.4. SWOT Analysis
- 12.1.8 H&R Group
- 12.1.8.1. Company Overview
- 12.1.8.2. Products
- 12.1.8.3. Company Financials
- 12.1.8.4. SWOT Analysis
- 12.1.9 Ilumina Wax d o o
- 12.1.9.1. Company Overview
- 12.1.9.2. Products
- 12.1.9.3. Company Financials
- 12.1.9.4. SWOT Analysis
- 12.1.10 Kemipex
- 12.1.10.1. Company Overview
- 12.1.10.2. Products
- 12.1.10.3. Company Financials
- 12.1.10.4. SWOT Analysis
- 12.1.11 Nippon Siero Co Ltd
- 12.1.11.1. Company Overview
- 12.1.11.2. Products
- 12.1.11.3. Company Financials
- 12.1.11.4. SWOT Analysis
- 12.1.12 Petrobras
- 12.1.12.1. Company Overview
- 12.1.12.2. Products
- 12.1.12.3. Company Financials
- 12.1.12.4. SWOT Analysis
- 12.1.13 Petro Canada Lubricants Inc
- 12.1.13.1. Company Overview
- 12.1.13.2. Products
- 12.1.13.3. Company Financials
- 12.1.13.4. SWOT Analysis
- 12.1.14 Sasol
- 12.1.14.1. Company Overview
- 12.1.14.2. Products
- 12.1.14.3. Company Financials
- 12.1.14.4. SWOT Analysis
- 12.1.15 The International Group Inc
- 12.1.15.1. Company Overview
- 12.1.15.2. Products
- 12.1.15.3. Company Financials
- 12.1.15.4. SWOT Analysis
- 12.1.16 CALWAX*List Not Exhaustive
- 12.1.16.1. Company Overview
- 12.1.16.2. Products
- 12.1.16.3. Company Financials
- 12.1.16.4. SWOT Analysis
- 12.1.1 BP PLC
- 12.2. Market Entropy
- 12.2.1 Company's Key Areas Served
- 12.2.2 Recent Developments
- 12.3. Company Market Share Analysis 2025
- 12.3.1 Top 5 Companies Market Share Analysis
- 12.3.2 Top 3 Companies Market Share Analysis
- 12.4. List of Potential Customers
- 13. Research Methodology
List of Figures
- Figure 1: Global Waxing Industry Revenue Breakdown (billion, %) by Region 2025 & 2033
- Figure 2: Asia Pacific Waxing Industry Revenue (billion), by Type 2025 & 2033
- Figure 3: Asia Pacific Waxing Industry Revenue Share (%), by Type 2025 & 2033
- Figure 4: Asia Pacific Waxing Industry Revenue (billion), by Application 2025 & 2033
- Figure 5: Asia Pacific Waxing Industry Revenue Share (%), by Application 2025 & 2033
- Figure 6: Asia Pacific Waxing Industry Revenue (billion), by Country 2025 & 2033
- Figure 7: Asia Pacific Waxing Industry Revenue Share (%), by Country 2025 & 2033
- Figure 8: North America Waxing Industry Revenue (billion), by Type 2025 & 2033
- Figure 9: North America Waxing Industry Revenue Share (%), by Type 2025 & 2033
- Figure 10: North America Waxing Industry Revenue (billion), by Application 2025 & 2033
- Figure 11: North America Waxing Industry Revenue Share (%), by Application 2025 & 2033
- Figure 12: North America Waxing Industry Revenue (billion), by Country 2025 & 2033
- Figure 13: North America Waxing Industry Revenue Share (%), by Country 2025 & 2033
- Figure 14: Europe Waxing Industry Revenue (billion), by Type 2025 & 2033
- Figure 15: Europe Waxing Industry Revenue Share (%), by Type 2025 & 2033
- Figure 16: Europe Waxing Industry Revenue (billion), by Application 2025 & 2033
- Figure 17: Europe Waxing Industry Revenue Share (%), by Application 2025 & 2033
- Figure 18: Europe Waxing Industry Revenue (billion), by Country 2025 & 2033
- Figure 19: Europe Waxing Industry Revenue Share (%), by Country 2025 & 2033
- Figure 20: South America Waxing Industry Revenue (billion), by Type 2025 & 2033
- Figure 21: South America Waxing Industry Revenue Share (%), by Type 2025 & 2033
- Figure 22: South America Waxing Industry Revenue (billion), by Application 2025 & 2033
- Figure 23: South America Waxing Industry Revenue Share (%), by Application 2025 & 2033
- Figure 24: South America Waxing Industry Revenue (billion), by Country 2025 & 2033
- Figure 25: South America Waxing Industry Revenue Share (%), by Country 2025 & 2033
- Figure 26: Middle East and Africa Waxing Industry Revenue (billion), by Type 2025 & 2033
- Figure 27: Middle East and Africa Waxing Industry Revenue Share (%), by Type 2025 & 2033
- Figure 28: Middle East and Africa Waxing Industry Revenue (billion), by Application 2025 & 2033
- Figure 29: Middle East and Africa Waxing Industry Revenue Share (%), by Application 2025 & 2033
- Figure 30: Middle East and Africa Waxing Industry Revenue (billion), by Country 2025 & 2033
- Figure 31: Middle East and Africa Waxing Industry Revenue Share (%), by Country 2025 & 2033
List of Tables
- Table 1: Global Waxing Industry Revenue billion Forecast, by Type 2020 & 2033
- Table 2: Global Waxing Industry Revenue billion Forecast, by Application 2020 & 2033
- Table 3: Global Waxing Industry Revenue billion Forecast, by Region 2020 & 2033
- Table 4: Global Waxing Industry Revenue billion Forecast, by Type 2020 & 2033
- Table 5: Global Waxing Industry Revenue billion Forecast, by Application 2020 & 2033
- Table 6: Global Waxing Industry Revenue billion Forecast, by Country 2020 & 2033
- Table 7: China Waxing Industry Revenue (billion) Forecast, by Application 2020 & 2033
- Table 8: India Waxing Industry Revenue (billion) Forecast, by Application 2020 & 2033
- Table 9: Japan Waxing Industry Revenue (billion) Forecast, by Application 2020 & 2033
- Table 10: South Korea Waxing Industry Revenue (billion) Forecast, by Application 2020 & 2033
- Table 11: ASEAN Countries Waxing Industry Revenue (billion) Forecast, by Application 2020 & 2033
- Table 12: Rest of Asia Pacific Waxing Industry Revenue (billion) Forecast, by Application 2020 & 2033
- Table 13: Global Waxing Industry Revenue billion Forecast, by Type 2020 & 2033
- Table 14: Global Waxing Industry Revenue billion Forecast, by Application 2020 & 2033
- Table 15: Global Waxing Industry Revenue billion Forecast, by Country 2020 & 2033
- Table 16: United States Waxing Industry Revenue (billion) Forecast, by Application 2020 & 2033
- Table 17: Canada Waxing Industry Revenue (billion) Forecast, by Application 2020 & 2033
- Table 18: Mexico Waxing Industry Revenue (billion) Forecast, by Application 2020 & 2033
- Table 19: Global Waxing Industry Revenue billion Forecast, by Type 2020 & 2033
- Table 20: Global Waxing Industry Revenue billion Forecast, by Application 2020 & 2033
- Table 21: Global Waxing Industry Revenue billion Forecast, by Country 2020 & 2033
- Table 22: Germany Waxing Industry Revenue (billion) Forecast, by Application 2020 & 2033
- Table 23: United Kingdom Waxing Industry Revenue (billion) Forecast, by Application 2020 & 2033
- Table 24: France Waxing Industry Revenue (billion) Forecast, by Application 2020 & 2033
- Table 25: Italy Waxing Industry Revenue (billion) Forecast, by Application 2020 & 2033
- Table 26: Spain Waxing Industry Revenue (billion) Forecast, by Application 2020 & 2033
- Table 27: Rest of Europe Waxing Industry Revenue (billion) Forecast, by Application 2020 & 2033
- Table 28: Global Waxing Industry Revenue billion Forecast, by Type 2020 & 2033
- Table 29: Global Waxing Industry Revenue billion Forecast, by Application 2020 & 2033
- Table 30: Global Waxing Industry Revenue billion Forecast, by Country 2020 & 2033
- Table 31: Argentina Waxing Industry Revenue (billion) Forecast, by Application 2020 & 2033
- Table 32: Brazil Waxing Industry Revenue (billion) Forecast, by Application 2020 & 2033
- Table 33: Rest of South America Waxing Industry Revenue (billion) Forecast, by Application 2020 & 2033
- Table 34: Global Waxing Industry Revenue billion Forecast, by Type 2020 & 2033
- Table 35: Global Waxing Industry Revenue billion Forecast, by Application 2020 & 2033
- Table 36: Global Waxing Industry Revenue billion Forecast, by Country 2020 & 2033
- Table 37: Saudi Arabia Waxing Industry Revenue (billion) Forecast, by Application 2020 & 2033
- Table 38: South Africa Waxing Industry Revenue (billion) Forecast, by Application 2020 & 2033
- Table 39: Rest of Middle East and Africa Waxing Industry Revenue (billion) Forecast, by Application 2020 & 2033
Frequently Asked Questions
1. What is the projected Compound Annual Growth Rate (CAGR) of the Waxing Industry?
The projected CAGR is approximately 9.1%.
2. Which companies are prominent players in the Waxing Industry?
Key companies in the market include BP PLC, Calumet Specialty Products Partners LP, Cepsa, China National Petroleum Corporation, China Petroleum & Chemical Corporation, Eni SpA, Exxon Mobil Corporation, H&R Group, Ilumina Wax d o o, Kemipex, Nippon Siero Co Ltd, Petrobras, Petro Canada Lubricants Inc, Sasol, The International Group Inc, CALWAX*List Not Exhaustive.
3. What are the main segments of the Waxing Industry?
The market segments include Type, Application.
4. Can you provide details about the market size?
The market size is estimated to be USD 25.5 billion as of 2022.
5. What are some drivers contributing to market growth?
Increasing Demand from the Candle and Packaging Industries; Growing Personal Care Industry in the Asia-Pacific Region.
6. What are the notable trends driving market growth?
Increasing Demand from the Cosmetics Industry.
7. Are there any restraints impacting market growth?
Increasing Demand from the Candle and Packaging Industries; Growing Personal Care Industry in the Asia-Pacific Region.
8. Can you provide examples of recent developments in the market?
March 2022: Sasol sold its German subsidiary Sasol Wax GmbH to AWAX s.p.a., which is an international group that specializes in developing, producing, and distributing wax products.
9. What pricing options are available for accessing the report?
Pricing options include single-user, multi-user, and enterprise licenses priced at USD 4750, USD 5250, and USD 8750 respectively.
10. Is the market size provided in terms of value or volume?
The market size is provided in terms of value, measured in billion.
11. Are there any specific market keywords associated with the report?
Yes, the market keyword associated with the report is "Waxing Industry," which aids in identifying and referencing the specific market segment covered.
12. How do I determine which pricing option suits my needs best?
The pricing options vary based on user requirements and access needs. Individual users may opt for single-user licenses, while businesses requiring broader access may choose multi-user or enterprise licenses for cost-effective access to the report.
13. Are there any additional resources or data provided in the Waxing Industry report?
While the report offers comprehensive insights, it's advisable to review the specific contents or supplementary materials provided to ascertain if additional resources or data are available.
14. How can I stay updated on further developments or reports in the Waxing Industry?
To stay informed about further developments, trends, and reports in the Waxing Industry, consider subscribing to industry newsletters, following relevant companies and organizations, or regularly checking reputable industry news sources and publications.
Methodology
Step 1 - Identification of Relevant Samples Size from Population Database


Step 2 - Approaches for Defining Global Market Size (Value, Volume* & Price*)

Note*: In applicable scenarios
Step 3 - Data Sources
Primary Research
- Web Analytics
- Survey Reports
- Research Institute
- Latest Research Reports
- Opinion Leaders
Secondary Research
- Annual Reports
- White Paper
- Latest Press Release
- Industry Association
- Paid Database
- Investor Presentations

Step 4 - Data Triangulation
Involves using different sources of information in order to increase the validity of a study
These sources are likely to be stakeholders in a program - participants, other researchers, program staff, other community members, and so on.
Then we put all data in single framework & apply various statistical tools to find out the dynamic on the market.
During the analysis stage, feedback from the stakeholder groups would be compared to determine areas of agreement as well as areas of divergence