Wireless Infrastructure Monitoring Industry Industry’s Future Growth Prospects

Wireless Infrastructure Monitoring Industry by Type (Hardware, Software and Services), by Application (Geotechnical Monitoring, Structural Monitoring, Environmental Monitoring, Other Ap), by End-user Industry (Civil Infrastructure, Oil and Refineries, Transportation, Mining, Others), by North America, by Europe, by Asia Pacific, by Rest of the World Forecast 2025-2033

Sep 10 2025
Base Year: 2024

234 Pages
Main Logo

Wireless Infrastructure Monitoring Industry Industry’s Future Growth Prospects


Home
Industries
Technology, Media and Telecom
sponsor image
sponsor image
sponsor image
sponsor image
sponsor image
sponsor image
sponsor image
sponsor image
sponsor image
sponsor image
sponsor image
sponsor image
sponsor image
sponsor image
sponsor image
sponsor image
sponsor image
sponsor image
sponsor image
sponsor image

Tailored for you

  • In-depth Analysis Tailored to Specified Regions or Segments
  • Company Profiles Customized to User Preferences
  • Comprehensive Insights Focused on Specific Segments or Regions
  • Customized Evaluation of Competitive Landscape to Meet Your Needs
  • Tailored Customization to Address Other Specific Requirements
Ask for customization


Key Insights

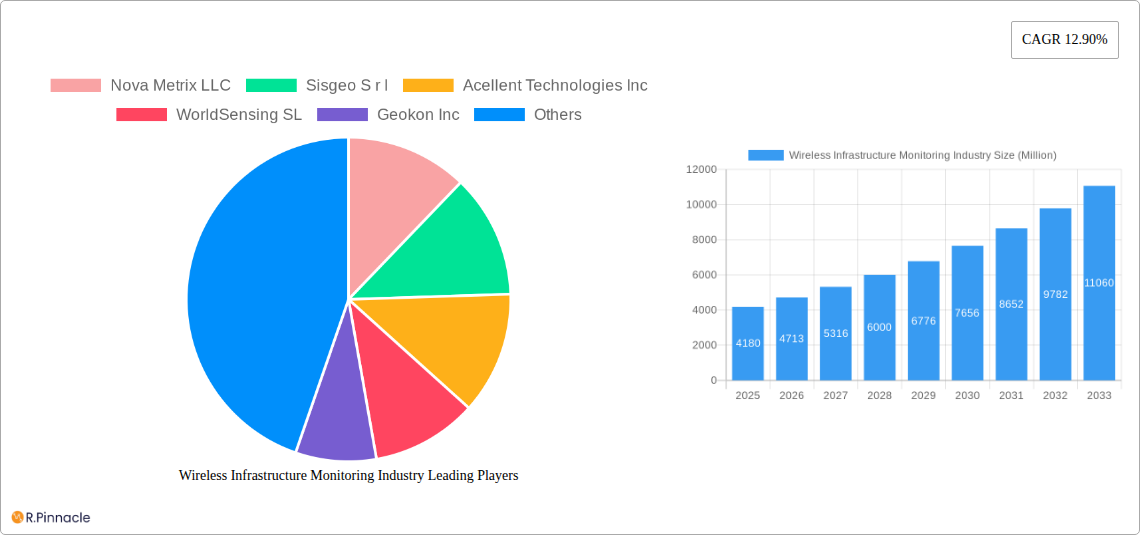
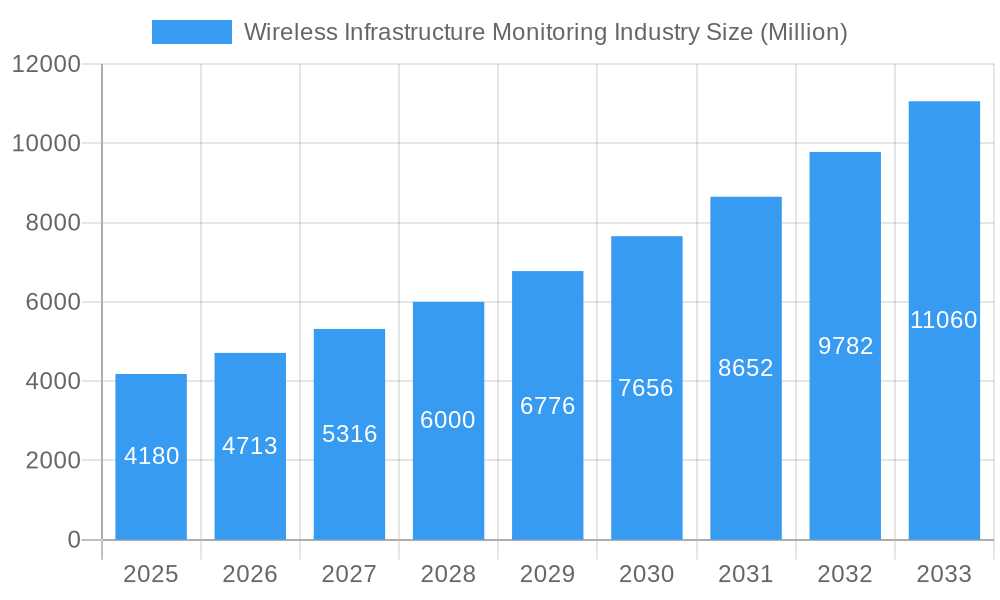
The Wireless Infrastructure Monitoring market is experiencing robust growth, projected to reach \$4.18 billion in 2025 and maintain a Compound Annual Growth Rate (CAGR) of 12.90% from 2025 to 2033. This expansion is driven by several key factors. Increasing urbanization and the consequent need for robust and reliable infrastructure necessitate sophisticated monitoring systems to ensure safety and operational efficiency. Furthermore, advancements in sensor technology, particularly in the Internet of Things (IoT) domain, are enabling more precise, real-time data collection and analysis, leading to proactive maintenance and reduced downtime. The rising adoption of cloud-based solutions facilitates remote monitoring and data management, improving accessibility and reducing operational costs. Government initiatives promoting infrastructure development and smart city projects globally also contribute significantly to market growth. The diverse application segments, including geotechnical, structural, and environmental monitoring across various end-user industries like civil infrastructure, oil and refineries, transportation, and mining, further fuel market expansion.

The market segmentation reveals a significant demand across various applications. Geotechnical monitoring, focusing on soil stability and ground movement, is expected to maintain a leading position due to its critical role in infrastructure safety. Structural monitoring, crucial for identifying potential risks in buildings and bridges, is also a substantial segment. Environmental monitoring, driven by growing concerns about climate change and its impact on infrastructure, is experiencing rapid growth. While hardware constitutes a major portion of the market, the software and services segments are expanding rapidly due to increasing demand for sophisticated data analytics and remote management capabilities. North America and Europe currently hold substantial market shares, but the Asia-Pacific region is anticipated to exhibit the highest growth rate in the forecast period due to rapid infrastructure development and rising investments in smart city initiatives. Competitive rivalry is intense, with established players and emerging technology providers vying for market share, leading to innovation and the development of advanced monitoring solutions.

Wireless Infrastructure Monitoring Industry Research Report - Market Size, Growth & Forecast

Wireless Infrastructure Monitoring Market Report: 2019-2033 Forecast

This comprehensive report provides an in-depth analysis of the Wireless Infrastructure Monitoring industry, projecting a market value of $XX Million by 2033. The study covers the period from 2019 to 2033, with 2025 serving as both the base and estimated year. This report is essential for industry professionals, investors, and strategists seeking actionable insights into this rapidly evolving market. Gain a competitive edge by understanding market dynamics, technological advancements, and emerging opportunities.

Wireless Infrastructure Monitoring Industry Market Structure & Innovation Trends

The Wireless Infrastructure Monitoring market exhibits a moderately consolidated structure, with key players like Nova Metrix LLC, Sisgeo S r l, Acellent Technologies Inc, WorldSensing SL, Geokon Inc, COWI A/S, RST Instruments Ltd (Vance Street Capital), Ackcio Pte Ltd, Geocomp Corporation, and Campbell Scientific Inc. holding significant market share. Precise market share data for each company is unavailable, but a competitive landscape analysis reveals a dynamic interplay between established players and emerging innovators. The market is characterized by ongoing M&A activity, with deal values exceeding $XX Million in recent years, driven by a need for expanded product portfolios and geographical reach. Innovation is primarily fueled by advancements in sensor technology, IoT integration, data analytics, and cloud-based platforms. Regulatory frameworks, particularly those related to data security and environmental compliance, influence industry practices. Product substitutes, such as traditional wired monitoring systems, are gradually being displaced by the advantages offered by wireless solutions. End-user demographics are diversifying, with increasing adoption across various sectors.

  • Market Concentration: Moderately Consolidated
  • M&A Activity: High, with deal values exceeding $XX Million annually.
  • Innovation Drivers: Sensor technology, IoT, Data Analytics, Cloud Computing
  • Regulatory Influences: Data security, environmental compliance.
Wireless Infrastructure Monitoring Industry Growth

Wireless Infrastructure Monitoring Industry Market Dynamics & Trends

The Wireless Infrastructure Monitoring market is experiencing robust growth, projected to achieve a CAGR of XX% during the forecast period (2025-2033). Key drivers include the increasing demand for real-time monitoring, improved infrastructure safety, and the growing adoption of smart city initiatives. Technological advancements, including the development of advanced sensors, miniaturization, and improved data processing capabilities, are further accelerating market expansion. Consumer preferences are shifting towards cost-effective, reliable, and easy-to-use wireless monitoring solutions. Competitive dynamics are shaped by product differentiation, technological innovation, and strategic partnerships. Market penetration is highest in developed economies, but significant growth potential exists in emerging markets due to rising infrastructure investments.

Wireless Infrastructure Monitoring Industry Growth

Dominant Regions & Segments in Wireless Infrastructure Monitoring Industry

The North American market currently holds a dominant position, driven by robust infrastructure spending and the presence of major industry players. However, the Asia-Pacific region is projected to witness the fastest growth rate during the forecast period, fueled by rapid urbanization and industrialization.

Key Drivers:

  • North America: High infrastructure spending, strong technology adoption.
  • Asia-Pacific: Rapid urbanization, industrialization, increasing government investments.
  • Europe: Stringent environmental regulations, focus on sustainable infrastructure.

Dominant Segments:

  • Type: The software segment is projected to experience faster growth than hardware due to the increasing demand for advanced analytics and data management capabilities. Services also contribute significantly, offering support, integration, and data interpretation.
  • Application: Geotechnical monitoring currently holds the largest market share, driven by the need for robust safety measures in construction and mining projects. However, structural monitoring and environmental monitoring are also experiencing rapid growth.
  • End-User Industry: Civil Infrastructure is the dominant end-user segment due to large-scale infrastructure projects, followed by Oil and Refineries, Transportation, and Mining.

Wireless Infrastructure Monitoring Industry Product Innovations

Recent product innovations include the integration of AI and machine learning algorithms for predictive maintenance, enhanced sensor capabilities for improved data accuracy, and the development of user-friendly interfaces for simplified data interpretation. These innovations are enhancing the market fit by providing cost savings, improved operational efficiency, and enhanced safety. The trend towards miniaturization and energy efficiency is also contributing to increased market adoption.

Report Scope & Segmentation Analysis

This report segments the Wireless Infrastructure Monitoring market by Type (Hardware, Software, and Services), Application (Geotechnical Monitoring, Structural Monitoring, Environmental Monitoring, Other Applications), and End-user Industry (Civil Infrastructure, Oil and Refineries, Transportation, Mining, Others). Each segment's growth projections, market size, and competitive dynamics are analyzed in detail. For instance, the software segment is expected to grow at a faster rate than the hardware segment, driven by increasing demand for data analytics and remote monitoring capabilities. Similarly, the geotechnical monitoring application segment is expected to maintain its leading position, driven by robust safety requirements in various infrastructure projects.

Key Drivers of Wireless Infrastructure Monitoring Industry Growth

Several factors drive market growth, including increasing demand for real-time monitoring, advancements in sensor technology, IoT integration, and growing government regulations mandating infrastructure safety and environmental monitoring. The rising adoption of smart city initiatives further fuels market expansion. Cost savings realized through predictive maintenance and improved operational efficiency also contribute significantly to market growth.

Challenges in the Wireless Infrastructure Monitoring Industry Sector

Challenges include the high initial investment costs associated with implementation, concerns regarding data security and privacy, the need for robust communication infrastructure, and potential interoperability issues between different systems. Competition among established and emerging players also presents a challenge. These factors can negatively impact market growth and adoption rates.

Emerging Opportunities in Wireless Infrastructure Monitoring Industry

Emerging opportunities include expanding into new applications, such as precision agriculture and environmental resource management, the integration of 5G technology for enhanced connectivity, and the development of more energy-efficient and durable sensor technologies. Expanding into emerging economies also presents a significant growth opportunity.

Leading Players in the Wireless Infrastructure Monitoring Industry Market

  • Nova Metrix LLC
  • Sisgeo S r l
  • Acellent Technologies Inc
  • WorldSensing SL
  • Geokon Inc
  • COWI A/S
  • RST Instruments Ltd (Vance Street Capital)
  • Ackcio Pte Ltd
  • Geocomp Corporation
  • Campbell Scientific Inc

Key Developments in Wireless Infrastructure Monitoring Industry

  • 2023-Q3: Nova Metrix LLC launched a new generation of wireless sensors with improved accuracy and range.
  • 2022-Q4: A strategic partnership between Acellent Technologies Inc and a major oil refinery company.
  • 2021-Q2: Acquisition of a smaller sensor company by WorldSensing SL, expanding its product portfolio.
  • (Further developments can be added here with specific details, including year and month.)

Future Outlook for Wireless Infrastructure Monitoring Industry Market

The future outlook for the Wireless Infrastructure Monitoring market remains positive. Continued technological advancements, increasing demand for real-time monitoring, and the growth of smart city initiatives will drive substantial growth. Strategic partnerships, acquisitions, and investments in research and development will further shape the market landscape, creating new opportunities for both established players and new entrants.

Wireless Infrastructure Monitoring Industry Segmentation

  • 1. Type
    • 1.1. Hardware
    • 1.2. Software and Services
  • 2. Application
    • 2.1. Geotechnical Monitoring
    • 2.2. Structural Monitoring
    • 2.3. Environmental Monitoring
    • 2.4. Other Ap
  • 3. End-user Industry
    • 3.1. Civil Infrastructure
    • 3.2. Oil and Refineries
    • 3.3. Transportation
    • 3.4. Mining
    • 3.5. Others

Wireless Infrastructure Monitoring Industry Segmentation By Geography

  • 1. North America
  • 2. Europe
  • 3. Asia Pacific
  • 4. Rest of the World
Wireless Infrastructure Monitoring Industry Regional Share


Wireless Infrastructure Monitoring Industry REPORT HIGHLIGHTS

AspectsDetails
Study Period 2019-2033
Base Year 2024
Estimated Year 2025
Forecast Period2025-2033
Historical Period2019-2024
Growth RateCAGR of 12.90% from 2019-2033
Segmentation
    • By Type
      • Hardware
      • Software and Services
    • By Application
      • Geotechnical Monitoring
      • Structural Monitoring
      • Environmental Monitoring
      • Other Ap
    • By End-user Industry
      • Civil Infrastructure
      • Oil and Refineries
      • Transportation
      • Mining
      • Others
  • By Geography
    • North America
    • Europe
    • Asia Pacific
    • Rest of the World


Table of Contents

  1. 1. Introduction
    • 1.1. Research Scope
    • 1.2. Market Segmentation
    • 1.3. Research Methodology
    • 1.4. Definitions and Assumptions
  2. 2. Executive Summary
    • 2.1. Introduction
  3. 3. Market Dynamics
    • 3.1. Introduction
      • 3.2. Market Drivers
        • 3.2.1. ; Stringent Government Regulations Pertaining to Sustainability of Structures; Cost-effective and Flexible Nature for Information Acquisition and Improving Maintenance Efficiency and Safety
      • 3.3. Market Restrains
        • 3.3.1. Lack of Good Infrastructure for the Efficient Functioning of Irrigation Automation Systems; High Costs Associated with the Installation and Lack of Technical Knowledge
      • 3.4. Market Trends
        • 3.4.1. Structural Monitoring Segment is Expected To Grow Significantly
  4. 4. Market Factor Analysis
    • 4.1. Porters Five Forces
    • 4.2. Supply/Value Chain
    • 4.3. PESTEL analysis
    • 4.4. Market Entropy
    • 4.5. Patent/Trademark Analysis
  5. 5. Global Wireless Infrastructure Monitoring Industry Analysis, Insights and Forecast, 2019-2031
    • 5.1. Market Analysis, Insights and Forecast - by Type
      • 5.1.1. Hardware
      • 5.1.2. Software and Services
    • 5.2. Market Analysis, Insights and Forecast - by Application
      • 5.2.1. Geotechnical Monitoring
      • 5.2.2. Structural Monitoring
      • 5.2.3. Environmental Monitoring
      • 5.2.4. Other Ap
    • 5.3. Market Analysis, Insights and Forecast - by End-user Industry
      • 5.3.1. Civil Infrastructure
      • 5.3.2. Oil and Refineries
      • 5.3.3. Transportation
      • 5.3.4. Mining
      • 5.3.5. Others
    • 5.4. Market Analysis, Insights and Forecast - by Region
      • 5.4.1. North America
      • 5.4.2. Europe
      • 5.4.3. Asia Pacific
      • 5.4.4. Rest of the World
  6. 6. North America Wireless Infrastructure Monitoring Industry Analysis, Insights and Forecast, 2019-2031
    • 6.1. Market Analysis, Insights and Forecast - by Type
      • 6.1.1. Hardware
      • 6.1.2. Software and Services
    • 6.2. Market Analysis, Insights and Forecast - by Application
      • 6.2.1. Geotechnical Monitoring
      • 6.2.2. Structural Monitoring
      • 6.2.3. Environmental Monitoring
      • 6.2.4. Other Ap
    • 6.3. Market Analysis, Insights and Forecast - by End-user Industry
      • 6.3.1. Civil Infrastructure
      • 6.3.2. Oil and Refineries
      • 6.3.3. Transportation
      • 6.3.4. Mining
      • 6.3.5. Others
  7. 7. Europe Wireless Infrastructure Monitoring Industry Analysis, Insights and Forecast, 2019-2031
    • 7.1. Market Analysis, Insights and Forecast - by Type
      • 7.1.1. Hardware
      • 7.1.2. Software and Services
    • 7.2. Market Analysis, Insights and Forecast - by Application
      • 7.2.1. Geotechnical Monitoring
      • 7.2.2. Structural Monitoring
      • 7.2.3. Environmental Monitoring
      • 7.2.4. Other Ap
    • 7.3. Market Analysis, Insights and Forecast - by End-user Industry
      • 7.3.1. Civil Infrastructure
      • 7.3.2. Oil and Refineries
      • 7.3.3. Transportation
      • 7.3.4. Mining
      • 7.3.5. Others
  8. 8. Asia Pacific Wireless Infrastructure Monitoring Industry Analysis, Insights and Forecast, 2019-2031
    • 8.1. Market Analysis, Insights and Forecast - by Type
      • 8.1.1. Hardware
      • 8.1.2. Software and Services
    • 8.2. Market Analysis, Insights and Forecast - by Application
      • 8.2.1. Geotechnical Monitoring
      • 8.2.2. Structural Monitoring
      • 8.2.3. Environmental Monitoring
      • 8.2.4. Other Ap
    • 8.3. Market Analysis, Insights and Forecast - by End-user Industry
      • 8.3.1. Civil Infrastructure
      • 8.3.2. Oil and Refineries
      • 8.3.3. Transportation
      • 8.3.4. Mining
      • 8.3.5. Others
  9. 9. Rest of the World Wireless Infrastructure Monitoring Industry Analysis, Insights and Forecast, 2019-2031
    • 9.1. Market Analysis, Insights and Forecast - by Type
      • 9.1.1. Hardware
      • 9.1.2. Software and Services
    • 9.2. Market Analysis, Insights and Forecast - by Application
      • 9.2.1. Geotechnical Monitoring
      • 9.2.2. Structural Monitoring
      • 9.2.3. Environmental Monitoring
      • 9.2.4. Other Ap
    • 9.3. Market Analysis, Insights and Forecast - by End-user Industry
      • 9.3.1. Civil Infrastructure
      • 9.3.2. Oil and Refineries
      • 9.3.3. Transportation
      • 9.3.4. Mining
      • 9.3.5. Others
  10. 10. North America Wireless Infrastructure Monitoring Industry Analysis, Insights and Forecast, 2019-2031
      • 10.1. Market Analysis, Insights and Forecast - By Country/Sub-region
        • 10.1.1 United States
        • 10.1.2 Canada
        • 10.1.3 Mexico
  11. 11. Europe Wireless Infrastructure Monitoring Industry Analysis, Insights and Forecast, 2019-2031
      • 11.1. Market Analysis, Insights and Forecast - By Country/Sub-region
        • 11.1.1 Germany
        • 11.1.2 United Kingdom
        • 11.1.3 France
        • 11.1.4 Spain
        • 11.1.5 Italy
        • 11.1.6 Spain
        • 11.1.7 Belgium
        • 11.1.8 Netherland
        • 11.1.9 Nordics
        • 11.1.10 Rest of Europe
  12. 12. Asia Pacific Wireless Infrastructure Monitoring Industry Analysis, Insights and Forecast, 2019-2031
      • 12.1. Market Analysis, Insights and Forecast - By Country/Sub-region
        • 12.1.1 China
        • 12.1.2 Japan
        • 12.1.3 India
        • 12.1.4 South Korea
        • 12.1.5 Southeast Asia
        • 12.1.6 Australia
        • 12.1.7 Indonesia
        • 12.1.8 Phillipes
        • 12.1.9 Singapore
        • 12.1.10 Thailandc
        • 12.1.11 Rest of Asia Pacific
  13. 13. South America Wireless Infrastructure Monitoring Industry Analysis, Insights and Forecast, 2019-2031
      • 13.1. Market Analysis, Insights and Forecast - By Country/Sub-region
        • 13.1.1 Brazil
        • 13.1.2 Argentina
        • 13.1.3 Peru
        • 13.1.4 Chile
        • 13.1.5 Colombia
        • 13.1.6 Ecuador
        • 13.1.7 Venezuela
        • 13.1.8 Rest of South America
  14. 14. North America Wireless Infrastructure Monitoring Industry Analysis, Insights and Forecast, 2019-2031
      • 14.1. Market Analysis, Insights and Forecast - By Country/Sub-region
        • 14.1.1 United States
        • 14.1.2 Canada
        • 14.1.3 Mexico
  15. 15. MEA Wireless Infrastructure Monitoring Industry Analysis, Insights and Forecast, 2019-2031
      • 15.1. Market Analysis, Insights and Forecast - By Country/Sub-region
        • 15.1.1 United Arab Emirates
        • 15.1.2 Saudi Arabia
        • 15.1.3 South Africa
        • 15.1.4 Rest of Middle East and Africa
  16. 16. Competitive Analysis
    • 16.1. Global Market Share Analysis 2024
      • 16.2. Company Profiles
        • 16.2.1 Nova Metrix LLC
          • 16.2.1.1. Overview
          • 16.2.1.2. Products
          • 16.2.1.3. SWOT Analysis
          • 16.2.1.4. Recent Developments
          • 16.2.1.5. Financials (Based on Availability)
        • 16.2.2 Sisgeo S r l
          • 16.2.2.1. Overview
          • 16.2.2.2. Products
          • 16.2.2.3. SWOT Analysis
          • 16.2.2.4. Recent Developments
          • 16.2.2.5. Financials (Based on Availability)
        • 16.2.3 Acellent Technologies Inc
          • 16.2.3.1. Overview
          • 16.2.3.2. Products
          • 16.2.3.3. SWOT Analysis
          • 16.2.3.4. Recent Developments
          • 16.2.3.5. Financials (Based on Availability)
        • 16.2.4 WorldSensing SL
          • 16.2.4.1. Overview
          • 16.2.4.2. Products
          • 16.2.4.3. SWOT Analysis
          • 16.2.4.4. Recent Developments
          • 16.2.4.5. Financials (Based on Availability)
        • 16.2.5 Geokon Inc
          • 16.2.5.1. Overview
          • 16.2.5.2. Products
          • 16.2.5.3. SWOT Analysis
          • 16.2.5.4. Recent Developments
          • 16.2.5.5. Financials (Based on Availability)
        • 16.2.6 COWI A/S
          • 16.2.6.1. Overview
          • 16.2.6.2. Products
          • 16.2.6.3. SWOT Analysis
          • 16.2.6.4. Recent Developments
          • 16.2.6.5. Financials (Based on Availability)
        • 16.2.7 RST Instruments Ltd (Vance Street Capital)
          • 16.2.7.1. Overview
          • 16.2.7.2. Products
          • 16.2.7.3. SWOT Analysis
          • 16.2.7.4. Recent Developments
          • 16.2.7.5. Financials (Based on Availability)
        • 16.2.8 Ackcio Pte Ltd
          • 16.2.8.1. Overview
          • 16.2.8.2. Products
          • 16.2.8.3. SWOT Analysis
          • 16.2.8.4. Recent Developments
          • 16.2.8.5. Financials (Based on Availability)
        • 16.2.9 Geocomp Corporation
          • 16.2.9.1. Overview
          • 16.2.9.2. Products
          • 16.2.9.3. SWOT Analysis
          • 16.2.9.4. Recent Developments
          • 16.2.9.5. Financials (Based on Availability)
        • 16.2.10 Campbell Scientific Inc
          • 16.2.10.1. Overview
          • 16.2.10.2. Products
          • 16.2.10.3. SWOT Analysis
          • 16.2.10.4. Recent Developments
          • 16.2.10.5. Financials (Based on Availability)

List of Figures

  1. Figure 1: Global Wireless Infrastructure Monitoring Industry Revenue Breakdown (Million, %) by Region 2024 & 2032
  2. Figure 2: Global Wireless Infrastructure Monitoring Industry Volume Breakdown (K Unit, %) by Region 2024 & 2032
  3. Figure 3: North America Wireless Infrastructure Monitoring Industry Revenue (Million), by Country 2024 & 2032
  4. Figure 4: North America Wireless Infrastructure Monitoring Industry Volume (K Unit), by Country 2024 & 2032
  5. Figure 5: North America Wireless Infrastructure Monitoring Industry Revenue Share (%), by Country 2024 & 2032
  6. Figure 6: North America Wireless Infrastructure Monitoring Industry Volume Share (%), by Country 2024 & 2032
  7. Figure 7: Europe Wireless Infrastructure Monitoring Industry Revenue (Million), by Country 2024 & 2032
  8. Figure 8: Europe Wireless Infrastructure Monitoring Industry Volume (K Unit), by Country 2024 & 2032
  9. Figure 9: Europe Wireless Infrastructure Monitoring Industry Revenue Share (%), by Country 2024 & 2032
  10. Figure 10: Europe Wireless Infrastructure Monitoring Industry Volume Share (%), by Country 2024 & 2032
  11. Figure 11: Asia Pacific Wireless Infrastructure Monitoring Industry Revenue (Million), by Country 2024 & 2032
  12. Figure 12: Asia Pacific Wireless Infrastructure Monitoring Industry Volume (K Unit), by Country 2024 & 2032
  13. Figure 13: Asia Pacific Wireless Infrastructure Monitoring Industry Revenue Share (%), by Country 2024 & 2032
  14. Figure 14: Asia Pacific Wireless Infrastructure Monitoring Industry Volume Share (%), by Country 2024 & 2032
  15. Figure 15: South America Wireless Infrastructure Monitoring Industry Revenue (Million), by Country 2024 & 2032
  16. Figure 16: South America Wireless Infrastructure Monitoring Industry Volume (K Unit), by Country 2024 & 2032
  17. Figure 17: South America Wireless Infrastructure Monitoring Industry Revenue Share (%), by Country 2024 & 2032
  18. Figure 18: South America Wireless Infrastructure Monitoring Industry Volume Share (%), by Country 2024 & 2032
  19. Figure 19: North America Wireless Infrastructure Monitoring Industry Revenue (Million), by Country 2024 & 2032
  20. Figure 20: North America Wireless Infrastructure Monitoring Industry Volume (K Unit), by Country 2024 & 2032
  21. Figure 21: North America Wireless Infrastructure Monitoring Industry Revenue Share (%), by Country 2024 & 2032
  22. Figure 22: North America Wireless Infrastructure Monitoring Industry Volume Share (%), by Country 2024 & 2032
  23. Figure 23: MEA Wireless Infrastructure Monitoring Industry Revenue (Million), by Country 2024 & 2032
  24. Figure 24: MEA Wireless Infrastructure Monitoring Industry Volume (K Unit), by Country 2024 & 2032
  25. Figure 25: MEA Wireless Infrastructure Monitoring Industry Revenue Share (%), by Country 2024 & 2032
  26. Figure 26: MEA Wireless Infrastructure Monitoring Industry Volume Share (%), by Country 2024 & 2032
  27. Figure 27: North America Wireless Infrastructure Monitoring Industry Revenue (Million), by Type 2024 & 2032
  28. Figure 28: North America Wireless Infrastructure Monitoring Industry Volume (K Unit), by Type 2024 & 2032
  29. Figure 29: North America Wireless Infrastructure Monitoring Industry Revenue Share (%), by Type 2024 & 2032
  30. Figure 30: North America Wireless Infrastructure Monitoring Industry Volume Share (%), by Type 2024 & 2032
  31. Figure 31: North America Wireless Infrastructure Monitoring Industry Revenue (Million), by Application 2024 & 2032
  32. Figure 32: North America Wireless Infrastructure Monitoring Industry Volume (K Unit), by Application 2024 & 2032
  33. Figure 33: North America Wireless Infrastructure Monitoring Industry Revenue Share (%), by Application 2024 & 2032
  34. Figure 34: North America Wireless Infrastructure Monitoring Industry Volume Share (%), by Application 2024 & 2032
  35. Figure 35: North America Wireless Infrastructure Monitoring Industry Revenue (Million), by End-user Industry 2024 & 2032
  36. Figure 36: North America Wireless Infrastructure Monitoring Industry Volume (K Unit), by End-user Industry 2024 & 2032
  37. Figure 37: North America Wireless Infrastructure Monitoring Industry Revenue Share (%), by End-user Industry 2024 & 2032
  38. Figure 38: North America Wireless Infrastructure Monitoring Industry Volume Share (%), by End-user Industry 2024 & 2032
  39. Figure 39: North America Wireless Infrastructure Monitoring Industry Revenue (Million), by Country 2024 & 2032
  40. Figure 40: North America Wireless Infrastructure Monitoring Industry Volume (K Unit), by Country 2024 & 2032
  41. Figure 41: North America Wireless Infrastructure Monitoring Industry Revenue Share (%), by Country 2024 & 2032
  42. Figure 42: North America Wireless Infrastructure Monitoring Industry Volume Share (%), by Country 2024 & 2032
  43. Figure 43: Europe Wireless Infrastructure Monitoring Industry Revenue (Million), by Type 2024 & 2032
  44. Figure 44: Europe Wireless Infrastructure Monitoring Industry Volume (K Unit), by Type 2024 & 2032
  45. Figure 45: Europe Wireless Infrastructure Monitoring Industry Revenue Share (%), by Type 2024 & 2032
  46. Figure 46: Europe Wireless Infrastructure Monitoring Industry Volume Share (%), by Type 2024 & 2032
  47. Figure 47: Europe Wireless Infrastructure Monitoring Industry Revenue (Million), by Application 2024 & 2032
  48. Figure 48: Europe Wireless Infrastructure Monitoring Industry Volume (K Unit), by Application 2024 & 2032
  49. Figure 49: Europe Wireless Infrastructure Monitoring Industry Revenue Share (%), by Application 2024 & 2032
  50. Figure 50: Europe Wireless Infrastructure Monitoring Industry Volume Share (%), by Application 2024 & 2032
  51. Figure 51: Europe Wireless Infrastructure Monitoring Industry Revenue (Million), by End-user Industry 2024 & 2032
  52. Figure 52: Europe Wireless Infrastructure Monitoring Industry Volume (K Unit), by End-user Industry 2024 & 2032
  53. Figure 53: Europe Wireless Infrastructure Monitoring Industry Revenue Share (%), by End-user Industry 2024 & 2032
  54. Figure 54: Europe Wireless Infrastructure Monitoring Industry Volume Share (%), by End-user Industry 2024 & 2032
  55. Figure 55: Europe Wireless Infrastructure Monitoring Industry Revenue (Million), by Country 2024 & 2032
  56. Figure 56: Europe Wireless Infrastructure Monitoring Industry Volume (K Unit), by Country 2024 & 2032
  57. Figure 57: Europe Wireless Infrastructure Monitoring Industry Revenue Share (%), by Country 2024 & 2032
  58. Figure 58: Europe Wireless Infrastructure Monitoring Industry Volume Share (%), by Country 2024 & 2032
  59. Figure 59: Asia Pacific Wireless Infrastructure Monitoring Industry Revenue (Million), by Type 2024 & 2032
  60. Figure 60: Asia Pacific Wireless Infrastructure Monitoring Industry Volume (K Unit), by Type 2024 & 2032
  61. Figure 61: Asia Pacific Wireless Infrastructure Monitoring Industry Revenue Share (%), by Type 2024 & 2032
  62. Figure 62: Asia Pacific Wireless Infrastructure Monitoring Industry Volume Share (%), by Type 2024 & 2032
  63. Figure 63: Asia Pacific Wireless Infrastructure Monitoring Industry Revenue (Million), by Application 2024 & 2032
  64. Figure 64: Asia Pacific Wireless Infrastructure Monitoring Industry Volume (K Unit), by Application 2024 & 2032
  65. Figure 65: Asia Pacific Wireless Infrastructure Monitoring Industry Revenue Share (%), by Application 2024 & 2032
  66. Figure 66: Asia Pacific Wireless Infrastructure Monitoring Industry Volume Share (%), by Application 2024 & 2032
  67. Figure 67: Asia Pacific Wireless Infrastructure Monitoring Industry Revenue (Million), by End-user Industry 2024 & 2032
  68. Figure 68: Asia Pacific Wireless Infrastructure Monitoring Industry Volume (K Unit), by End-user Industry 2024 & 2032
  69. Figure 69: Asia Pacific Wireless Infrastructure Monitoring Industry Revenue Share (%), by End-user Industry 2024 & 2032
  70. Figure 70: Asia Pacific Wireless Infrastructure Monitoring Industry Volume Share (%), by End-user Industry 2024 & 2032
  71. Figure 71: Asia Pacific Wireless Infrastructure Monitoring Industry Revenue (Million), by Country 2024 & 2032
  72. Figure 72: Asia Pacific Wireless Infrastructure Monitoring Industry Volume (K Unit), by Country 2024 & 2032
  73. Figure 73: Asia Pacific Wireless Infrastructure Monitoring Industry Revenue Share (%), by Country 2024 & 2032
  74. Figure 74: Asia Pacific Wireless Infrastructure Monitoring Industry Volume Share (%), by Country 2024 & 2032
  75. Figure 75: Rest of the World Wireless Infrastructure Monitoring Industry Revenue (Million), by Type 2024 & 2032
  76. Figure 76: Rest of the World Wireless Infrastructure Monitoring Industry Volume (K Unit), by Type 2024 & 2032
  77. Figure 77: Rest of the World Wireless Infrastructure Monitoring Industry Revenue Share (%), by Type 2024 & 2032
  78. Figure 78: Rest of the World Wireless Infrastructure Monitoring Industry Volume Share (%), by Type 2024 & 2032
  79. Figure 79: Rest of the World Wireless Infrastructure Monitoring Industry Revenue (Million), by Application 2024 & 2032
  80. Figure 80: Rest of the World Wireless Infrastructure Monitoring Industry Volume (K Unit), by Application 2024 & 2032
  81. Figure 81: Rest of the World Wireless Infrastructure Monitoring Industry Revenue Share (%), by Application 2024 & 2032
  82. Figure 82: Rest of the World Wireless Infrastructure Monitoring Industry Volume Share (%), by Application 2024 & 2032
  83. Figure 83: Rest of the World Wireless Infrastructure Monitoring Industry Revenue (Million), by End-user Industry 2024 & 2032
  84. Figure 84: Rest of the World Wireless Infrastructure Monitoring Industry Volume (K Unit), by End-user Industry 2024 & 2032
  85. Figure 85: Rest of the World Wireless Infrastructure Monitoring Industry Revenue Share (%), by End-user Industry 2024 & 2032
  86. Figure 86: Rest of the World Wireless Infrastructure Monitoring Industry Volume Share (%), by End-user Industry 2024 & 2032
  87. Figure 87: Rest of the World Wireless Infrastructure Monitoring Industry Revenue (Million), by Country 2024 & 2032
  88. Figure 88: Rest of the World Wireless Infrastructure Monitoring Industry Volume (K Unit), by Country 2024 & 2032
  89. Figure 89: Rest of the World Wireless Infrastructure Monitoring Industry Revenue Share (%), by Country 2024 & 2032
  90. Figure 90: Rest of the World Wireless Infrastructure Monitoring Industry Volume Share (%), by Country 2024 & 2032

List of Tables

  1. Table 1: Global Wireless Infrastructure Monitoring Industry Revenue Million Forecast, by Region 2019 & 2032
  2. Table 2: Global Wireless Infrastructure Monitoring Industry Volume K Unit Forecast, by Region 2019 & 2032
  3. Table 3: Global Wireless Infrastructure Monitoring Industry Revenue Million Forecast, by Type 2019 & 2032
  4. Table 4: Global Wireless Infrastructure Monitoring Industry Volume K Unit Forecast, by Type 2019 & 2032
  5. Table 5: Global Wireless Infrastructure Monitoring Industry Revenue Million Forecast, by Application 2019 & 2032
  6. Table 6: Global Wireless Infrastructure Monitoring Industry Volume K Unit Forecast, by Application 2019 & 2032
  7. Table 7: Global Wireless Infrastructure Monitoring Industry Revenue Million Forecast, by End-user Industry 2019 & 2032
  8. Table 8: Global Wireless Infrastructure Monitoring Industry Volume K Unit Forecast, by End-user Industry 2019 & 2032
  9. Table 9: Global Wireless Infrastructure Monitoring Industry Revenue Million Forecast, by Region 2019 & 2032
  10. Table 10: Global Wireless Infrastructure Monitoring Industry Volume K Unit Forecast, by Region 2019 & 2032
  11. Table 11: Global Wireless Infrastructure Monitoring Industry Revenue Million Forecast, by Country 2019 & 2032
  12. Table 12: Global Wireless Infrastructure Monitoring Industry Volume K Unit Forecast, by Country 2019 & 2032
  13. Table 13: United States Wireless Infrastructure Monitoring Industry Revenue (Million) Forecast, by Application 2019 & 2032
  14. Table 14: United States Wireless Infrastructure Monitoring Industry Volume (K Unit) Forecast, by Application 2019 & 2032
  15. Table 15: Canada Wireless Infrastructure Monitoring Industry Revenue (Million) Forecast, by Application 2019 & 2032
  16. Table 16: Canada Wireless Infrastructure Monitoring Industry Volume (K Unit) Forecast, by Application 2019 & 2032
  17. Table 17: Mexico Wireless Infrastructure Monitoring Industry Revenue (Million) Forecast, by Application 2019 & 2032
  18. Table 18: Mexico Wireless Infrastructure Monitoring Industry Volume (K Unit) Forecast, by Application 2019 & 2032
  19. Table 19: Global Wireless Infrastructure Monitoring Industry Revenue Million Forecast, by Country 2019 & 2032
  20. Table 20: Global Wireless Infrastructure Monitoring Industry Volume K Unit Forecast, by Country 2019 & 2032
  21. Table 21: Germany Wireless Infrastructure Monitoring Industry Revenue (Million) Forecast, by Application 2019 & 2032
  22. Table 22: Germany Wireless Infrastructure Monitoring Industry Volume (K Unit) Forecast, by Application 2019 & 2032
  23. Table 23: United Kingdom Wireless Infrastructure Monitoring Industry Revenue (Million) Forecast, by Application 2019 & 2032
  24. Table 24: United Kingdom Wireless Infrastructure Monitoring Industry Volume (K Unit) Forecast, by Application 2019 & 2032
  25. Table 25: France Wireless Infrastructure Monitoring Industry Revenue (Million) Forecast, by Application 2019 & 2032
  26. Table 26: France Wireless Infrastructure Monitoring Industry Volume (K Unit) Forecast, by Application 2019 & 2032
  27. Table 27: Spain Wireless Infrastructure Monitoring Industry Revenue (Million) Forecast, by Application 2019 & 2032
  28. Table 28: Spain Wireless Infrastructure Monitoring Industry Volume (K Unit) Forecast, by Application 2019 & 2032
  29. Table 29: Italy Wireless Infrastructure Monitoring Industry Revenue (Million) Forecast, by Application 2019 & 2032
  30. Table 30: Italy Wireless Infrastructure Monitoring Industry Volume (K Unit) Forecast, by Application 2019 & 2032
  31. Table 31: Spain Wireless Infrastructure Monitoring Industry Revenue (Million) Forecast, by Application 2019 & 2032
  32. Table 32: Spain Wireless Infrastructure Monitoring Industry Volume (K Unit) Forecast, by Application 2019 & 2032
  33. Table 33: Belgium Wireless Infrastructure Monitoring Industry Revenue (Million) Forecast, by Application 2019 & 2032
  34. Table 34: Belgium Wireless Infrastructure Monitoring Industry Volume (K Unit) Forecast, by Application 2019 & 2032
  35. Table 35: Netherland Wireless Infrastructure Monitoring Industry Revenue (Million) Forecast, by Application 2019 & 2032
  36. Table 36: Netherland Wireless Infrastructure Monitoring Industry Volume (K Unit) Forecast, by Application 2019 & 2032
  37. Table 37: Nordics Wireless Infrastructure Monitoring Industry Revenue (Million) Forecast, by Application 2019 & 2032
  38. Table 38: Nordics Wireless Infrastructure Monitoring Industry Volume (K Unit) Forecast, by Application 2019 & 2032
  39. Table 39: Rest of Europe Wireless Infrastructure Monitoring Industry Revenue (Million) Forecast, by Application 2019 & 2032
  40. Table 40: Rest of Europe Wireless Infrastructure Monitoring Industry Volume (K Unit) Forecast, by Application 2019 & 2032
  41. Table 41: Global Wireless Infrastructure Monitoring Industry Revenue Million Forecast, by Country 2019 & 2032
  42. Table 42: Global Wireless Infrastructure Monitoring Industry Volume K Unit Forecast, by Country 2019 & 2032
  43. Table 43: China Wireless Infrastructure Monitoring Industry Revenue (Million) Forecast, by Application 2019 & 2032
  44. Table 44: China Wireless Infrastructure Monitoring Industry Volume (K Unit) Forecast, by Application 2019 & 2032
  45. Table 45: Japan Wireless Infrastructure Monitoring Industry Revenue (Million) Forecast, by Application 2019 & 2032
  46. Table 46: Japan Wireless Infrastructure Monitoring Industry Volume (K Unit) Forecast, by Application 2019 & 2032
  47. Table 47: India Wireless Infrastructure Monitoring Industry Revenue (Million) Forecast, by Application 2019 & 2032
  48. Table 48: India Wireless Infrastructure Monitoring Industry Volume (K Unit) Forecast, by Application 2019 & 2032
  49. Table 49: South Korea Wireless Infrastructure Monitoring Industry Revenue (Million) Forecast, by Application 2019 & 2032
  50. Table 50: South Korea Wireless Infrastructure Monitoring Industry Volume (K Unit) Forecast, by Application 2019 & 2032
  51. Table 51: Southeast Asia Wireless Infrastructure Monitoring Industry Revenue (Million) Forecast, by Application 2019 & 2032
  52. Table 52: Southeast Asia Wireless Infrastructure Monitoring Industry Volume (K Unit) Forecast, by Application 2019 & 2032
  53. Table 53: Australia Wireless Infrastructure Monitoring Industry Revenue (Million) Forecast, by Application 2019 & 2032
  54. Table 54: Australia Wireless Infrastructure Monitoring Industry Volume (K Unit) Forecast, by Application 2019 & 2032
  55. Table 55: Indonesia Wireless Infrastructure Monitoring Industry Revenue (Million) Forecast, by Application 2019 & 2032
  56. Table 56: Indonesia Wireless Infrastructure Monitoring Industry Volume (K Unit) Forecast, by Application 2019 & 2032
  57. Table 57: Phillipes Wireless Infrastructure Monitoring Industry Revenue (Million) Forecast, by Application 2019 & 2032
  58. Table 58: Phillipes Wireless Infrastructure Monitoring Industry Volume (K Unit) Forecast, by Application 2019 & 2032
  59. Table 59: Singapore Wireless Infrastructure Monitoring Industry Revenue (Million) Forecast, by Application 2019 & 2032
  60. Table 60: Singapore Wireless Infrastructure Monitoring Industry Volume (K Unit) Forecast, by Application 2019 & 2032
  61. Table 61: Thailandc Wireless Infrastructure Monitoring Industry Revenue (Million) Forecast, by Application 2019 & 2032
  62. Table 62: Thailandc Wireless Infrastructure Monitoring Industry Volume (K Unit) Forecast, by Application 2019 & 2032
  63. Table 63: Rest of Asia Pacific Wireless Infrastructure Monitoring Industry Revenue (Million) Forecast, by Application 2019 & 2032
  64. Table 64: Rest of Asia Pacific Wireless Infrastructure Monitoring Industry Volume (K Unit) Forecast, by Application 2019 & 2032
  65. Table 65: Global Wireless Infrastructure Monitoring Industry Revenue Million Forecast, by Country 2019 & 2032
  66. Table 66: Global Wireless Infrastructure Monitoring Industry Volume K Unit Forecast, by Country 2019 & 2032
  67. Table 67: Brazil Wireless Infrastructure Monitoring Industry Revenue (Million) Forecast, by Application 2019 & 2032
  68. Table 68: Brazil Wireless Infrastructure Monitoring Industry Volume (K Unit) Forecast, by Application 2019 & 2032
  69. Table 69: Argentina Wireless Infrastructure Monitoring Industry Revenue (Million) Forecast, by Application 2019 & 2032
  70. Table 70: Argentina Wireless Infrastructure Monitoring Industry Volume (K Unit) Forecast, by Application 2019 & 2032
  71. Table 71: Peru Wireless Infrastructure Monitoring Industry Revenue (Million) Forecast, by Application 2019 & 2032
  72. Table 72: Peru Wireless Infrastructure Monitoring Industry Volume (K Unit) Forecast, by Application 2019 & 2032
  73. Table 73: Chile Wireless Infrastructure Monitoring Industry Revenue (Million) Forecast, by Application 2019 & 2032
  74. Table 74: Chile Wireless Infrastructure Monitoring Industry Volume (K Unit) Forecast, by Application 2019 & 2032
  75. Table 75: Colombia Wireless Infrastructure Monitoring Industry Revenue (Million) Forecast, by Application 2019 & 2032
  76. Table 76: Colombia Wireless Infrastructure Monitoring Industry Volume (K Unit) Forecast, by Application 2019 & 2032
  77. Table 77: Ecuador Wireless Infrastructure Monitoring Industry Revenue (Million) Forecast, by Application 2019 & 2032
  78. Table 78: Ecuador Wireless Infrastructure Monitoring Industry Volume (K Unit) Forecast, by Application 2019 & 2032
  79. Table 79: Venezuela Wireless Infrastructure Monitoring Industry Revenue (Million) Forecast, by Application 2019 & 2032
  80. Table 80: Venezuela Wireless Infrastructure Monitoring Industry Volume (K Unit) Forecast, by Application 2019 & 2032
  81. Table 81: Rest of South America Wireless Infrastructure Monitoring Industry Revenue (Million) Forecast, by Application 2019 & 2032
  82. Table 82: Rest of South America Wireless Infrastructure Monitoring Industry Volume (K Unit) Forecast, by Application 2019 & 2032
  83. Table 83: Global Wireless Infrastructure Monitoring Industry Revenue Million Forecast, by Country 2019 & 2032
  84. Table 84: Global Wireless Infrastructure Monitoring Industry Volume K Unit Forecast, by Country 2019 & 2032
  85. Table 85: United States Wireless Infrastructure Monitoring Industry Revenue (Million) Forecast, by Application 2019 & 2032
  86. Table 86: United States Wireless Infrastructure Monitoring Industry Volume (K Unit) Forecast, by Application 2019 & 2032
  87. Table 87: Canada Wireless Infrastructure Monitoring Industry Revenue (Million) Forecast, by Application 2019 & 2032
  88. Table 88: Canada Wireless Infrastructure Monitoring Industry Volume (K Unit) Forecast, by Application 2019 & 2032
  89. Table 89: Mexico Wireless Infrastructure Monitoring Industry Revenue (Million) Forecast, by Application 2019 & 2032
  90. Table 90: Mexico Wireless Infrastructure Monitoring Industry Volume (K Unit) Forecast, by Application 2019 & 2032
  91. Table 91: Global Wireless Infrastructure Monitoring Industry Revenue Million Forecast, by Country 2019 & 2032
  92. Table 92: Global Wireless Infrastructure Monitoring Industry Volume K Unit Forecast, by Country 2019 & 2032
  93. Table 93: United Arab Emirates Wireless Infrastructure Monitoring Industry Revenue (Million) Forecast, by Application 2019 & 2032
  94. Table 94: United Arab Emirates Wireless Infrastructure Monitoring Industry Volume (K Unit) Forecast, by Application 2019 & 2032
  95. Table 95: Saudi Arabia Wireless Infrastructure Monitoring Industry Revenue (Million) Forecast, by Application 2019 & 2032
  96. Table 96: Saudi Arabia Wireless Infrastructure Monitoring Industry Volume (K Unit) Forecast, by Application 2019 & 2032
  97. Table 97: South Africa Wireless Infrastructure Monitoring Industry Revenue (Million) Forecast, by Application 2019 & 2032
  98. Table 98: South Africa Wireless Infrastructure Monitoring Industry Volume (K Unit) Forecast, by Application 2019 & 2032
  99. Table 99: Rest of Middle East and Africa Wireless Infrastructure Monitoring Industry Revenue (Million) Forecast, by Application 2019 & 2032
  100. Table 100: Rest of Middle East and Africa Wireless Infrastructure Monitoring Industry Volume (K Unit) Forecast, by Application 2019 & 2032
  101. Table 101: Global Wireless Infrastructure Monitoring Industry Revenue Million Forecast, by Type 2019 & 2032
  102. Table 102: Global Wireless Infrastructure Monitoring Industry Volume K Unit Forecast, by Type 2019 & 2032
  103. Table 103: Global Wireless Infrastructure Monitoring Industry Revenue Million Forecast, by Application 2019 & 2032
  104. Table 104: Global Wireless Infrastructure Monitoring Industry Volume K Unit Forecast, by Application 2019 & 2032
  105. Table 105: Global Wireless Infrastructure Monitoring Industry Revenue Million Forecast, by End-user Industry 2019 & 2032
  106. Table 106: Global Wireless Infrastructure Monitoring Industry Volume K Unit Forecast, by End-user Industry 2019 & 2032
  107. Table 107: Global Wireless Infrastructure Monitoring Industry Revenue Million Forecast, by Country 2019 & 2032
  108. Table 108: Global Wireless Infrastructure Monitoring Industry Volume K Unit Forecast, by Country 2019 & 2032
  109. Table 109: Global Wireless Infrastructure Monitoring Industry Revenue Million Forecast, by Type 2019 & 2032
  110. Table 110: Global Wireless Infrastructure Monitoring Industry Volume K Unit Forecast, by Type 2019 & 2032
  111. Table 111: Global Wireless Infrastructure Monitoring Industry Revenue Million Forecast, by Application 2019 & 2032
  112. Table 112: Global Wireless Infrastructure Monitoring Industry Volume K Unit Forecast, by Application 2019 & 2032
  113. Table 113: Global Wireless Infrastructure Monitoring Industry Revenue Million Forecast, by End-user Industry 2019 & 2032
  114. Table 114: Global Wireless Infrastructure Monitoring Industry Volume K Unit Forecast, by End-user Industry 2019 & 2032
  115. Table 115: Global Wireless Infrastructure Monitoring Industry Revenue Million Forecast, by Country 2019 & 2032
  116. Table 116: Global Wireless Infrastructure Monitoring Industry Volume K Unit Forecast, by Country 2019 & 2032
  117. Table 117: Global Wireless Infrastructure Monitoring Industry Revenue Million Forecast, by Type 2019 & 2032
  118. Table 118: Global Wireless Infrastructure Monitoring Industry Volume K Unit Forecast, by Type 2019 & 2032
  119. Table 119: Global Wireless Infrastructure Monitoring Industry Revenue Million Forecast, by Application 2019 & 2032
  120. Table 120: Global Wireless Infrastructure Monitoring Industry Volume K Unit Forecast, by Application 2019 & 2032
  121. Table 121: Global Wireless Infrastructure Monitoring Industry Revenue Million Forecast, by End-user Industry 2019 & 2032
  122. Table 122: Global Wireless Infrastructure Monitoring Industry Volume K Unit Forecast, by End-user Industry 2019 & 2032
  123. Table 123: Global Wireless Infrastructure Monitoring Industry Revenue Million Forecast, by Country 2019 & 2032
  124. Table 124: Global Wireless Infrastructure Monitoring Industry Volume K Unit Forecast, by Country 2019 & 2032
  125. Table 125: Global Wireless Infrastructure Monitoring Industry Revenue Million Forecast, by Type 2019 & 2032
  126. Table 126: Global Wireless Infrastructure Monitoring Industry Volume K Unit Forecast, by Type 2019 & 2032
  127. Table 127: Global Wireless Infrastructure Monitoring Industry Revenue Million Forecast, by Application 2019 & 2032
  128. Table 128: Global Wireless Infrastructure Monitoring Industry Volume K Unit Forecast, by Application 2019 & 2032
  129. Table 129: Global Wireless Infrastructure Monitoring Industry Revenue Million Forecast, by End-user Industry 2019 & 2032
  130. Table 130: Global Wireless Infrastructure Monitoring Industry Volume K Unit Forecast, by End-user Industry 2019 & 2032
  131. Table 131: Global Wireless Infrastructure Monitoring Industry Revenue Million Forecast, by Country 2019 & 2032
  132. Table 132: Global Wireless Infrastructure Monitoring Industry Volume K Unit Forecast, by Country 2019 & 2032


Frequently Asked Questions

1. What is the projected Compound Annual Growth Rate (CAGR) of the Wireless Infrastructure Monitoring Industry?

The projected CAGR is approximately 12.90%.

2. Which companies are prominent players in the Wireless Infrastructure Monitoring Industry?

Key companies in the market include Nova Metrix LLC, Sisgeo S r l, Acellent Technologies Inc, WorldSensing SL, Geokon Inc, COWI A/S, RST Instruments Ltd (Vance Street Capital), Ackcio Pte Ltd, Geocomp Corporation, Campbell Scientific Inc.

3. What are the main segments of the Wireless Infrastructure Monitoring Industry?

The market segments include Type, Application, End-user Industry.

4. Can you provide details about the market size?

The market size is estimated to be USD 4.18 Million as of 2022.

5. What are some drivers contributing to market growth?

; Stringent Government Regulations Pertaining to Sustainability of Structures; Cost-effective and Flexible Nature for Information Acquisition and Improving Maintenance Efficiency and Safety.

6. What are the notable trends driving market growth?

Structural Monitoring Segment is Expected To Grow Significantly.

7. Are there any restraints impacting market growth?

Lack of Good Infrastructure for the Efficient Functioning of Irrigation Automation Systems; High Costs Associated with the Installation and Lack of Technical Knowledge.

8. Can you provide examples of recent developments in the market?

N/A

9. What pricing options are available for accessing the report?

Pricing options include single-user, multi-user, and enterprise licenses priced at USD 4750, USD 5250, and USD 8750 respectively.

10. Is the market size provided in terms of value or volume?

The market size is provided in terms of value, measured in Million and volume, measured in K Unit.

11. Are there any specific market keywords associated with the report?

Yes, the market keyword associated with the report is "Wireless Infrastructure Monitoring Industry," which aids in identifying and referencing the specific market segment covered.

12. How do I determine which pricing option suits my needs best?

The pricing options vary based on user requirements and access needs. Individual users may opt for single-user licenses, while businesses requiring broader access may choose multi-user or enterprise licenses for cost-effective access to the report.

13. Are there any additional resources or data provided in the Wireless Infrastructure Monitoring Industry report?

While the report offers comprehensive insights, it's advisable to review the specific contents or supplementary materials provided to ascertain if additional resources or data are available.

14. How can I stay updated on further developments or reports in the Wireless Infrastructure Monitoring Industry?

To stay informed about further developments, trends, and reports in the Wireless Infrastructure Monitoring Industry, consider subscribing to industry newsletters, following relevant companies and organizations, or regularly checking reputable industry news sources and publications.


Methodology

Step 1 - Identification of Relevant Samples Size from Population Database

Step Chart
Bar Chart
Method Chart

Step 2 - Approaches for Defining Global Market Size (Value, Volume* & Price*)

Approach Chart
Top-down and bottom-up approaches are used to validate the global market size and estimate the market size for manufactures, regional segments, product, and application.

Note*: In applicable scenarios

Step 3 - Data Sources

Primary Research

  • Web Analytics
  • Survey Reports
  • Research Institute
  • Latest Research Reports
  • Opinion Leaders

Secondary Research

  • Annual Reports
  • White Paper
  • Latest Press Release
  • Industry Association
  • Paid Database
  • Investor Presentations
Analyst Chart

Step 4 - Data Triangulation

Involves using different sources of information in order to increase the validity of a study

These sources are likely to be stakeholders in a program - participants, other researchers, program staff, other community members, and so on.

Then we put all data in single framework & apply various statistical tools to find out the dynamic on the market.

During the analysis stage, feedback from the stakeholder groups would be compared to determine areas of agreement as well as areas of divergence

Additionally, after gathering mixed and scattered data from a wide range of sources, data is triangulated and correlated to come up with estimated figures which are further validated through primary mediums or industry experts, opinion leaders.

About Report Pinnacle

Report Pinnacle provides top-tier market research, industry intelligence, and actionable insights for finance, technology, healthcare, and consumer sectors. Our reports empower you to make informed decisions and achieve business success.

Our expert team combines primary research, data analytics, and industry knowledge to deliver insights you can trust. We offer syndicated reports, custom research, and consulting services tailored to your unique business needs.

At Report Pinnacle, we are committed to quality, transparency, and client satisfaction. Every report is rigorously validated to ensure accuracy and relevance. Our global perspective and local expertise help you understand both broad trends and detailed market shifts.

Stay ahead with Report Pinnacle. Subscribe to our newsletter for the latest insights and research highlights, and follow us on social media for real-time updates.

Report Pinnacle – Your Partner for Reaching the Top in Market Intelligence.

artwork spiralartwork spiralRelated Reports
artwork underline

Japan Data Center Power Market Analysis 2025-2033: Unlocking Competitive Opportunities

Discover the booming Japan Data Center Power market! This in-depth analysis reveals a $820 million market in 2025, projected to grow at a 5.27% CAGR through 2033. Explore key drivers, trends, and leading companies shaping this dynamic sector. Learn about the surging demand for UPS systems, generators, and power distribution solutions in IT, BFSI, and government sectors.

September 2025
Base Year: 2024
No Of Pages: 197
Price: $3800

Australia Switchgear Market Competitive Advantage: Trends and Opportunities to 2033

The Australian switchgear market is booming, projected to reach $2.296 billion by 2033, driven by renewable energy, smart grid development, and industrial growth. This in-depth analysis explores market size, CAGR, key players (ABB, Siemens, Schneider Electric), and future trends. Learn more about investment opportunities in this dynamic sector.

September 2025
Base Year: 2024
No Of Pages: 197
Price: $3800

Emerging Growth Patterns in Direct to Consumer Ecommerce Market in India Market

India's booming D2C e-commerce market is projected to reach \$272 Billion by 2033, fueled by a 34.5% CAGR. Discover key trends, leading brands (Nykaa, Boat, Licious), and regional insights in this comprehensive market analysis.

September 2025
Base Year: 2024
No Of Pages: 197
Price: $3800

South Korea MLCC Market Unlocking Growth Potential: Analysis and Forecasts 2025-2033

South Korea's booming MLCC market is projected to reach $XX million by 2025, growing at a CAGR of 5.91%. Discover key trends, market segmentation (dielectric type, case size, voltage, capacitance, mounting type, end-user), leading companies, and future growth forecasts for this dynamic sector.

September 2025
Base Year: 2024
No Of Pages: 197
Price: $3800

Navigating Latin America Consumer Electronic Industry Market Growth 2025-2033

Discover the booming Latin American consumer electronics market! Explore its 8.40% CAGR, key drivers (rising incomes, e-commerce), restraints, leading companies (Samsung, LG, Panasonic), and regional trends (Brazil, Mexico). Get insights into the 2025-2033 forecast for smartphones, TVs, appliances, and more.

September 2025
Base Year: 2024
No Of Pages: 210
Price: $4750

Future Prospects for Magnetic Sensor Market Growth

The magnetic sensor market is booming, projected to reach over $7 billion by 2033 with a CAGR of 7.91%. Driven by automotive, consumer electronics, and industrial applications, key players like Analog Devices and STMicroelectronics are leading the charge in this rapidly expanding sector. Explore market trends, segments (GMR, TMR, Hall Effect), and regional insights.

September 2025
Base Year: 2024
No Of Pages: 234
Price: $4750

Turkey Ecommerce Industry Market Overview: Trends and Strategic Forecasts 2025-2033

Discover the explosive growth of Turkey's e-commerce market, projected to reach [estimated 2033 market size in millions] by 2033 with a CAGR of 22.60%. This in-depth analysis reveals key drivers, trends, challenges, and top players shaping this dynamic sector, including Amazon, Trendyol, and Hepsiburada. Learn more about market segmentation and future growth potential.

September 2025
Base Year: 2024
No Of Pages: 197
Price: $3800

Nigeria Data Center Market Market Growth Fueled by CAGR to XXX Million by 2033

Nigeria's data center market is booming, with a 21.06% CAGR. This analysis explores market size, key drivers (digitalization, e-commerce), restraints, and leading companies like Africa Data Centers and MainOne. Discover the investment opportunities and growth trends in this dynamic sector.

September 2025
Base Year: 2024
No Of Pages: 197
Price: $3800

Saudi Arabia E-Commerce Market XX CAGR Growth to Drive Market Size to XXX Million by 2033

The Saudi Arabia e-commerce market is booming, projected to reach \$13.61 billion by 2025 with a 15.01% CAGR. Discover key drivers, trends, and challenges shaping this dynamic market, including leading companies and segment analysis. Explore the opportunities and future growth projections in this lucrative sector.

September 2025
Base Year: 2024
No Of Pages: 197
Price: $3800

Programmable Robotics Industry Insightful Market Analysis: Trends and Opportunities 2025-2033

Discover the booming programmable robotics market! This in-depth analysis reveals a CAGR of 9.66%, exploring key drivers, trends, and restraints from 2019-2033. Learn about market segmentation, leading companies, and regional growth projections in education, entertainment, and household applications. Get the data you need to understand this dynamic sector.

September 2025
Base Year: 2024
No Of Pages: 234
Price: $4750

Unveiling Cognitive Operations Market Growth Patterns: CAGR Analysis and Forecasts 2025-2033

The Cognitive Operations market is booming, projected to reach $17.59B in 2025 with a 16.38% CAGR. This report analyzes market drivers, trends, restraints, and key players like IBM & Splunk, covering segments like cloud deployment, application performance management, and key verticals. Discover growth opportunities in this rapidly expanding market.

September 2025
Base Year: 2024
No Of Pages: 234
Price: $4750

Enterprise Server Market Strategic Dynamics: Competitor Analysis 2025-2033

The enterprise server market is booming, projected to reach \$164.7 billion by 2033 with an 8.03% CAGR. This in-depth analysis explores key drivers, trends, restraints, and market segmentation across operating systems, server types, and end-user verticals. Learn about leading companies and regional market shares.

September 2025
Base Year: 2024
No Of Pages: 234
Price: $4750

France Fixed Wireless Access (FWA) Market Unlocking Growth Potential: Analysis and Forecasts 2025-2033

The France Fixed Wireless Access (FWA) market is booming, projected to reach €430 million in 2025 and grow at a CAGR of 29.48% until 2033. Driven by 5G advancements and government initiatives, this market offers significant opportunities for providers and investors. Learn more about market trends, key players, and future growth potential.

September 2025
Base Year: 2024
No Of Pages: 197
Price: $3800

Geospatial Data Analytics Market Market’s Consumer Landscape: Insights and Trends 2025-2033

The Geospatial Data Analytics market is booming, projected to reach $86.39 million in 2025, with a CAGR of 12.81% through 2033. Discover key drivers, trends, and regional insights in this comprehensive market analysis covering leading companies and applications in agriculture, defense, and more.

September 2025
Base Year: 2024
No Of Pages: 234
Price: $4750

Strategic Vision for Europe Alternating Current (AC) Motor Market Market Expansion

Discover the latest insights on the booming European AC Motor market. Our analysis reveals a CAGR of 4.20% through 2033, driven by automation, energy efficiency mandates, and renewable energy growth. Explore market size, segmentation, key players (ABB, Siemens, Nidec), and regional trends. Download the full report for a comprehensive overview.

September 2025
Base Year: 2024
No Of Pages: 210
Price: $4750

Hardware Wallet Market Market’s Drivers and Challenges: Strategic Overview 2025-2033

The hardware wallet market is booming, projected to reach $2.55 billion by 2033 with a CAGR of 28.79%. Driven by rising cryptocurrency adoption and security concerns, this in-depth analysis explores market trends, key players (Ledger, Trezor, etc.), and regional growth, offering valuable insights for investors and businesses.

September 2025
Base Year: 2024
No Of Pages: 234
Price: $4750

Strategic Growth Drivers for Mexico LED Lighting Market Market

Discover the booming Mexico LED lighting market! This comprehensive analysis reveals a $1.91B market (2025) with a 9.87% CAGR, driven by government initiatives and technological advancements. Explore market segments, key players, and future growth projections.

September 2025
Base Year: 2024
No Of Pages: 197
Price: $3800

NA Electric Drives Market to Grow at XX CAGR: Market Size Analysis and Forecasts 2025-2033

Discover the booming North American electric drives market! This comprehensive analysis reveals key trends, growth drivers, and market segmentation (AC, DC, Servo drives) from 2019-2033, highlighting leading companies like ABB, Rockwell, and Siemens. Explore the significant opportunities and challenges in oil & gas, chemical, and renewable energy sectors.

September 2025
Base Year: 2024
No Of Pages: 210
Price: $4750

Robotics in Construction Industry Comprehensive Market Study: Trends and Predictions 2025-2033

The Robotics in Construction market is booming, projected to reach \$383.11 million in 2025 and grow at a CAGR of 15.50% through 2033. Driven by labor shortages and technological advancements, this report analyzes market trends, key players (Dusty Robotics, Advanced Construction Robotics), and regional growth in demolition, bricklaying, 3D printing, and more. Discover the future of construction automation.

September 2025
Base Year: 2024
No Of Pages: 234
Price: $4750

Self-Serve Industry Report: Trends and Forecasts 2025-2033

The self-service industry is booming, projected to reach $38.22B in 2025 with a 7.79% CAGR. Explore market trends, key players (NCR, Diebold Nixdorf), and growth drivers in this comprehensive analysis of kiosks, ATMs, vending machines, and more across BFSI, retail, and other sectors.

September 2025
Base Year: 2024
No Of Pages: 234
Price: $4750

Exploring Key Dynamics of Non-Destructive Testing (NDT) Software Market Industry

The NDT Software Market is booming, projected to reach $0.63B in 2025 and grow at a CAGR of 11.10% through 2033. Driven by AI, automation, and increasing demand across industries like oil & gas and aerospace, this report analyzes market trends, key players (Baker Hughes, Zeiss, etc.), and regional growth. Discover the future of non-destructive testing software.

September 2025
Base Year: 2024
No Of Pages: 234
Price: $4750

Strategic Growth Drivers for France Outdoor LED Lighting Market Market

Discover the booming France Outdoor LED Lighting market! This in-depth analysis reveals a CAGR of 19.50% (2025-2033), driven by smart city initiatives and energy efficiency demands. Explore market size, key players (Signify, Thorn Lighting), and future trends.

September 2025
Base Year: 2024
No Of Pages: 197
Price: $3800

Aluminum Electrolytic Capacitor Market Trends and Forecast 2025-2033

The Aluminum Electrolytic Capacitor market is booming, projected to reach [estimated 2033 market size based on CAGR] by 2033. Driven by automotive and electronics growth, this report analyzes market size, CAGR, key players (TDK, Panasonic, Murata), and regional trends. Discover insights into high-voltage, low-voltage segments and future opportunities.

September 2025
Base Year: 2024
No Of Pages: 234
Price: $4750

Exploring LA Package Testing Market Market Disruption and Innovation

Discover the booming LA Package Testing market! This comprehensive analysis reveals a CAGR of 6.00%, driven by e-commerce, sustainability, and regulatory changes. Explore market size, segmentation (glass, paper, plastic, metal packaging; physical, chemical, environmental testing), key players (Intertek, SGS, etc.), and regional trends (North America, Europe, Asia-Pacific). Get insights to optimize your packaging strategy.

September 2025
Base Year: 2024
No Of Pages: 210
Price: $4750

Eye Tracking Solutions Market Growth Pathways: Strategic Analysis and Forecasts 2025-2033

The Eye Tracking Solutions market is booming, projected to reach $9.5 billion by 2033 with a 26% CAGR. This in-depth analysis explores market drivers, trends, restraints, and key players across sectors like automotive, retail, and healthcare. Discover growth opportunities and the latest technological advancements shaping this dynamic industry.

September 2025
Base Year: 2024
No Of Pages: 234
Price: $4750

Netherlands E-commerce Market 2025 Trends and Forecasts 2033: Analyzing Growth Opportunities

Discover the booming Netherlands e-commerce market! This in-depth analysis reveals a €33.43B market in 2025, growing at a 9.31% CAGR until 2033. Explore key drivers, trends, segments (beauty, electronics, fashion), and top players like Bol.com and Zalando.

September 2025
Base Year: 2024
No Of Pages: 197
Price: $3800

Wireless Infrastructure Monitoring Industry Industry’s Future Growth Prospects

The Wireless Infrastructure Monitoring market is booming, projected to reach \$4.18B by 2025 with a 12.90% CAGR. Discover key drivers, trends, and market segmentation insights, including data on geotechnical, structural, and environmental monitoring applications across major industries. Learn about leading companies and regional market shares.

September 2025
Base Year: 2024
No Of Pages: 234
Price: $4750

North America Security Services Market: Disruptive Technologies Driving Market Growth 2025-2033

The North American security services market is booming, projected to reach over $70 billion by 2033, driven by rising cyber threats and stringent regulations. Learn about market trends, key players (IBM, GardaWorld, etc.), and growth opportunities in this comprehensive analysis.

September 2025
Base Year: 2024
No Of Pages: 210
Price: $4750

SMS Firewall Market Industry’s Future Growth Prospects

The SMS Firewall market is booming, projected to reach $XX million by 2033 with a 10.2% CAGR. This report analyzes market drivers, trends, and key players like Twilio and Sinch, covering segments like A2P SMS, cloud platforms, and major industries. Learn about securing your SMS communications against fraud and boosting compliance.

September 2025
Base Year: 2024
No Of Pages: 234
Price: $4750

Overcoming Challenges in Asia Pacific IT Device Market Market: Strategic Insights 2025-2033

Discover the latest insights into the booming Asia-Pacific IT device market. This comprehensive analysis reveals key growth drivers, emerging trends, and regional market shares for PCs, smartphones, and other devices, forecasting market size through 2033. Learn about major players and competitive landscapes.

September 2025
Base Year: 2024
No Of Pages: 234
Price: $4750

UAE Cloud Accounting Software Market Market Expansion Strategies

UAE Cloud Accounting Software Market booming with a CAGR of 14.94%, driven by digital transformation and SME growth. Explore market size, trends, key players (Intuit, Zoho, SAP), and regional insights. Forecast to 2033.

September 2025
Base Year: 2024
No Of Pages: 197
Price: $3800

APAC Data Center Construction Market Market Report: Strategic Insights

Discover the booming APAC data center construction market! This in-depth analysis reveals a projected CAGR of 8.62% through 2033, driven by digitalization, cloud computing, and 5G adoption. Learn about key segments, regional trends, and leading companies shaping this dynamic industry.

September 2025
Base Year: 2024
No Of Pages: 210
Price: $4750

Unveiling Germany Access Control Market Growth Patterns: CAGR Analysis and Forecasts 2025-2033

Discover the booming German access control market! Our in-depth analysis reveals a €520 million market in 2025, projected to grow at a CAGR of 5.92% until 2033. Learn about key drivers, trends, restraints, and leading companies shaping this dynamic sector. Explore market segmentation by device type and end-user vertical.

September 2025
Base Year: 2024
No Of Pages: 197
Price: $3800

Smart Sound and Gateway Market Market Report: Trends and Growth

Discover the booming smart sound & gateway market! Explore its 29.24% CAGR, key drivers like Alexa & Google Assistant, leading companies like Amazon & Google, and regional trends shaping this multi-billion dollar industry. Get insights into smart speaker and hearable market growth forecasts to 2033.

September 2025
Base Year: 2024
No Of Pages: 234
Price: $4750

Hospitality Property Management Software (PMS) Industry Market’s Tech Revolution: Projections to 2033

Discover the booming Hospitality Property Management Software (PMS) market! This comprehensive analysis reveals key trends, growth drivers, and leading companies shaping the future of hotel management. Explore market size projections, regional breakdowns, and emerging technologies driving innovation in the industry. Learn how cloud-based PMS, personalized guest experiences, and revenue management solutions are transforming hospitality.

September 2025
Base Year: 2024
No Of Pages: 234
Price: $4750

Canada Smart Home Market Market’s Strategic Roadmap: Insights for 2025-2033

Discover the booming Canadian smart home market! Explore key trends, growth projections (CAGR 9.20%), leading companies, and segments driving this $3.02 billion (2025) industry. Learn about the opportunities and challenges shaping this rapidly evolving sector.

September 2025
Base Year: 2024
No Of Pages: 197
Price: $3800

MEA Data Center Cooling Market Future-proof Strategies: Trends, Competitor Dynamics, and Opportunities 2025-2033

Discover the booming MEA data center cooling market! This comprehensive analysis reveals key trends, drivers, restraints, and regional market share from 2019-2033, highlighting opportunities for growth in liquid cooling, economizer systems, and related services. Learn about leading companies and projected market size.

September 2025
Base Year: 2024
No Of Pages: 234
Price: $4750

Understanding Europe Pipeline Security Market Trends and Growth Dynamics

The European pipeline security market is booming, projected to reach €6.896 billion by 2033, driven by rising security concerns and technological advancements. Learn about key drivers, trends, and leading companies shaping this rapidly growing sector.

September 2025
Base Year: 2024
No Of Pages: 210
Price: $4750

Drivers of Change in Global Data Center Physical Security Market Market 2025-2033

The Global Data Center Physical Security Market is booming, projected to reach $1.89B in 2025 and grow at a CAGR of 13.72% through 2033. Learn about key drivers, trends, restraints, and leading companies shaping this dynamic sector. Discover market segmentation by solution, service, and end-user, along with regional market share analysis.

September 2025
Base Year: 2024
No Of Pages: 234
Price: $4750

North America Service Robotics Industry Drivers of Growth: Opportunities to 2033

The North American service robotics market is booming, projected to reach [estimated 2033 market size in billions] by 2033 with a 15.10% CAGR. Discover key drivers, trends, and leading companies shaping this dynamic industry across healthcare, logistics, and more. Explore market segmentation, regional analysis, and future growth projections in this comprehensive report.

September 2025
Base Year: 2024
No Of Pages: 234
Price: $4750

Gamification Market Market Demand Dynamics: Insights 2025-2033

The global gamification market is booming, projected to reach [estimated 2033 value] by 2033 with a CAGR of 25.85%. Discover key trends, drivers, and restraints shaping this dynamic industry, along with insights into leading companies and regional market shares. Explore the potential of gamification across retail, banking, healthcare, and more.

August 2025
Base Year: 2024
No Of Pages: 197
Price: $3800

France Factory Automation and Industrial Controls Market Market Expansion: Growth Outlook 2025-2033

Discover the booming France Factory Automation and Industrial Controls market! This in-depth analysis reveals key trends, growth drivers, and market segmentation, projecting a CAGR of 8.47% to 2033. Learn about leading players like Honeywell, Siemens, and ABB, and understand the opportunities in this dynamic sector.

August 2025
Base Year: 2024
No Of Pages: 197
Price: $3800

Machine Vision Camera Industry Charting Growth Trajectories: Analysis and Forecasts 2025-2033

The machine vision camera market is booming, projected to reach $4 billion by 2033 with a 9% CAGR. Driven by automation in electronics, automotive, and healthcare, this report analyzes market trends, key players (Keyence, Cognex, Teledyne DALSA), and regional growth. Discover the latest insights into inline vs. area scan cameras and future market potential.

August 2025
Base Year: 2024
No Of Pages: 234
Price: $4750

US Personal Protective Equipment (PPE) Market Market Overview: Trends and Strategic Forecasts 2025-2033

Discover the booming US Personal Protective Equipment (PPE) market! This analysis reveals key trends, growth drivers, and leading companies shaping the future of workplace safety, including projections through 2033. Learn about market segmentation, regional variations, and investment opportunities.

August 2025
Base Year: 2024
No Of Pages: 197
Price: $3800

Data Quality Tools Industry Growth Pathways: Strategic Analysis and Forecasts 2025-2033

The Data Quality Tools market is booming, with a projected 17.5% CAGR through 2033. Learn about key drivers, market segmentation (cloud, on-premise, BFSI, healthcare, etc.), leading companies, and regional trends shaping this rapidly expanding industry. Discover growth opportunities and challenges in this comprehensive market analysis.

August 2025
Base Year: 2024
No Of Pages: 234
Price: $4750

Robotic Welding For Automotive Manufacturing Market Insightful Market Analysis: Trends and Opportunities 2025-2033

Discover the booming Robotic Welding for Automotive Manufacturing market! Explore key trends, drivers, and restraints shaping this $10B+ industry, featuring leading companies and regional breakdowns. Project your growth strategy with our comprehensive market forecast (2025-2033).

August 2025
Base Year: 2024
No Of Pages: 234
Price: $4750

Interactive Kiosk Market Market Disruption Trends and Insights

The interactive kiosk market is booming, projected to reach \$43.96 billion by 2033, driven by self-service technology adoption and technological advancements. Explore market trends, key players (NCR, Diebold Nixdorf, KIOSK Information Systems), and regional growth in this comprehensive analysis.

August 2025
Base Year: 2024
No Of Pages: 234
Price: $4750

Africa SVOD Market 2025-2033 Overview: Trends, Competitor Dynamics, and Opportunities

Discover the booming African SVOD market! Explore key trends, growth drivers, and challenges in this $2.1B industry (2025 projection), featuring major players like Netflix, ShowMax, and Disney+. Learn about regional variations and future projections in this in-depth market analysis.

August 2025
Base Year: 2024
No Of Pages: 234
Price: $4750

Asia Testing and Inspection Service Industry 2025-2033 Trends: Unveiling Growth Opportunities and Competitor Dynamics

Discover the booming Asia Testing, Inspection, & Certification market! This analysis reveals a \$75.62M market in 2025, projected for 5.5% CAGR growth to 2033. Explore key drivers, trends, and leading companies shaping this dynamic sector across China, India, Japan, and Southeast Asia.

August 2025
Base Year: 2024
No Of Pages: 210
Price: $4750

Los Angeles Data Center Market 2025-2033 Market Analysis: Trends, Dynamics, and Growth Opportunities

Discover the booming Los Angeles data center market! Our analysis reveals a 4.5% CAGR, driven by cloud computing, 5G, and media & entertainment. Explore key trends, market size projections (2025-2033), leading companies, and regional insights. Learn more about investment opportunities in this dynamic sector.

August 2025
Base Year: 2024
No Of Pages: 197
Price: $3800
  • Home
  • About Us
  • Industries
    • Aerospace & Defense
    • Agriculture
    • Animal Nutrition & Wellness
    • Automotive
    • Chemicals & Materials
    • Consumer Goods and Services
    • Energy & Power
    • Financial Services and Investment Intelligence
    • Food & Beverage
    • Home and Property Improvement
    • Hospitality and Tourism
    • Logistics
    • Manufacturing Products and Services
    • Packaging
    • Professional and Commercial Services
    • Real Estate and Construction
    • Retail
    • Technology, Media and Telecom
    • Healthcare
  • Services
  • Contact
Main Logo
  • Home
  • About Us
  • Industries
    • Aerospace & Defense
    • Agriculture
    • Animal Nutrition & Wellness
    • Automotive
    • Chemicals & Materials
    • Consumer Goods and Services
    • Energy & Power
    • Financial Services and Investment Intelligence
    • Food & Beverage
    • Home and Property Improvement
    • Hospitality and Tourism
    • Logistics
    • Manufacturing Products and Services
    • Packaging
    • Professional and Commercial Services
    • Real Estate and Construction
    • Retail
    • Technology, Media and Telecom
    • Healthcare
  • Services
  • Contact
+17162654855
[email protected]

+17162654855

[email protected]

Business Address

Head Office

Ansec House 3 rd floor Tank Road, Yerwada, Pune, Maharashtra 411014

Contact Information

Craig Francis

Business Development Head

+17162654855

[email protected]

Secure Payment Partners

payment image
RetailLogisticsPackagingAutomotiveHealthcareAgricultureEnergy & PowerFood & BeverageAerospace & DefenseChemicals & MaterialsHospitality and TourismAnimal Nutrition & WellnessConsumer Goods and ServicesReal Estate and ConstructionHome and Property ImprovementTechnology, Media and TelecomManufacturing Products and ServicesFinancial Services and Investment Intelligence

© 2025 PRDUA Research & Media Private Limited, All rights reserved

Privacy Policy
Terms and Conditions
FAQ