

Key Insights
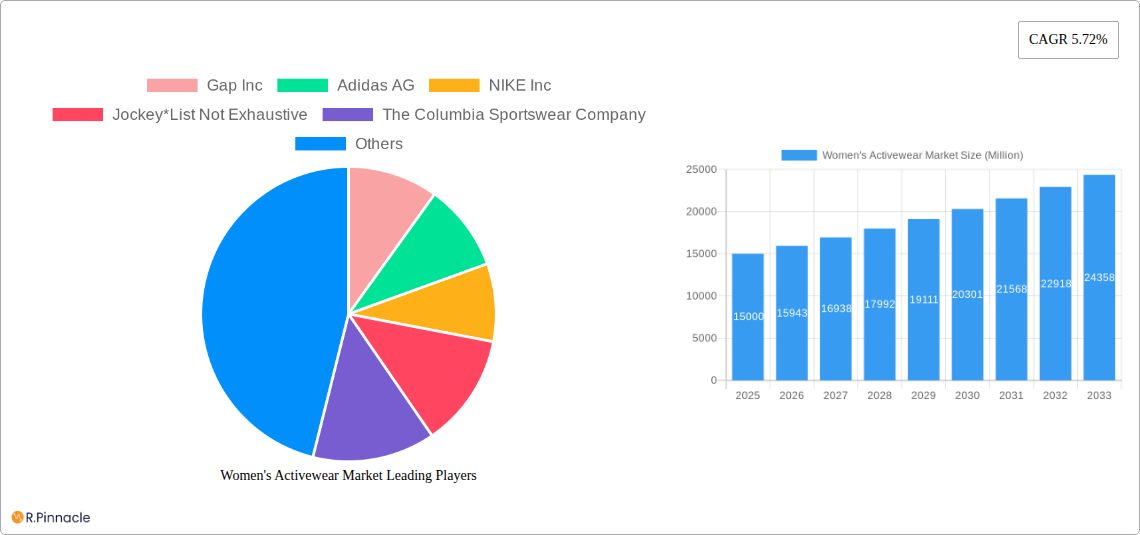
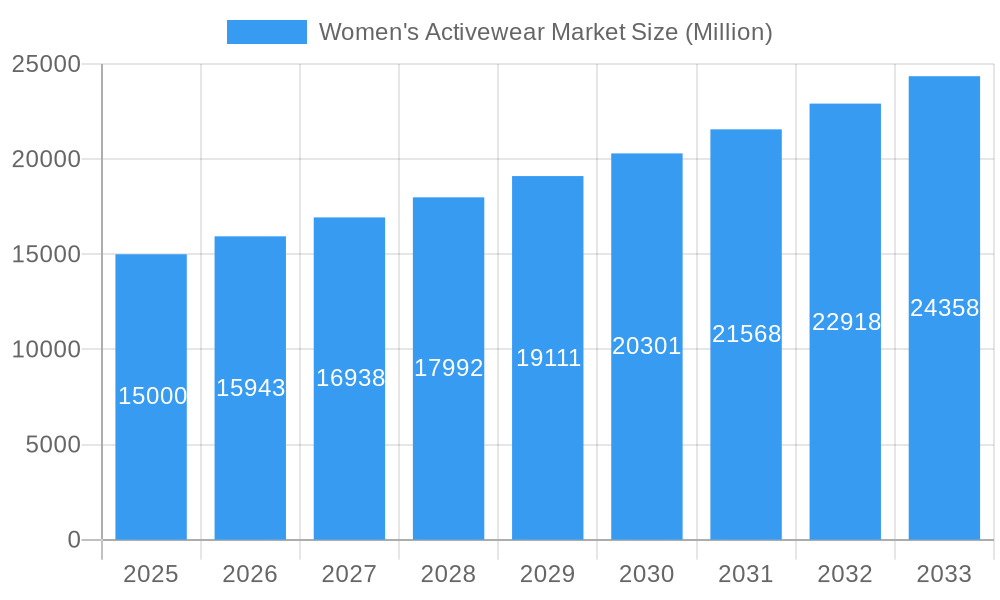
The global women's activewear market is experiencing robust growth, projected to maintain a Compound Annual Growth Rate (CAGR) of 5.72% from 2025 to 2033. This expansion is fueled by several key factors. The rising popularity of fitness and wellness lifestyles among women of all ages is a significant driver, leading to increased demand for comfortable and functional athletic apparel. Furthermore, the growing preference for athleisure—blending athletic wear with casual fashion—is broadening the market's appeal beyond dedicated workouts. E-commerce platforms are playing a crucial role, offering convenience and expanding reach to a wider customer base, contributing to market growth. Segmentation reveals that the 18-34 age demographic currently holds the largest market share, reflecting the strong influence of fitness trends and social media among younger women. However, the 35-54 age group shows significant potential for future growth as health and wellness become increasingly important across all demographics. Competitive pressures are significant, with established brands like Nike, Adidas, and Under Armour vying for market share alongside emerging players offering innovative designs and sustainable practices. The market is further segmented by product type (tops, bottoms, etc.), distribution channels (online and offline), and geographic region, revealing distinct growth patterns and opportunities across these segments. North America and Europe currently hold the largest market share, driven by high consumer spending and established brand presence; however, rapid economic growth in Asia-Pacific presents significant untapped potential for future expansion.
Women's Activewear Market Market Size (In Billion)
The market faces certain challenges, including fluctuating raw material costs and increasing competition, particularly from private label brands. However, innovation in materials technology (sustainable and performance fabrics) and the rising emphasis on personalized fitness experiences offer significant opportunities. Brands are focusing on product diversification (e.g., incorporating technology for performance tracking), personalized marketing strategies targeting specific demographics, and building stronger brand loyalty through community building and influencer collaborations. The future of the women's activewear market is characterized by a dynamic interplay of technological advancements, evolving consumer preferences, and intense competition, offering both opportunities and challenges for businesses operating in this space.
Women's Activewear Market Company Market Share
Women's Activewear Market Report: 2019-2033
This comprehensive report provides an in-depth analysis of the global women's activewear market, offering valuable insights for industry professionals, investors, and strategic decision-makers. With a study period spanning 2019-2033, a base year of 2025, and a forecast period of 2025-2033, this report delivers a detailed overview of market size (in Millions), growth drivers, challenges, and emerging opportunities. Key companies analyzed include Gap Inc, Adidas AG, NIKE Inc, Jockey, The Columbia Sportswear Company, PUMA SE, Decathlon, Amante, Mizuno USA, Under Armour Inc, and VIE ACTIVE. The report segments the market by product type, distribution channel, and end-user demographics.
Women's Activewear Market Structure & Innovation Trends
The women's activewear market is characterized by a moderately concentrated structure, with key players holding significant market share. While precise figures for market share are proprietary within the full report, Nike, Adidas, and Under Armour are prominent leaders. The market demonstrates significant innovation, driven by advancements in fabric technology (e.g., moisture-wicking, breathable materials), sustainable production practices, and the integration of smart technologies. Regulatory frameworks focusing on ethical sourcing and environmental sustainability are shaping the industry landscape. Product substitutes include casual wear and athleisure clothing; however, the activewear market benefits from its strong association with fitness and wellness trends. The end-user demographics are diverse, spanning various age groups with differing preferences and needs. M&A activity in the sector has been moderate, with deal values varying significantly based on the size and strategic fit of the companies involved. The full report offers a detailed analysis of completed M&A deals from the historical period.
Women's Activewear Market Market Dynamics & Trends
The global women's activewear market is experiencing robust growth, exhibiting a Compound Annual Growth Rate (CAGR) of xx% during the forecast period (2025-2033). Key drivers include the rising popularity of fitness and wellness activities, increased disposable incomes in emerging economies, and the growing demand for comfortable and stylish activewear. Technological disruptions, including the introduction of smart fabrics and personalized fitness tracking features, are transforming consumer experiences and driving innovation. Consumer preferences are increasingly shifting towards sustainable, ethically produced apparel, influencing brand choices and market dynamics. Competitive dynamics are fierce, with leading brands focusing on product differentiation, brand building, and strategic partnerships to gain market share. Market penetration is high in developed nations but still offers significant potential for growth in emerging markets. The detailed market sizing for each segment is covered comprehensively in the full report.
Dominant Regions & Segments in Women's Activewear Market
Leading Region: North America currently holds a dominant position in the women's activewear market, driven by high consumer spending on fitness and wellness, and a strong presence of major brands. Europe follows closely, while Asia-Pacific is experiencing rapid growth. The report provides a detailed regional analysis including key drivers like economic policies and infrastructure for each region.
Leading Segment (By Product Type): Tops & T-shirts and sweatpants/yoga pants represent the largest market segments by product type due to their versatility and everyday usage.
Leading Segment (By Distribution Channel): Online retail stores are rapidly gaining market share due to convenience and ease of access for consumers. Speciality stores remain significant players, offering personalized service and brand expertise.
Leading Segment (By End User): The 25-34 age group exhibits the highest demand for women's activewear, reflecting their higher participation in fitness activities and higher disposable income. However, other age groups are also showing significant growth. The report presents a full breakdown of market size by age demographic.
Women's Activewear Market Product Innovations
Recent innovations in women's activewear focus on enhanced functionality, sustainability, and style. This includes the integration of moisture-wicking and antimicrobial fabrics, the use of recycled materials, and the incorporation of smart technologies for fitness tracking. These innovations cater to the evolving needs and preferences of consumers, providing comfort, performance, and style, enhancing the competitive advantages of brands.
Report Scope & Segmentation Analysis
This report segments the women's activewear market across three key dimensions:
By Product Type: Tops & T-shirts, Sweatpants & Yoga Pants, Skirts & Skorts, Tracksuits, Sweatshirts/Jackets, Others. Each segment shows varying growth rates reflecting individual consumer trends.
By Distribution Channel: Supermarkets/Hypermarkets, Speciality Stores, Online Retail Stores, Other Distribution Channels. The report provides projections for each channel, highlighting online retail's dominant growth trajectory.
By End User: Women aged 18-24, Women aged 25-34, Women aged 35-44, Women aged 45-54, Women aged 55+. The report details the market size and growth projections for each demographic segment. The competitive landscape within each segment is also analyzed.
Key Drivers of Women's Activewear Market Growth
Several factors propel the growth of the women's activewear market. The increasing adoption of fitness and wellness lifestyles, coupled with rising disposable incomes, particularly in developing economies, fuels demand. Technological advancements in fabrics and design improve product performance and appeal. Government initiatives promoting health and wellness create a supportive regulatory environment, further accelerating market growth.
Challenges in the Women's Activewear Market Sector
The women's activewear market faces challenges, including intense competition among established brands and emerging players. Supply chain disruptions can impact production and distribution, impacting pricing and availability. Stringent environmental regulations increase production costs and necessitate sustainable practices.
Emerging Opportunities in Women's Activewear Market
Significant opportunities exist in the women's activewear market, including the growing demand for sustainable and ethically sourced products. The expansion into emerging markets offers considerable untapped potential. The integration of technology and personalization presents avenues for innovation and increased consumer engagement.
Leading Players in the Women's Activewear Market Market
- Gap Inc
- Adidas AG
- NIKE Inc
- Jockey
- The Columbia Sportswear Company
- PUMA SE
- Decathlon
- Amante
- Mizuno USA
- Under Armour Inc
- VIE ACTIVE
Key Developments in Women's Activewear Market Industry
- August 2022: H&M launched its H&M Move activewear line, focusing on affordability and accessibility.
- May 2022: Zara launched its first women's sports collection targeted at high-impact outdoor activities.
- May 2021: Trophy Fitness Clothing launched a new ladies' gym wear collection.
Future Outlook for Women's Activewear Market Market
The future of the women's activewear market is bright. Continued growth is anticipated, driven by evolving consumer preferences, technological innovation, and expansion into new markets. Strategic partnerships, brand building, and sustainable practices will be crucial for success in this dynamic and competitive landscape. The market is expected to reach xx Million by 2033.
Women's Activewear Market Segmentation
-
1. Product Type
- 1.1. Tops & T-Shirts
- 1.2. Sweatpants & Yoga Pants
- 1.3. Skirts & Skorts
- 1.4. Tracksuits
- 1.5. Sweatshirts/Jacket
- 1.6. Others
-
2. Distribution Channel
- 2.1. Supermarkets/Hypermarkets
- 2.2. Speciality Stores
- 2.3. Online Retail Stores
- 2.4. Other Distribution Channels
Women's Activewear Market Segmentation By Geography
-
1. North America
- 1.1. United States
- 1.2. Canada
- 1.3. Mexico
- 1.4. Rest of North America
-
2. Europe
- 2.1. Spain
- 2.2. United Kingdom
- 2.3. Germany
- 2.4. France
- 2.5. Italy
- 2.6. Russia
- 2.7. Rest of Europe
-
3. Asia Pacific
- 3.1. China
- 3.2. Japan
- 3.3. India
- 3.4. Australia
- 3.5. Rest of Asia Pacific
-
4. South America
- 4.1. Brazil
- 4.2. Argentina
- 4.3. Rest of South America
-
5. Middle East and Africa
- 5.1. South Africa
- 5.2. Saudi Arabia
- 5.3. Rest of Middle East and Africa
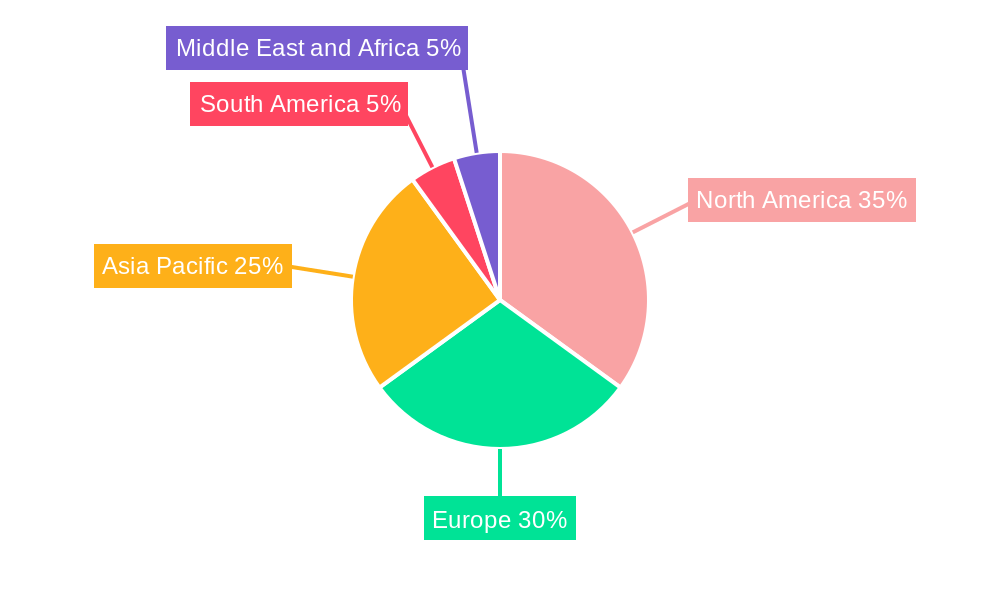
Women's Activewear Market Regional Market Share
Geographic Coverage of Women's Activewear Market
Women's Activewear Market REPORT HIGHLIGHTS
| Aspects | Details |
|---|---|
| Study Period | 2020-2034 |
| Base Year | 2025 |
| Estimated Year | 2026 |
| Forecast Period | 2026-2034 |
| Historical Period | 2020-2025 |
| Growth Rate | CAGR of 9% from 2020-2034 |
| Segmentation |
|
Table of Contents
- 1. Introduction
- 1.1. Research Scope
- 1.2. Market Segmentation
- 1.3. Research Objective
- 1.4. Definitions and Assumptions
- 2. Executive Summary
- 2.1. Market Snapshot
- 3. Market Dynamics
- 3.1. Market Drivers
- 3.2. Market Restrains
- 3.3. Market Trends
- 3.4. Market Opportunities
- 4. Market Factor Analysis
- 4.1. Porters Five Forces
- 4.1.1. Bargaining Power of Suppliers
- 4.1.2. Bargaining Power of Buyers
- 4.1.3. Threat of New Entrants
- 4.1.4. Threat of Substitutes
- 4.1.5. Competitive Rivalry
- 4.2. PESTEL analysis
- 4.3. BCG Analysis
- 4.3.1. Stars (High Growth, High Market Share)
- 4.3.2. Cash Cows (Low Growth, High Market Share)
- 4.3.3. Question Mark (High Growth, Low Market Share)
- 4.3.4. Dogs (Low Growth, Low Market Share)
- 4.4. Ansoff Matrix Analysis
- 4.5. Supply Chain Analysis
- 4.6. Regulatory Landscape
- 4.7. Current Market Potential and Opportunity Assessment (TAM–SAM–SOM Framework)
- 4.8. PRI Analyst Note
- 4.1. Porters Five Forces
- 5. Market Analysis, Insights and Forecast 2021-2033
- 5.1. Market Analysis, Insights and Forecast - by Product Type
- 5.1.1. Tops & T-Shirts
- 5.1.2. Sweatpants & Yoga Pants
- 5.1.3. Skirts & Skorts
- 5.1.4. Tracksuits
- 5.1.5. Sweatshirts/Jacket
- 5.1.6. Others
- 5.2. Market Analysis, Insights and Forecast - by Distribution Channel
- 5.2.1. Supermarkets/Hypermarkets
- 5.2.2. Speciality Stores
- 5.2.3. Online Retail Stores
- 5.2.4. Other Distribution Channels
- 5.3. Market Analysis, Insights and Forecast - by Region
- 5.3.1. North America
- 5.3.2. Europe
- 5.3.3. Asia Pacific
- 5.3.4. South America
- 5.3.5. Middle East and Africa
- 5.1. Market Analysis, Insights and Forecast - by Product Type
- 6. Global Women's Activewear Market Analysis, Insights and Forecast, 2021-2033
- 6.1. Market Analysis, Insights and Forecast - by Product Type
- 6.1.1. Tops & T-Shirts
- 6.1.2. Sweatpants & Yoga Pants
- 6.1.3. Skirts & Skorts
- 6.1.4. Tracksuits
- 6.1.5. Sweatshirts/Jacket
- 6.1.6. Others
- 6.2. Market Analysis, Insights and Forecast - by Distribution Channel
- 6.2.1. Supermarkets/Hypermarkets
- 6.2.2. Speciality Stores
- 6.2.3. Online Retail Stores
- 6.2.4. Other Distribution Channels
- 6.1. Market Analysis, Insights and Forecast - by Product Type
- 7. North America Women's Activewear Market Analysis, Insights and Forecast, 2020-2032
- 7.1. Market Analysis, Insights and Forecast - by Product Type
- 7.1.1. Tops & T-Shirts
- 7.1.2. Sweatpants & Yoga Pants
- 7.1.3. Skirts & Skorts
- 7.1.4. Tracksuits
- 7.1.5. Sweatshirts/Jacket
- 7.1.6. Others
- 7.2. Market Analysis, Insights and Forecast - by Distribution Channel
- 7.2.1. Supermarkets/Hypermarkets
- 7.2.2. Speciality Stores
- 7.2.3. Online Retail Stores
- 7.2.4. Other Distribution Channels
- 7.1. Market Analysis, Insights and Forecast - by Product Type
- 8. Europe Women's Activewear Market Analysis, Insights and Forecast, 2020-2032
- 8.1. Market Analysis, Insights and Forecast - by Product Type
- 8.1.1. Tops & T-Shirts
- 8.1.2. Sweatpants & Yoga Pants
- 8.1.3. Skirts & Skorts
- 8.1.4. Tracksuits
- 8.1.5. Sweatshirts/Jacket
- 8.1.6. Others
- 8.2. Market Analysis, Insights and Forecast - by Distribution Channel
- 8.2.1. Supermarkets/Hypermarkets
- 8.2.2. Speciality Stores
- 8.2.3. Online Retail Stores
- 8.2.4. Other Distribution Channels
- 8.1. Market Analysis, Insights and Forecast - by Product Type
- 9. Asia Pacific Women's Activewear Market Analysis, Insights and Forecast, 2020-2032
- 9.1. Market Analysis, Insights and Forecast - by Product Type
- 9.1.1. Tops & T-Shirts
- 9.1.2. Sweatpants & Yoga Pants
- 9.1.3. Skirts & Skorts
- 9.1.4. Tracksuits
- 9.1.5. Sweatshirts/Jacket
- 9.1.6. Others
- 9.2. Market Analysis, Insights and Forecast - by Distribution Channel
- 9.2.1. Supermarkets/Hypermarkets
- 9.2.2. Speciality Stores
- 9.2.3. Online Retail Stores
- 9.2.4. Other Distribution Channels
- 9.1. Market Analysis, Insights and Forecast - by Product Type
- 10. South America Women's Activewear Market Analysis, Insights and Forecast, 2020-2032
- 10.1. Market Analysis, Insights and Forecast - by Product Type
- 10.1.1. Tops & T-Shirts
- 10.1.2. Sweatpants & Yoga Pants
- 10.1.3. Skirts & Skorts
- 10.1.4. Tracksuits
- 10.1.5. Sweatshirts/Jacket
- 10.1.6. Others
- 10.2. Market Analysis, Insights and Forecast - by Distribution Channel
- 10.2.1. Supermarkets/Hypermarkets
- 10.2.2. Speciality Stores
- 10.2.3. Online Retail Stores
- 10.2.4. Other Distribution Channels
- 10.1. Market Analysis, Insights and Forecast - by Product Type
- 11. Middle East and Africa Women's Activewear Market Analysis, Insights and Forecast, 2020-2032
- 11.1. Market Analysis, Insights and Forecast - by Product Type
- 11.1.1. Tops & T-Shirts
- 11.1.2. Sweatpants & Yoga Pants
- 11.1.3. Skirts & Skorts
- 11.1.4. Tracksuits
- 11.1.5. Sweatshirts/Jacket
- 11.1.6. Others
- 11.2. Market Analysis, Insights and Forecast - by Distribution Channel
- 11.2.1. Supermarkets/Hypermarkets
- 11.2.2. Speciality Stores
- 11.2.3. Online Retail Stores
- 11.2.4. Other Distribution Channels
- 11.1. Market Analysis, Insights and Forecast - by Product Type
- 12. Competitive Analysis
- 12.1. Company Profiles
- 12.1.1 Gap Inc
- 12.1.1.1. Company Overview
- 12.1.1.2. Products
- 12.1.1.3. Company Financials
- 12.1.1.4. SWOT Analysis
- 12.1.2 Adidas AG
- 12.1.2.1. Company Overview
- 12.1.2.2. Products
- 12.1.2.3. Company Financials
- 12.1.2.4. SWOT Analysis
- 12.1.3 NIKE Inc
- 12.1.3.1. Company Overview
- 12.1.3.2. Products
- 12.1.3.3. Company Financials
- 12.1.3.4. SWOT Analysis
- 12.1.4 Jockey*List Not Exhaustive
- 12.1.4.1. Company Overview
- 12.1.4.2. Products
- 12.1.4.3. Company Financials
- 12.1.4.4. SWOT Analysis
- 12.1.5 The Columbia Sportswear Company
- 12.1.5.1. Company Overview
- 12.1.5.2. Products
- 12.1.5.3. Company Financials
- 12.1.5.4. SWOT Analysis
- 12.1.6 PUMA SE
- 12.1.6.1. Company Overview
- 12.1.6.2. Products
- 12.1.6.3. Company Financials
- 12.1.6.4. SWOT Analysis
- 12.1.7 Decathlon
- 12.1.7.1. Company Overview
- 12.1.7.2. Products
- 12.1.7.3. Company Financials
- 12.1.7.4. SWOT Analysis
- 12.1.8 Amante
- 12.1.8.1. Company Overview
- 12.1.8.2. Products
- 12.1.8.3. Company Financials
- 12.1.8.4. SWOT Analysis
- 12.1.9 Mizuno USA
- 12.1.9.1. Company Overview
- 12.1.9.2. Products
- 12.1.9.3. Company Financials
- 12.1.9.4. SWOT Analysis
- 12.1.10 Under Armour Inc
- 12.1.10.1. Company Overview
- 12.1.10.2. Products
- 12.1.10.3. Company Financials
- 12.1.10.4. SWOT Analysis
- 12.1.11 VIE ACTIVE
- 12.1.11.1. Company Overview
- 12.1.11.2. Products
- 12.1.11.3. Company Financials
- 12.1.11.4. SWOT Analysis
- 12.1.1 Gap Inc
- 12.2. Market Entropy
- 12.2.1 Company's Key Areas Served
- 12.2.2 Recent Developments
- 12.3. Company Market Share Analysis 2025
- 12.3.1 Top 5 Companies Market Share Analysis
- 12.3.2 Top 3 Companies Market Share Analysis
- 12.4. List of Potential Customers
- 13. Research Methodology
List of Figures
- Figure 1: Global Women's Activewear Market Revenue Breakdown (billion, %) by Region 2025 & 2033
- Figure 2: Global Women's Activewear Market Volume Breakdown (K Units, %) by Region 2025 & 2033
- Figure 3: North America Women's Activewear Market Revenue (billion), by Product Type 2025 & 2033
- Figure 4: North America Women's Activewear Market Volume (K Units), by Product Type 2025 & 2033
- Figure 5: North America Women's Activewear Market Revenue Share (%), by Product Type 2025 & 2033
- Figure 6: North America Women's Activewear Market Volume Share (%), by Product Type 2025 & 2033
- Figure 7: North America Women's Activewear Market Revenue (billion), by Distribution Channel 2025 & 2033
- Figure 8: North America Women's Activewear Market Volume (K Units), by Distribution Channel 2025 & 2033
- Figure 9: North America Women's Activewear Market Revenue Share (%), by Distribution Channel 2025 & 2033
- Figure 10: North America Women's Activewear Market Volume Share (%), by Distribution Channel 2025 & 2033
- Figure 11: North America Women's Activewear Market Revenue (billion), by Country 2025 & 2033
- Figure 12: North America Women's Activewear Market Volume (K Units), by Country 2025 & 2033
- Figure 13: North America Women's Activewear Market Revenue Share (%), by Country 2025 & 2033
- Figure 14: North America Women's Activewear Market Volume Share (%), by Country 2025 & 2033
- Figure 15: Europe Women's Activewear Market Revenue (billion), by Product Type 2025 & 2033
- Figure 16: Europe Women's Activewear Market Volume (K Units), by Product Type 2025 & 2033
- Figure 17: Europe Women's Activewear Market Revenue Share (%), by Product Type 2025 & 2033
- Figure 18: Europe Women's Activewear Market Volume Share (%), by Product Type 2025 & 2033
- Figure 19: Europe Women's Activewear Market Revenue (billion), by Distribution Channel 2025 & 2033
- Figure 20: Europe Women's Activewear Market Volume (K Units), by Distribution Channel 2025 & 2033
- Figure 21: Europe Women's Activewear Market Revenue Share (%), by Distribution Channel 2025 & 2033
- Figure 22: Europe Women's Activewear Market Volume Share (%), by Distribution Channel 2025 & 2033
- Figure 23: Europe Women's Activewear Market Revenue (billion), by Country 2025 & 2033
- Figure 24: Europe Women's Activewear Market Volume (K Units), by Country 2025 & 2033
- Figure 25: Europe Women's Activewear Market Revenue Share (%), by Country 2025 & 2033
- Figure 26: Europe Women's Activewear Market Volume Share (%), by Country 2025 & 2033
- Figure 27: Asia Pacific Women's Activewear Market Revenue (billion), by Product Type 2025 & 2033
- Figure 28: Asia Pacific Women's Activewear Market Volume (K Units), by Product Type 2025 & 2033
- Figure 29: Asia Pacific Women's Activewear Market Revenue Share (%), by Product Type 2025 & 2033
- Figure 30: Asia Pacific Women's Activewear Market Volume Share (%), by Product Type 2025 & 2033
- Figure 31: Asia Pacific Women's Activewear Market Revenue (billion), by Distribution Channel 2025 & 2033
- Figure 32: Asia Pacific Women's Activewear Market Volume (K Units), by Distribution Channel 2025 & 2033
- Figure 33: Asia Pacific Women's Activewear Market Revenue Share (%), by Distribution Channel 2025 & 2033
- Figure 34: Asia Pacific Women's Activewear Market Volume Share (%), by Distribution Channel 2025 & 2033
- Figure 35: Asia Pacific Women's Activewear Market Revenue (billion), by Country 2025 & 2033
- Figure 36: Asia Pacific Women's Activewear Market Volume (K Units), by Country 2025 & 2033
- Figure 37: Asia Pacific Women's Activewear Market Revenue Share (%), by Country 2025 & 2033
- Figure 38: Asia Pacific Women's Activewear Market Volume Share (%), by Country 2025 & 2033
- Figure 39: South America Women's Activewear Market Revenue (billion), by Product Type 2025 & 2033
- Figure 40: South America Women's Activewear Market Volume (K Units), by Product Type 2025 & 2033
- Figure 41: South America Women's Activewear Market Revenue Share (%), by Product Type 2025 & 2033
- Figure 42: South America Women's Activewear Market Volume Share (%), by Product Type 2025 & 2033
- Figure 43: South America Women's Activewear Market Revenue (billion), by Distribution Channel 2025 & 2033
- Figure 44: South America Women's Activewear Market Volume (K Units), by Distribution Channel 2025 & 2033
- Figure 45: South America Women's Activewear Market Revenue Share (%), by Distribution Channel 2025 & 2033
- Figure 46: South America Women's Activewear Market Volume Share (%), by Distribution Channel 2025 & 2033
- Figure 47: South America Women's Activewear Market Revenue (billion), by Country 2025 & 2033
- Figure 48: South America Women's Activewear Market Volume (K Units), by Country 2025 & 2033
- Figure 49: South America Women's Activewear Market Revenue Share (%), by Country 2025 & 2033
- Figure 50: South America Women's Activewear Market Volume Share (%), by Country 2025 & 2033
- Figure 51: Middle East and Africa Women's Activewear Market Revenue (billion), by Product Type 2025 & 2033
- Figure 52: Middle East and Africa Women's Activewear Market Volume (K Units), by Product Type 2025 & 2033
- Figure 53: Middle East and Africa Women's Activewear Market Revenue Share (%), by Product Type 2025 & 2033
- Figure 54: Middle East and Africa Women's Activewear Market Volume Share (%), by Product Type 2025 & 2033
- Figure 55: Middle East and Africa Women's Activewear Market Revenue (billion), by Distribution Channel 2025 & 2033
- Figure 56: Middle East and Africa Women's Activewear Market Volume (K Units), by Distribution Channel 2025 & 2033
- Figure 57: Middle East and Africa Women's Activewear Market Revenue Share (%), by Distribution Channel 2025 & 2033
- Figure 58: Middle East and Africa Women's Activewear Market Volume Share (%), by Distribution Channel 2025 & 2033
- Figure 59: Middle East and Africa Women's Activewear Market Revenue (billion), by Country 2025 & 2033
- Figure 60: Middle East and Africa Women's Activewear Market Volume (K Units), by Country 2025 & 2033
- Figure 61: Middle East and Africa Women's Activewear Market Revenue Share (%), by Country 2025 & 2033
- Figure 62: Middle East and Africa Women's Activewear Market Volume Share (%), by Country 2025 & 2033
List of Tables
- Table 1: Global Women's Activewear Market Revenue billion Forecast, by Product Type 2020 & 2033
- Table 2: Global Women's Activewear Market Volume K Units Forecast, by Product Type 2020 & 2033
- Table 3: Global Women's Activewear Market Revenue billion Forecast, by Distribution Channel 2020 & 2033
- Table 4: Global Women's Activewear Market Volume K Units Forecast, by Distribution Channel 2020 & 2033
- Table 5: Global Women's Activewear Market Revenue billion Forecast, by Region 2020 & 2033
- Table 6: Global Women's Activewear Market Volume K Units Forecast, by Region 2020 & 2033
- Table 7: Global Women's Activewear Market Revenue billion Forecast, by Product Type 2020 & 2033
- Table 8: Global Women's Activewear Market Volume K Units Forecast, by Product Type 2020 & 2033
- Table 9: Global Women's Activewear Market Revenue billion Forecast, by Distribution Channel 2020 & 2033
- Table 10: Global Women's Activewear Market Volume K Units Forecast, by Distribution Channel 2020 & 2033
- Table 11: Global Women's Activewear Market Revenue billion Forecast, by Country 2020 & 2033
- Table 12: Global Women's Activewear Market Volume K Units Forecast, by Country 2020 & 2033
- Table 13: United States Women's Activewear Market Revenue (billion) Forecast, by Application 2020 & 2033
- Table 14: United States Women's Activewear Market Volume (K Units) Forecast, by Application 2020 & 2033
- Table 15: Canada Women's Activewear Market Revenue (billion) Forecast, by Application 2020 & 2033
- Table 16: Canada Women's Activewear Market Volume (K Units) Forecast, by Application 2020 & 2033
- Table 17: Mexico Women's Activewear Market Revenue (billion) Forecast, by Application 2020 & 2033
- Table 18: Mexico Women's Activewear Market Volume (K Units) Forecast, by Application 2020 & 2033
- Table 19: Rest of North America Women's Activewear Market Revenue (billion) Forecast, by Application 2020 & 2033
- Table 20: Rest of North America Women's Activewear Market Volume (K Units) Forecast, by Application 2020 & 2033
- Table 21: Global Women's Activewear Market Revenue billion Forecast, by Product Type 2020 & 2033
- Table 22: Global Women's Activewear Market Volume K Units Forecast, by Product Type 2020 & 2033
- Table 23: Global Women's Activewear Market Revenue billion Forecast, by Distribution Channel 2020 & 2033
- Table 24: Global Women's Activewear Market Volume K Units Forecast, by Distribution Channel 2020 & 2033
- Table 25: Global Women's Activewear Market Revenue billion Forecast, by Country 2020 & 2033
- Table 26: Global Women's Activewear Market Volume K Units Forecast, by Country 2020 & 2033
- Table 27: Spain Women's Activewear Market Revenue (billion) Forecast, by Application 2020 & 2033
- Table 28: Spain Women's Activewear Market Volume (K Units) Forecast, by Application 2020 & 2033
- Table 29: United Kingdom Women's Activewear Market Revenue (billion) Forecast, by Application 2020 & 2033
- Table 30: United Kingdom Women's Activewear Market Volume (K Units) Forecast, by Application 2020 & 2033
- Table 31: Germany Women's Activewear Market Revenue (billion) Forecast, by Application 2020 & 2033
- Table 32: Germany Women's Activewear Market Volume (K Units) Forecast, by Application 2020 & 2033
- Table 33: France Women's Activewear Market Revenue (billion) Forecast, by Application 2020 & 2033
- Table 34: France Women's Activewear Market Volume (K Units) Forecast, by Application 2020 & 2033
- Table 35: Italy Women's Activewear Market Revenue (billion) Forecast, by Application 2020 & 2033
- Table 36: Italy Women's Activewear Market Volume (K Units) Forecast, by Application 2020 & 2033
- Table 37: Russia Women's Activewear Market Revenue (billion) Forecast, by Application 2020 & 2033
- Table 38: Russia Women's Activewear Market Volume (K Units) Forecast, by Application 2020 & 2033
- Table 39: Rest of Europe Women's Activewear Market Revenue (billion) Forecast, by Application 2020 & 2033
- Table 40: Rest of Europe Women's Activewear Market Volume (K Units) Forecast, by Application 2020 & 2033
- Table 41: Global Women's Activewear Market Revenue billion Forecast, by Product Type 2020 & 2033
- Table 42: Global Women's Activewear Market Volume K Units Forecast, by Product Type 2020 & 2033
- Table 43: Global Women's Activewear Market Revenue billion Forecast, by Distribution Channel 2020 & 2033
- Table 44: Global Women's Activewear Market Volume K Units Forecast, by Distribution Channel 2020 & 2033
- Table 45: Global Women's Activewear Market Revenue billion Forecast, by Country 2020 & 2033
- Table 46: Global Women's Activewear Market Volume K Units Forecast, by Country 2020 & 2033
- Table 47: China Women's Activewear Market Revenue (billion) Forecast, by Application 2020 & 2033
- Table 48: China Women's Activewear Market Volume (K Units) Forecast, by Application 2020 & 2033
- Table 49: Japan Women's Activewear Market Revenue (billion) Forecast, by Application 2020 & 2033
- Table 50: Japan Women's Activewear Market Volume (K Units) Forecast, by Application 2020 & 2033
- Table 51: India Women's Activewear Market Revenue (billion) Forecast, by Application 2020 & 2033
- Table 52: India Women's Activewear Market Volume (K Units) Forecast, by Application 2020 & 2033
- Table 53: Australia Women's Activewear Market Revenue (billion) Forecast, by Application 2020 & 2033
- Table 54: Australia Women's Activewear Market Volume (K Units) Forecast, by Application 2020 & 2033
- Table 55: Rest of Asia Pacific Women's Activewear Market Revenue (billion) Forecast, by Application 2020 & 2033
- Table 56: Rest of Asia Pacific Women's Activewear Market Volume (K Units) Forecast, by Application 2020 & 2033
- Table 57: Global Women's Activewear Market Revenue billion Forecast, by Product Type 2020 & 2033
- Table 58: Global Women's Activewear Market Volume K Units Forecast, by Product Type 2020 & 2033
- Table 59: Global Women's Activewear Market Revenue billion Forecast, by Distribution Channel 2020 & 2033
- Table 60: Global Women's Activewear Market Volume K Units Forecast, by Distribution Channel 2020 & 2033
- Table 61: Global Women's Activewear Market Revenue billion Forecast, by Country 2020 & 2033
- Table 62: Global Women's Activewear Market Volume K Units Forecast, by Country 2020 & 2033
- Table 63: Brazil Women's Activewear Market Revenue (billion) Forecast, by Application 2020 & 2033
- Table 64: Brazil Women's Activewear Market Volume (K Units) Forecast, by Application 2020 & 2033
- Table 65: Argentina Women's Activewear Market Revenue (billion) Forecast, by Application 2020 & 2033
- Table 66: Argentina Women's Activewear Market Volume (K Units) Forecast, by Application 2020 & 2033
- Table 67: Rest of South America Women's Activewear Market Revenue (billion) Forecast, by Application 2020 & 2033
- Table 68: Rest of South America Women's Activewear Market Volume (K Units) Forecast, by Application 2020 & 2033
- Table 69: Global Women's Activewear Market Revenue billion Forecast, by Product Type 2020 & 2033
- Table 70: Global Women's Activewear Market Volume K Units Forecast, by Product Type 2020 & 2033
- Table 71: Global Women's Activewear Market Revenue billion Forecast, by Distribution Channel 2020 & 2033
- Table 72: Global Women's Activewear Market Volume K Units Forecast, by Distribution Channel 2020 & 2033
- Table 73: Global Women's Activewear Market Revenue billion Forecast, by Country 2020 & 2033
- Table 74: Global Women's Activewear Market Volume K Units Forecast, by Country 2020 & 2033
- Table 75: South Africa Women's Activewear Market Revenue (billion) Forecast, by Application 2020 & 2033
- Table 76: South Africa Women's Activewear Market Volume (K Units) Forecast, by Application 2020 & 2033
- Table 77: Saudi Arabia Women's Activewear Market Revenue (billion) Forecast, by Application 2020 & 2033
- Table 78: Saudi Arabia Women's Activewear Market Volume (K Units) Forecast, by Application 2020 & 2033
- Table 79: Rest of Middle East and Africa Women's Activewear Market Revenue (billion) Forecast, by Application 2020 & 2033
- Table 80: Rest of Middle East and Africa Women's Activewear Market Volume (K Units) Forecast, by Application 2020 & 2033
Frequently Asked Questions
1. What is the projected Compound Annual Growth Rate (CAGR) of the Women's Activewear Market?
The projected CAGR is approximately 9%.
2. Which companies are prominent players in the Women's Activewear Market?
Key companies in the market include Gap Inc, Adidas AG, NIKE Inc, Jockey*List Not Exhaustive, The Columbia Sportswear Company, PUMA SE, Decathlon, Amante, Mizuno USA, Under Armour Inc, VIE ACTIVE.
3. What are the main segments of the Women's Activewear Market?
The market segments include Product Type, Distribution Channel.
4. Can you provide details about the market size?
The market size is estimated to be USD 440.39 billion as of 2022.
5. What are some drivers contributing to market growth?
Increase in Sports Participation; Trend of Athleisure.
6. What are the notable trends driving market growth?
Growing Influence of Athleisure and Healthy Lifestyle Trends.
7. Are there any restraints impacting market growth?
Availability of Fake and Counterfeit Products.
8. Can you provide examples of recent developments in the market?
Aug 2022: Fashion retailer H&M launched a new activewear line worldwide called H&M Move on and claimed that it would showcase a more accessible vision of sport by reframing it as a movement. H&M claimed that its Move line offers a wide range of affordable apparel, and the first drop, 'Move Essentials,' included functional tops, lightweight jackets, tights, and bras, alongside items specifically designed to train and run, as well as outerwear and a yoga mat.
9. What pricing options are available for accessing the report?
Pricing options include single-user, multi-user, and enterprise licenses priced at USD 4750, USD 5250, and USD 8750 respectively.
10. Is the market size provided in terms of value or volume?
The market size is provided in terms of value, measured in billion and volume, measured in K Units.
11. Are there any specific market keywords associated with the report?
Yes, the market keyword associated with the report is "Women's Activewear Market," which aids in identifying and referencing the specific market segment covered.
12. How do I determine which pricing option suits my needs best?
The pricing options vary based on user requirements and access needs. Individual users may opt for single-user licenses, while businesses requiring broader access may choose multi-user or enterprise licenses for cost-effective access to the report.
13. Are there any additional resources or data provided in the Women's Activewear Market report?
While the report offers comprehensive insights, it's advisable to review the specific contents or supplementary materials provided to ascertain if additional resources or data are available.
14. How can I stay updated on further developments or reports in the Women's Activewear Market?
To stay informed about further developments, trends, and reports in the Women's Activewear Market, consider subscribing to industry newsletters, following relevant companies and organizations, or regularly checking reputable industry news sources and publications.
Methodology
Step 1 - Identification of Relevant Samples Size from Population Database


Step 2 - Approaches for Defining Global Market Size (Value, Volume* & Price*)

Note*: In applicable scenarios
Step 3 - Data Sources
Primary Research
- Web Analytics
- Survey Reports
- Research Institute
- Latest Research Reports
- Opinion Leaders
Secondary Research
- Annual Reports
- White Paper
- Latest Press Release
- Industry Association
- Paid Database
- Investor Presentations

Step 4 - Data Triangulation
Involves using different sources of information in order to increase the validity of a study
These sources are likely to be stakeholders in a program - participants, other researchers, program staff, other community members, and so on.
Then we put all data in single framework & apply various statistical tools to find out the dynamic on the market.
During the analysis stage, feedback from the stakeholder groups would be compared to determine areas of agreement as well as areas of divergence