

Key Insights
The global X-ray machine manufacturing industry is poised for substantial growth, with an estimated market size of 17.70 Million units in 2025 and projected to expand at a robust Compound Annual Growth Rate (CAGR) of 5.69% through 2033. This upward trajectory is primarily fueled by increasing healthcare expenditures worldwide, a growing demand for advanced diagnostic imaging solutions, and the continuous innovation in X-ray technology. The rising prevalence of chronic diseases and an aging global population further augment the need for accurate and timely diagnosis, directly impacting the market for X-ray machines. Furthermore, the integration of digital technologies, such as Artificial Intelligence (AI) and machine learning, is revolutionizing X-ray imaging, enabling enhanced image quality, faster processing, and improved diagnostic accuracy. This technological advancement is a significant driver, encouraging both new installations and upgrades of existing equipment. The expanding healthcare infrastructure, particularly in emerging economies, and the increasing focus on preventive healthcare are also contributing to the sustained demand for X-ray devices.
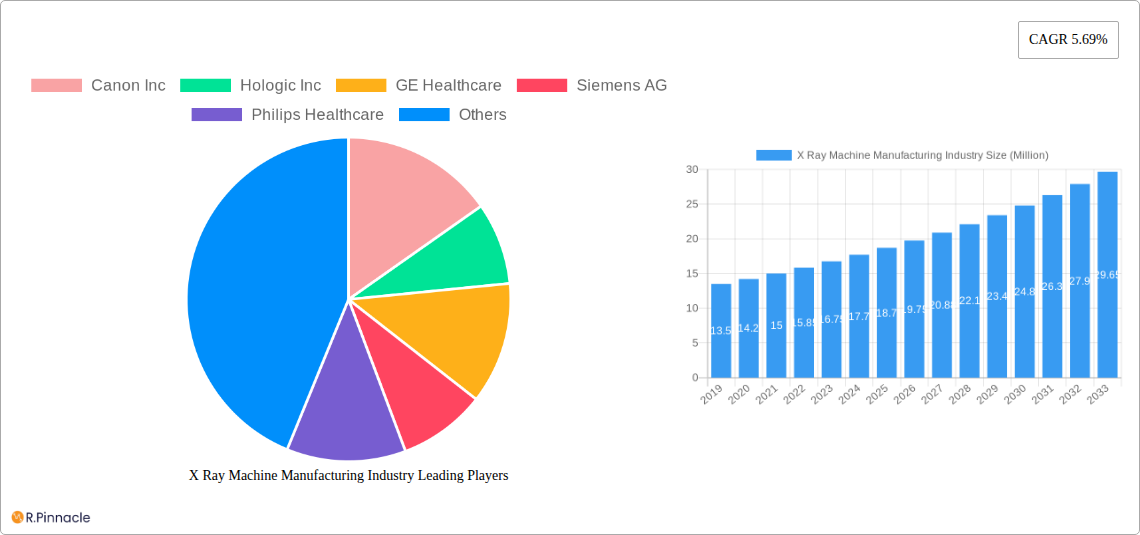
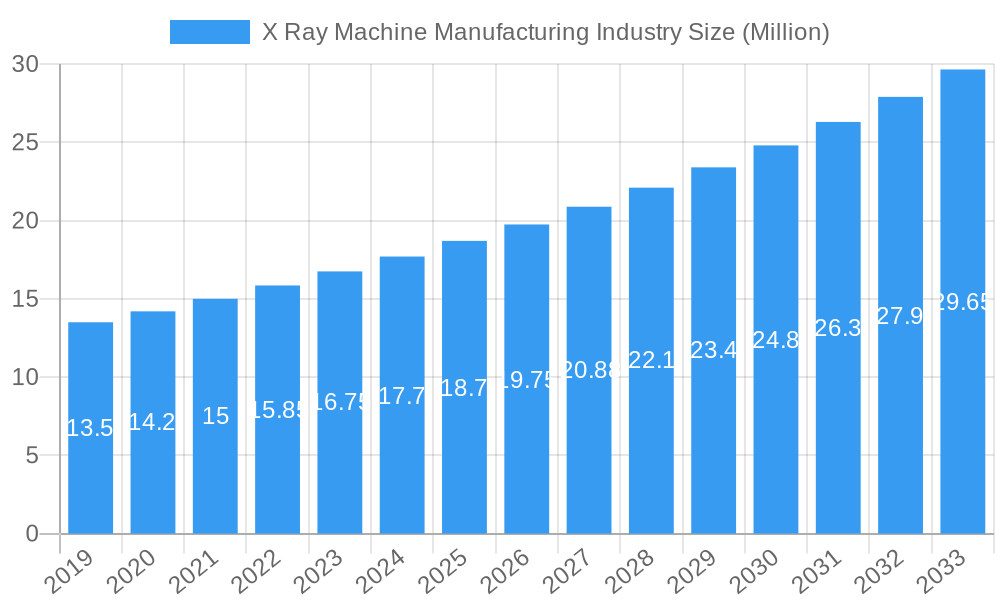
X Ray Machine Manufacturing Industry Market Size (In Million)
The market segmentation reveals a dynamic landscape, with the Portable segment expected to witness accelerated growth due to its versatility in various healthcare settings, including emergency rooms, remote areas, and point-of-care diagnostics. In terms of technology, the Digital X-ray segment is dominating and will continue to do so, driven by its superior image resolution, reduced radiation exposure, and efficient workflow compared to traditional analog systems. Key end-user industries such as Healthcare will remain the largest consumers, followed by Transportation and Logistics for cargo scanning and Government for defense and security applications. While the market benefits from these drivers, it also faces certain restraints. The high initial cost of advanced X-ray systems and stringent regulatory approvals can pose challenges. However, the growing emphasis on patient safety, reduction in radiation doses, and the development of more cost-effective portable solutions are mitigating these concerns. The competitive landscape is characterized by the presence of major global players, all vying for market share through product innovation, strategic partnerships, and geographical expansion.
X Ray Machine Manufacturing Industry Company Market Share
This comprehensive report delivers unparalleled insights into the global X-ray machine manufacturing industry, a critical sector driving advancements in healthcare, security, and industrial inspection. Dive deep into market dynamics, innovation trends, and future projections from 2019 to 2033, with a detailed analysis of the base year 2025. This report is your definitive guide to understanding the competitive landscape, technological evolution, and growth accelerators shaping the X-ray device market.
X Ray Machine Manufacturing Industry Market Structure & Innovation Trends
The X-ray machine manufacturing industry exhibits a moderately concentrated market structure, with a few dominant global players holding significant market share, alongside a growing number of regional and specialized manufacturers. Innovation is a paramount driver, fueled by the relentless pursuit of enhanced image quality, reduced radiation exposure, and improved workflow efficiency. Key innovation areas include the transition from analog to digital radiography, the development of portable and AI-integrated systems, and miniaturization for niche applications. Regulatory frameworks, spearheaded by bodies like the FDA and EMA, play a crucial role in ensuring product safety and efficacy, impacting product development timelines and market entry. Product substitutes, such as MRI and CT scanners, are present but often cater to different diagnostic needs, creating a complementary rather than directly competitive relationship. End-user demographics are increasingly sophisticated, demanding cost-effective, high-performance solutions. Merger and acquisition (M&A) activities remain strategic, with larger corporations acquiring innovative startups to bolster their product portfolios and expand market reach. For instance, estimated M&A deal values in the medical imaging sector have ranged from tens of millions to billions of US Dollars annually in recent years.
X Ray Machine Manufacturing Industry Market Dynamics & Trends
The global X-ray machine manufacturing industry is poised for robust growth, driven by a confluence of factors. The CAGR for the forecast period 2025-2033 is projected to be in the range of 5.5% to 7.0%, reaching an estimated market value exceeding $20 Billion by 2033. This growth is underpinned by the increasing global demand for diagnostic imaging services, particularly in emerging economies with expanding healthcare infrastructure and rising disposable incomes. Technological disruptions are revolutionizing the sector, with the widespread adoption of digital radiography (DR) systems significantly enhancing diagnostic accuracy and workflow efficiency compared to traditional analog systems. The integration of Artificial Intelligence (AI) in X-ray analysis is another transformative trend, enabling faster and more precise diagnoses, reducing radiologist workload, and improving patient outcomes. Consumer preferences are shifting towards non-invasive, rapid, and portable imaging solutions, driving the demand for advanced portable X-ray machines. Competitive dynamics are intensifying, with companies investing heavily in R&D to develop next-generation X-ray technologies. Market penetration of advanced X-ray systems is steadily increasing across healthcare facilities, from large hospitals to small clinics. The rising prevalence of chronic diseases, the aging global population, and the increasing focus on early disease detection are all contributing significantly to market expansion. Furthermore, government initiatives aimed at improving healthcare access and quality are providing further impetus to the X-ray equipment market.
Dominant Regions & Segments in X Ray Machine Manufacturing Industry
North America currently dominates the X-ray machine manufacturing industry, largely due to its advanced healthcare infrastructure, high per capita healthcare spending, and strong emphasis on technological innovation. The United States, in particular, is a powerhouse in terms of both manufacturing and adoption of cutting-edge X-ray technology, driven by substantial investments in medical research and development.
- Leading Region: North America (specifically the USA and Canada)
- Key Drivers: High healthcare expenditure, well-established reimbursement policies for diagnostic imaging, presence of leading R&D institutions and manufacturers, and a proactive approach to adopting new medical technologies.
- Dominant Product Type: Stationary X-ray machines continue to hold the largest market share due to their widespread use in hospitals and diagnostic centers for general radiography, mammography, and specialized imaging. However, the Portable segment is experiencing significant growth, driven by demand in emergency medicine, remote healthcare, and veterinary applications.
- Key Drivers for Stationary: High throughput needs in hospitals, advanced imaging capabilities, and comprehensive diagnostic applications.
- Key Drivers for Portable: Increased demand in point-of-care diagnostics, emergency response, and veterinary medicine, alongside advancements in battery technology and image quality.
- Dominant Technology: Digital X-ray technology is rapidly eclipsing analog systems, offering superior image quality, reduced radiation dose, and immediate image availability, thus enhancing diagnostic efficiency.
- Key Drivers: Improved diagnostic accuracy, faster workflow, reduced consumable costs, and better integration with PACS (Picture Archiving and Communication Systems).
- Dominant End-user: The Healthcare sector is unequivocally the largest end-user segment for X-ray machines, encompassing hospitals, clinics, diagnostic imaging centers, and specialized medical facilities.
- Key Drivers: Increasing patient volumes, rising prevalence of diseases requiring diagnostic imaging, government healthcare reforms, and the continuous need for accurate disease diagnosis and monitoring.
- Other Significant Segments: The Government sector utilizes X-ray machines for defense, security (e.g., baggage screening), and public health initiatives. The Transportation and Logistics sector employs X-ray technology primarily for cargo and baggage inspection at airports and ports.
X Ray Machine Manufacturing Industry Product Innovations
The X-ray manufacturing industry is witnessing a rapid evolution in product design and functionality. Innovations are focused on miniaturization, portability, and enhanced imaging capabilities, with a strong emphasis on reducing radiation exposure for both patients and operators. AI-powered image analysis is a significant development, enabling faster and more accurate diagnoses, detecting subtle abnormalities, and improving workflow for radiologists. The introduction of advanced detector technologies, such as flat-panel detectors, has significantly improved image resolution and speed. Furthermore, the integration of wireless connectivity and mobile X-ray solutions is enhancing accessibility and patient comfort, particularly in critical care and remote settings. These product innovations are crucial for maintaining competitive advantage and meeting the evolving demands of the healthcare and industrial sectors.
Report Scope & Segmentation Analysis
This report provides an in-depth analysis of the X-ray machine manufacturing industry, segmented across key parameters.
- Product Type: The Stationary X-ray machine market is projected to maintain its leading position, driven by extensive use in hospitals for general radiography and specialized applications. The Portable X-ray machine market is expected to exhibit a higher growth rate, fueled by demand in emergency services and remote healthcare.
- Technology: The Digital X-ray market is anticipated to dominate, with its superior image quality, reduced radiation dose, and efficient workflow, leading to widespread adoption. The Analog X-ray market is expected to see a gradual decline.
- End-user: The Healthcare segment is the largest and fastest-growing end-user. The Government segment includes applications in defense, security, and public health. The Transportation and Logistics segment primarily utilizes X-ray for security screening. Other End-users encompass industrial inspection and research applications.
Key Drivers of X Ray Machine Manufacturing Industry Growth
Several key factors are propelling the growth of the X-ray machine manufacturing industry. The increasing global burden of diseases, including cancer, cardiovascular ailments, and orthopedic disorders, necessitates advanced diagnostic imaging techniques like X-rays. Technological advancements, particularly the shift towards digital radiography and the integration of AI, are enhancing diagnostic accuracy and efficiency, driving market demand. An aging global population further escalates the need for diagnostic imaging services. Furthermore, expanding healthcare infrastructure, especially in emerging economies, coupled with government initiatives to improve healthcare access and quality, are significant growth accelerators. The continuous innovation in portable and miniaturized X-ray systems is also opening new avenues for market expansion.
Challenges in the X Ray Machine Manufacturing Industry Sector
Despite robust growth prospects, the X-ray machine manufacturing industry faces several challenges. Stringent regulatory approvals and compliance requirements across different regions can prolong product launch timelines and increase development costs. The high cost of advanced X-ray systems can be a barrier to adoption, particularly for smaller healthcare providers and in developing nations. Intense competition among established players and emerging manufacturers can lead to price pressures. Supply chain disruptions, as witnessed in recent years, can impact production and lead times. Furthermore, the need for continuous investment in R&D to keep pace with technological advancements poses a significant financial challenge for many companies.
Emerging Opportunities in X Ray Machine Manufacturing Industry
The X-ray machine manufacturing industry is ripe with emerging opportunities. The growing demand for AI-powered diagnostic solutions presents a significant growth avenue, enabling enhanced image analysis and predictive diagnostics. The development of low-dose X-ray technologies addresses growing concerns about radiation safety. The expanding use of X-ray machines in non-healthcare sectors, such as industrial inspection and security screening, offers new market potential. Furthermore, the increasing adoption of advanced imaging in veterinary medicine and specialized medical fields like dentistry creates niche market opportunities. The trend towards telemedicine and remote patient monitoring also presents opportunities for the development of connected and portable X-ray solutions.
Leading Players in the X Ray Machine Manufacturing Industry Market
- Canon Inc.
- Hologic Inc.
- GE Healthcare
- Siemens AG
- Philips Healthcare
- Hindrays
- Hitachi Medical Corporation
- Vision Medicaid Equipment Private Limited
- Shimadzu Corporation
- Fujifilm Holdings Corporation
Key Developments in X Ray Machine Manufacturing Industry Industry
- November 2022: Konica Minolta Healthcare Americas, Inc. introduced groundbreaking digital radiography (DR) technologies designed to revolutionize the clinical utility of X-rays.
- August 2022: GE Healthcare unveiled its latest fixed X-ray equipment, the next-generation Definium 656 HD, equipped with in-room workflows, motorization, and the Intelligent Workflow Suite. This system aims to act as a "personal assistant" for radiology departments, assisting technologists with patient positioning and method selection, thereby enhancing productivity and reducing physical demands. Radiologists benefit from improved image clarity, reduced errors, and minimized variability through the integration of FlashPad detectors, sophisticated picture generation apps, and AI-driven helix advanced image processing software.
Future Outlook for X Ray Machine Manufacturing Industry Market
The future outlook for the X-ray machine manufacturing industry is exceptionally bright, driven by an increasing demand for advanced diagnostic imaging solutions and continuous technological innovation. The pervasive integration of AI and machine learning will redefine diagnostic workflows, leading to more accurate and efficient patient care. The development of ultra-portable and low-dose X-ray devices will expand accessibility in remote areas and critical care settings. Furthermore, the growing emphasis on preventive healthcare and early disease detection will continue to fuel the market. Strategic collaborations and acquisitions are expected to consolidate the market, fostering innovation and expanding global reach. The industry is poised to play an even more critical role in global health outcomes, security, and industrial advancements.
X Ray Machine Manufacturing Industry Segmentation
-
1. Product Type
- 1.1. Stationary
- 1.2. Portable
-
2. Technology
- 2.1. Analog
- 2.2. Digital
-
3. End-user
- 3.1. Healthcare
- 3.2. Transportation and Logistics
- 3.3. Government
- 3.4. Other End-users
X Ray Machine Manufacturing Industry Segmentation By Geography
-
1. North America
- 1.1. United States
- 1.2. Canada
-
2. Europe
- 2.1. United Kingdom
- 2.2. Germany
- 2.3. France
-
3. Asia
- 3.1. China
- 3.2. Japan
- 3.3. India
- 3.4. South Korea
- 4. Latin America
- 5. Middle East and Africa
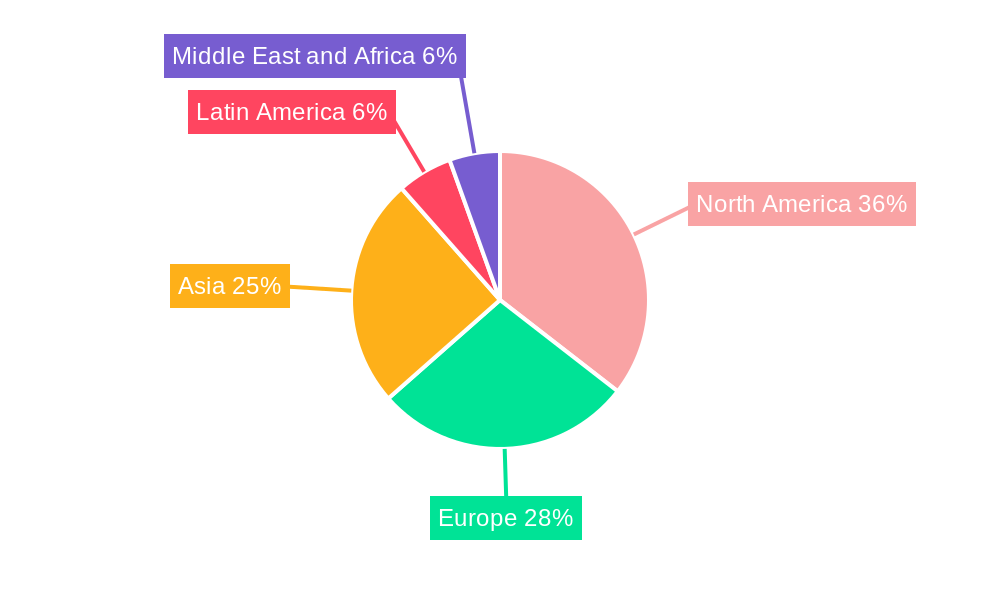
X Ray Machine Manufacturing Industry Regional Market Share
Geographic Coverage of X Ray Machine Manufacturing Industry
X Ray Machine Manufacturing Industry REPORT HIGHLIGHTS
| Aspects | Details |
|---|---|
| Study Period | 2020-2034 |
| Base Year | 2025 |
| Estimated Year | 2026 |
| Forecast Period | 2026-2034 |
| Historical Period | 2020-2025 |
| Growth Rate | CAGR of 5.69% from 2020-2034 |
| Segmentation |
|
Table of Contents
- 1. Introduction
- 1.1. Research Scope
- 1.2. Market Segmentation
- 1.3. Research Objective
- 1.4. Definitions and Assumptions
- 2. Executive Summary
- 2.1. Market Snapshot
- 3. Market Dynamics
- 3.1. Market Drivers
- 3.2. Market Restrains
- 3.3. Market Trends
- 3.4. Market Opportunities
- 4. Market Factor Analysis
- 4.1. Porters Five Forces
- 4.1.1. Bargaining Power of Suppliers
- 4.1.2. Bargaining Power of Buyers
- 4.1.3. Threat of New Entrants
- 4.1.4. Threat of Substitutes
- 4.1.5. Competitive Rivalry
- 4.2. PESTEL analysis
- 4.3. BCG Analysis
- 4.3.1. Stars (High Growth, High Market Share)
- 4.3.2. Cash Cows (Low Growth, High Market Share)
- 4.3.3. Question Mark (High Growth, Low Market Share)
- 4.3.4. Dogs (Low Growth, Low Market Share)
- 4.4. Ansoff Matrix Analysis
- 4.5. Supply Chain Analysis
- 4.6. Regulatory Landscape
- 4.7. Current Market Potential and Opportunity Assessment (TAM–SAM–SOM Framework)
- 4.8. PRI Analyst Note
- 4.1. Porters Five Forces
- 5. Market Analysis, Insights and Forecast 2021-2033
- 5.1. Market Analysis, Insights and Forecast - by Product Type
- 5.1.1. Stationary
- 5.1.2. Portable
- 5.2. Market Analysis, Insights and Forecast - by Technology
- 5.2.1. Analog
- 5.2.2. Digital
- 5.3. Market Analysis, Insights and Forecast - by End-user
- 5.3.1. Healthcare
- 5.3.2. Transportation and Logistics
- 5.3.3. Government
- 5.3.4. Other End-users
- 5.4. Market Analysis, Insights and Forecast - by Region
- 5.4.1. North America
- 5.4.2. Europe
- 5.4.3. Asia
- 5.4.4. Latin America
- 5.4.5. Middle East and Africa
- 5.1. Market Analysis, Insights and Forecast - by Product Type
- 6. Global X Ray Machine Manufacturing Industry Analysis, Insights and Forecast, 2021-2033
- 6.1. Market Analysis, Insights and Forecast - by Product Type
- 6.1.1. Stationary
- 6.1.2. Portable
- 6.2. Market Analysis, Insights and Forecast - by Technology
- 6.2.1. Analog
- 6.2.2. Digital
- 6.3. Market Analysis, Insights and Forecast - by End-user
- 6.3.1. Healthcare
- 6.3.2. Transportation and Logistics
- 6.3.3. Government
- 6.3.4. Other End-users
- 6.1. Market Analysis, Insights and Forecast - by Product Type
- 7. North America X Ray Machine Manufacturing Industry Analysis, Insights and Forecast, 2020-2032
- 7.1. Market Analysis, Insights and Forecast - by Product Type
- 7.1.1. Stationary
- 7.1.2. Portable
- 7.2. Market Analysis, Insights and Forecast - by Technology
- 7.2.1. Analog
- 7.2.2. Digital
- 7.3. Market Analysis, Insights and Forecast - by End-user
- 7.3.1. Healthcare
- 7.3.2. Transportation and Logistics
- 7.3.3. Government
- 7.3.4. Other End-users
- 7.1. Market Analysis, Insights and Forecast - by Product Type
- 8. Europe X Ray Machine Manufacturing Industry Analysis, Insights and Forecast, 2020-2032
- 8.1. Market Analysis, Insights and Forecast - by Product Type
- 8.1.1. Stationary
- 8.1.2. Portable
- 8.2. Market Analysis, Insights and Forecast - by Technology
- 8.2.1. Analog
- 8.2.2. Digital
- 8.3. Market Analysis, Insights and Forecast - by End-user
- 8.3.1. Healthcare
- 8.3.2. Transportation and Logistics
- 8.3.3. Government
- 8.3.4. Other End-users
- 8.1. Market Analysis, Insights and Forecast - by Product Type
- 9. Asia X Ray Machine Manufacturing Industry Analysis, Insights and Forecast, 2020-2032
- 9.1. Market Analysis, Insights and Forecast - by Product Type
- 9.1.1. Stationary
- 9.1.2. Portable
- 9.2. Market Analysis, Insights and Forecast - by Technology
- 9.2.1. Analog
- 9.2.2. Digital
- 9.3. Market Analysis, Insights and Forecast - by End-user
- 9.3.1. Healthcare
- 9.3.2. Transportation and Logistics
- 9.3.3. Government
- 9.3.4. Other End-users
- 9.1. Market Analysis, Insights and Forecast - by Product Type
- 10. Latin America X Ray Machine Manufacturing Industry Analysis, Insights and Forecast, 2020-2032
- 10.1. Market Analysis, Insights and Forecast - by Product Type
- 10.1.1. Stationary
- 10.1.2. Portable
- 10.2. Market Analysis, Insights and Forecast - by Technology
- 10.2.1. Analog
- 10.2.2. Digital
- 10.3. Market Analysis, Insights and Forecast - by End-user
- 10.3.1. Healthcare
- 10.3.2. Transportation and Logistics
- 10.3.3. Government
- 10.3.4. Other End-users
- 10.1. Market Analysis, Insights and Forecast - by Product Type
- 11. Middle East and Africa X Ray Machine Manufacturing Industry Analysis, Insights and Forecast, 2020-2032
- 11.1. Market Analysis, Insights and Forecast - by Product Type
- 11.1.1. Stationary
- 11.1.2. Portable
- 11.2. Market Analysis, Insights and Forecast - by Technology
- 11.2.1. Analog
- 11.2.2. Digital
- 11.3. Market Analysis, Insights and Forecast - by End-user
- 11.3.1. Healthcare
- 11.3.2. Transportation and Logistics
- 11.3.3. Government
- 11.3.4. Other End-users
- 11.1. Market Analysis, Insights and Forecast - by Product Type
- 12. Competitive Analysis
- 12.1. Company Profiles
- 12.1.1 Canon Inc
- 12.1.1.1. Company Overview
- 12.1.1.2. Products
- 12.1.1.3. Company Financials
- 12.1.1.4. SWOT Analysis
- 12.1.2 Hologic Inc
- 12.1.2.1. Company Overview
- 12.1.2.2. Products
- 12.1.2.3. Company Financials
- 12.1.2.4. SWOT Analysis
- 12.1.3 GE Healthcare
- 12.1.3.1. Company Overview
- 12.1.3.2. Products
- 12.1.3.3. Company Financials
- 12.1.3.4. SWOT Analysis
- 12.1.4 Siemens AG
- 12.1.4.1. Company Overview
- 12.1.4.2. Products
- 12.1.4.3. Company Financials
- 12.1.4.4. SWOT Analysis
- 12.1.5 Philips Healthcare
- 12.1.5.1. Company Overview
- 12.1.5.2. Products
- 12.1.5.3. Company Financials
- 12.1.5.4. SWOT Analysis
- 12.1.6 Hindrays
- 12.1.6.1. Company Overview
- 12.1.6.2. Products
- 12.1.6.3. Company Financials
- 12.1.6.4. SWOT Analysis
- 12.1.7 Hitachi Medical Corporation
- 12.1.7.1. Company Overview
- 12.1.7.2. Products
- 12.1.7.3. Company Financials
- 12.1.7.4. SWOT Analysis
- 12.1.8 Vision Medicaid Equipment Private Limited
- 12.1.8.1. Company Overview
- 12.1.8.2. Products
- 12.1.8.3. Company Financials
- 12.1.8.4. SWOT Analysis
- 12.1.9 Shimadzu Corporation
- 12.1.9.1. Company Overview
- 12.1.9.2. Products
- 12.1.9.3. Company Financials
- 12.1.9.4. SWOT Analysis
- 12.1.10 Fujifilm Holdings Corporation
- 12.1.10.1. Company Overview
- 12.1.10.2. Products
- 12.1.10.3. Company Financials
- 12.1.10.4. SWOT Analysis
- 12.1.1 Canon Inc
- 12.2. Market Entropy
- 12.2.1 Company's Key Areas Served
- 12.2.2 Recent Developments
- 12.3. Company Market Share Analysis 2025
- 12.3.1 Top 5 Companies Market Share Analysis
- 12.3.2 Top 3 Companies Market Share Analysis
- 12.4. List of Potential Customers
- 13. Research Methodology
List of Figures
- Figure 1: Global X Ray Machine Manufacturing Industry Revenue Breakdown (Million, %) by Region 2025 & 2033
- Figure 2: Global X Ray Machine Manufacturing Industry Volume Breakdown (K Unit, %) by Region 2025 & 2033
- Figure 3: North America X Ray Machine Manufacturing Industry Revenue (Million), by Product Type 2025 & 2033
- Figure 4: North America X Ray Machine Manufacturing Industry Volume (K Unit), by Product Type 2025 & 2033
- Figure 5: North America X Ray Machine Manufacturing Industry Revenue Share (%), by Product Type 2025 & 2033
- Figure 6: North America X Ray Machine Manufacturing Industry Volume Share (%), by Product Type 2025 & 2033
- Figure 7: North America X Ray Machine Manufacturing Industry Revenue (Million), by Technology 2025 & 2033
- Figure 8: North America X Ray Machine Manufacturing Industry Volume (K Unit), by Technology 2025 & 2033
- Figure 9: North America X Ray Machine Manufacturing Industry Revenue Share (%), by Technology 2025 & 2033
- Figure 10: North America X Ray Machine Manufacturing Industry Volume Share (%), by Technology 2025 & 2033
- Figure 11: North America X Ray Machine Manufacturing Industry Revenue (Million), by End-user 2025 & 2033
- Figure 12: North America X Ray Machine Manufacturing Industry Volume (K Unit), by End-user 2025 & 2033
- Figure 13: North America X Ray Machine Manufacturing Industry Revenue Share (%), by End-user 2025 & 2033
- Figure 14: North America X Ray Machine Manufacturing Industry Volume Share (%), by End-user 2025 & 2033
- Figure 15: North America X Ray Machine Manufacturing Industry Revenue (Million), by Country 2025 & 2033
- Figure 16: North America X Ray Machine Manufacturing Industry Volume (K Unit), by Country 2025 & 2033
- Figure 17: North America X Ray Machine Manufacturing Industry Revenue Share (%), by Country 2025 & 2033
- Figure 18: North America X Ray Machine Manufacturing Industry Volume Share (%), by Country 2025 & 2033
- Figure 19: Europe X Ray Machine Manufacturing Industry Revenue (Million), by Product Type 2025 & 2033
- Figure 20: Europe X Ray Machine Manufacturing Industry Volume (K Unit), by Product Type 2025 & 2033
- Figure 21: Europe X Ray Machine Manufacturing Industry Revenue Share (%), by Product Type 2025 & 2033
- Figure 22: Europe X Ray Machine Manufacturing Industry Volume Share (%), by Product Type 2025 & 2033
- Figure 23: Europe X Ray Machine Manufacturing Industry Revenue (Million), by Technology 2025 & 2033
- Figure 24: Europe X Ray Machine Manufacturing Industry Volume (K Unit), by Technology 2025 & 2033
- Figure 25: Europe X Ray Machine Manufacturing Industry Revenue Share (%), by Technology 2025 & 2033
- Figure 26: Europe X Ray Machine Manufacturing Industry Volume Share (%), by Technology 2025 & 2033
- Figure 27: Europe X Ray Machine Manufacturing Industry Revenue (Million), by End-user 2025 & 2033
- Figure 28: Europe X Ray Machine Manufacturing Industry Volume (K Unit), by End-user 2025 & 2033
- Figure 29: Europe X Ray Machine Manufacturing Industry Revenue Share (%), by End-user 2025 & 2033
- Figure 30: Europe X Ray Machine Manufacturing Industry Volume Share (%), by End-user 2025 & 2033
- Figure 31: Europe X Ray Machine Manufacturing Industry Revenue (Million), by Country 2025 & 2033
- Figure 32: Europe X Ray Machine Manufacturing Industry Volume (K Unit), by Country 2025 & 2033
- Figure 33: Europe X Ray Machine Manufacturing Industry Revenue Share (%), by Country 2025 & 2033
- Figure 34: Europe X Ray Machine Manufacturing Industry Volume Share (%), by Country 2025 & 2033
- Figure 35: Asia X Ray Machine Manufacturing Industry Revenue (Million), by Product Type 2025 & 2033
- Figure 36: Asia X Ray Machine Manufacturing Industry Volume (K Unit), by Product Type 2025 & 2033
- Figure 37: Asia X Ray Machine Manufacturing Industry Revenue Share (%), by Product Type 2025 & 2033
- Figure 38: Asia X Ray Machine Manufacturing Industry Volume Share (%), by Product Type 2025 & 2033
- Figure 39: Asia X Ray Machine Manufacturing Industry Revenue (Million), by Technology 2025 & 2033
- Figure 40: Asia X Ray Machine Manufacturing Industry Volume (K Unit), by Technology 2025 & 2033
- Figure 41: Asia X Ray Machine Manufacturing Industry Revenue Share (%), by Technology 2025 & 2033
- Figure 42: Asia X Ray Machine Manufacturing Industry Volume Share (%), by Technology 2025 & 2033
- Figure 43: Asia X Ray Machine Manufacturing Industry Revenue (Million), by End-user 2025 & 2033
- Figure 44: Asia X Ray Machine Manufacturing Industry Volume (K Unit), by End-user 2025 & 2033
- Figure 45: Asia X Ray Machine Manufacturing Industry Revenue Share (%), by End-user 2025 & 2033
- Figure 46: Asia X Ray Machine Manufacturing Industry Volume Share (%), by End-user 2025 & 2033
- Figure 47: Asia X Ray Machine Manufacturing Industry Revenue (Million), by Country 2025 & 2033
- Figure 48: Asia X Ray Machine Manufacturing Industry Volume (K Unit), by Country 2025 & 2033
- Figure 49: Asia X Ray Machine Manufacturing Industry Revenue Share (%), by Country 2025 & 2033
- Figure 50: Asia X Ray Machine Manufacturing Industry Volume Share (%), by Country 2025 & 2033
- Figure 51: Latin America X Ray Machine Manufacturing Industry Revenue (Million), by Product Type 2025 & 2033
- Figure 52: Latin America X Ray Machine Manufacturing Industry Volume (K Unit), by Product Type 2025 & 2033
- Figure 53: Latin America X Ray Machine Manufacturing Industry Revenue Share (%), by Product Type 2025 & 2033
- Figure 54: Latin America X Ray Machine Manufacturing Industry Volume Share (%), by Product Type 2025 & 2033
- Figure 55: Latin America X Ray Machine Manufacturing Industry Revenue (Million), by Technology 2025 & 2033
- Figure 56: Latin America X Ray Machine Manufacturing Industry Volume (K Unit), by Technology 2025 & 2033
- Figure 57: Latin America X Ray Machine Manufacturing Industry Revenue Share (%), by Technology 2025 & 2033
- Figure 58: Latin America X Ray Machine Manufacturing Industry Volume Share (%), by Technology 2025 & 2033
- Figure 59: Latin America X Ray Machine Manufacturing Industry Revenue (Million), by End-user 2025 & 2033
- Figure 60: Latin America X Ray Machine Manufacturing Industry Volume (K Unit), by End-user 2025 & 2033
- Figure 61: Latin America X Ray Machine Manufacturing Industry Revenue Share (%), by End-user 2025 & 2033
- Figure 62: Latin America X Ray Machine Manufacturing Industry Volume Share (%), by End-user 2025 & 2033
- Figure 63: Latin America X Ray Machine Manufacturing Industry Revenue (Million), by Country 2025 & 2033
- Figure 64: Latin America X Ray Machine Manufacturing Industry Volume (K Unit), by Country 2025 & 2033
- Figure 65: Latin America X Ray Machine Manufacturing Industry Revenue Share (%), by Country 2025 & 2033
- Figure 66: Latin America X Ray Machine Manufacturing Industry Volume Share (%), by Country 2025 & 2033
- Figure 67: Middle East and Africa X Ray Machine Manufacturing Industry Revenue (Million), by Product Type 2025 & 2033
- Figure 68: Middle East and Africa X Ray Machine Manufacturing Industry Volume (K Unit), by Product Type 2025 & 2033
- Figure 69: Middle East and Africa X Ray Machine Manufacturing Industry Revenue Share (%), by Product Type 2025 & 2033
- Figure 70: Middle East and Africa X Ray Machine Manufacturing Industry Volume Share (%), by Product Type 2025 & 2033
- Figure 71: Middle East and Africa X Ray Machine Manufacturing Industry Revenue (Million), by Technology 2025 & 2033
- Figure 72: Middle East and Africa X Ray Machine Manufacturing Industry Volume (K Unit), by Technology 2025 & 2033
- Figure 73: Middle East and Africa X Ray Machine Manufacturing Industry Revenue Share (%), by Technology 2025 & 2033
- Figure 74: Middle East and Africa X Ray Machine Manufacturing Industry Volume Share (%), by Technology 2025 & 2033
- Figure 75: Middle East and Africa X Ray Machine Manufacturing Industry Revenue (Million), by End-user 2025 & 2033
- Figure 76: Middle East and Africa X Ray Machine Manufacturing Industry Volume (K Unit), by End-user 2025 & 2033
- Figure 77: Middle East and Africa X Ray Machine Manufacturing Industry Revenue Share (%), by End-user 2025 & 2033
- Figure 78: Middle East and Africa X Ray Machine Manufacturing Industry Volume Share (%), by End-user 2025 & 2033
- Figure 79: Middle East and Africa X Ray Machine Manufacturing Industry Revenue (Million), by Country 2025 & 2033
- Figure 80: Middle East and Africa X Ray Machine Manufacturing Industry Volume (K Unit), by Country 2025 & 2033
- Figure 81: Middle East and Africa X Ray Machine Manufacturing Industry Revenue Share (%), by Country 2025 & 2033
- Figure 82: Middle East and Africa X Ray Machine Manufacturing Industry Volume Share (%), by Country 2025 & 2033
List of Tables
- Table 1: Global X Ray Machine Manufacturing Industry Revenue Million Forecast, by Product Type 2020 & 2033
- Table 2: Global X Ray Machine Manufacturing Industry Volume K Unit Forecast, by Product Type 2020 & 2033
- Table 3: Global X Ray Machine Manufacturing Industry Revenue Million Forecast, by Technology 2020 & 2033
- Table 4: Global X Ray Machine Manufacturing Industry Volume K Unit Forecast, by Technology 2020 & 2033
- Table 5: Global X Ray Machine Manufacturing Industry Revenue Million Forecast, by End-user 2020 & 2033
- Table 6: Global X Ray Machine Manufacturing Industry Volume K Unit Forecast, by End-user 2020 & 2033
- Table 7: Global X Ray Machine Manufacturing Industry Revenue Million Forecast, by Region 2020 & 2033
- Table 8: Global X Ray Machine Manufacturing Industry Volume K Unit Forecast, by Region 2020 & 2033
- Table 9: Global X Ray Machine Manufacturing Industry Revenue Million Forecast, by Product Type 2020 & 2033
- Table 10: Global X Ray Machine Manufacturing Industry Volume K Unit Forecast, by Product Type 2020 & 2033
- Table 11: Global X Ray Machine Manufacturing Industry Revenue Million Forecast, by Technology 2020 & 2033
- Table 12: Global X Ray Machine Manufacturing Industry Volume K Unit Forecast, by Technology 2020 & 2033
- Table 13: Global X Ray Machine Manufacturing Industry Revenue Million Forecast, by End-user 2020 & 2033
- Table 14: Global X Ray Machine Manufacturing Industry Volume K Unit Forecast, by End-user 2020 & 2033
- Table 15: Global X Ray Machine Manufacturing Industry Revenue Million Forecast, by Country 2020 & 2033
- Table 16: Global X Ray Machine Manufacturing Industry Volume K Unit Forecast, by Country 2020 & 2033
- Table 17: United States X Ray Machine Manufacturing Industry Revenue (Million) Forecast, by Application 2020 & 2033
- Table 18: United States X Ray Machine Manufacturing Industry Volume (K Unit) Forecast, by Application 2020 & 2033
- Table 19: Canada X Ray Machine Manufacturing Industry Revenue (Million) Forecast, by Application 2020 & 2033
- Table 20: Canada X Ray Machine Manufacturing Industry Volume (K Unit) Forecast, by Application 2020 & 2033
- Table 21: Global X Ray Machine Manufacturing Industry Revenue Million Forecast, by Product Type 2020 & 2033
- Table 22: Global X Ray Machine Manufacturing Industry Volume K Unit Forecast, by Product Type 2020 & 2033
- Table 23: Global X Ray Machine Manufacturing Industry Revenue Million Forecast, by Technology 2020 & 2033
- Table 24: Global X Ray Machine Manufacturing Industry Volume K Unit Forecast, by Technology 2020 & 2033
- Table 25: Global X Ray Machine Manufacturing Industry Revenue Million Forecast, by End-user 2020 & 2033
- Table 26: Global X Ray Machine Manufacturing Industry Volume K Unit Forecast, by End-user 2020 & 2033
- Table 27: Global X Ray Machine Manufacturing Industry Revenue Million Forecast, by Country 2020 & 2033
- Table 28: Global X Ray Machine Manufacturing Industry Volume K Unit Forecast, by Country 2020 & 2033
- Table 29: United Kingdom X Ray Machine Manufacturing Industry Revenue (Million) Forecast, by Application 2020 & 2033
- Table 30: United Kingdom X Ray Machine Manufacturing Industry Volume (K Unit) Forecast, by Application 2020 & 2033
- Table 31: Germany X Ray Machine Manufacturing Industry Revenue (Million) Forecast, by Application 2020 & 2033
- Table 32: Germany X Ray Machine Manufacturing Industry Volume (K Unit) Forecast, by Application 2020 & 2033
- Table 33: France X Ray Machine Manufacturing Industry Revenue (Million) Forecast, by Application 2020 & 2033
- Table 34: France X Ray Machine Manufacturing Industry Volume (K Unit) Forecast, by Application 2020 & 2033
- Table 35: Global X Ray Machine Manufacturing Industry Revenue Million Forecast, by Product Type 2020 & 2033
- Table 36: Global X Ray Machine Manufacturing Industry Volume K Unit Forecast, by Product Type 2020 & 2033
- Table 37: Global X Ray Machine Manufacturing Industry Revenue Million Forecast, by Technology 2020 & 2033
- Table 38: Global X Ray Machine Manufacturing Industry Volume K Unit Forecast, by Technology 2020 & 2033
- Table 39: Global X Ray Machine Manufacturing Industry Revenue Million Forecast, by End-user 2020 & 2033
- Table 40: Global X Ray Machine Manufacturing Industry Volume K Unit Forecast, by End-user 2020 & 2033
- Table 41: Global X Ray Machine Manufacturing Industry Revenue Million Forecast, by Country 2020 & 2033
- Table 42: Global X Ray Machine Manufacturing Industry Volume K Unit Forecast, by Country 2020 & 2033
- Table 43: China X Ray Machine Manufacturing Industry Revenue (Million) Forecast, by Application 2020 & 2033
- Table 44: China X Ray Machine Manufacturing Industry Volume (K Unit) Forecast, by Application 2020 & 2033
- Table 45: Japan X Ray Machine Manufacturing Industry Revenue (Million) Forecast, by Application 2020 & 2033
- Table 46: Japan X Ray Machine Manufacturing Industry Volume (K Unit) Forecast, by Application 2020 & 2033
- Table 47: India X Ray Machine Manufacturing Industry Revenue (Million) Forecast, by Application 2020 & 2033
- Table 48: India X Ray Machine Manufacturing Industry Volume (K Unit) Forecast, by Application 2020 & 2033
- Table 49: South Korea X Ray Machine Manufacturing Industry Revenue (Million) Forecast, by Application 2020 & 2033
- Table 50: South Korea X Ray Machine Manufacturing Industry Volume (K Unit) Forecast, by Application 2020 & 2033
- Table 51: Global X Ray Machine Manufacturing Industry Revenue Million Forecast, by Product Type 2020 & 2033
- Table 52: Global X Ray Machine Manufacturing Industry Volume K Unit Forecast, by Product Type 2020 & 2033
- Table 53: Global X Ray Machine Manufacturing Industry Revenue Million Forecast, by Technology 2020 & 2033
- Table 54: Global X Ray Machine Manufacturing Industry Volume K Unit Forecast, by Technology 2020 & 2033
- Table 55: Global X Ray Machine Manufacturing Industry Revenue Million Forecast, by End-user 2020 & 2033
- Table 56: Global X Ray Machine Manufacturing Industry Volume K Unit Forecast, by End-user 2020 & 2033
- Table 57: Global X Ray Machine Manufacturing Industry Revenue Million Forecast, by Country 2020 & 2033
- Table 58: Global X Ray Machine Manufacturing Industry Volume K Unit Forecast, by Country 2020 & 2033
- Table 59: Global X Ray Machine Manufacturing Industry Revenue Million Forecast, by Product Type 2020 & 2033
- Table 60: Global X Ray Machine Manufacturing Industry Volume K Unit Forecast, by Product Type 2020 & 2033
- Table 61: Global X Ray Machine Manufacturing Industry Revenue Million Forecast, by Technology 2020 & 2033
- Table 62: Global X Ray Machine Manufacturing Industry Volume K Unit Forecast, by Technology 2020 & 2033
- Table 63: Global X Ray Machine Manufacturing Industry Revenue Million Forecast, by End-user 2020 & 2033
- Table 64: Global X Ray Machine Manufacturing Industry Volume K Unit Forecast, by End-user 2020 & 2033
- Table 65: Global X Ray Machine Manufacturing Industry Revenue Million Forecast, by Country 2020 & 2033
- Table 66: Global X Ray Machine Manufacturing Industry Volume K Unit Forecast, by Country 2020 & 2033
Frequently Asked Questions
1. What is the projected Compound Annual Growth Rate (CAGR) of the X Ray Machine Manufacturing Industry?
The projected CAGR is approximately 5.69%.
2. Which companies are prominent players in the X Ray Machine Manufacturing Industry?
Key companies in the market include Canon Inc, Hologic Inc, GE Healthcare, Siemens AG, Philips Healthcare, Hindrays, Hitachi Medical Corporation, Vision Medicaid Equipment Private Limited, Shimadzu Corporation, Fujifilm Holdings Corporation.
3. What are the main segments of the X Ray Machine Manufacturing Industry?
The market segments include Product Type, Technology, End-user.
4. Can you provide details about the market size?
The market size is estimated to be USD 17.70 Million as of 2022.
5. What are some drivers contributing to market growth?
Rise in Adoption of Digital X-ray Systems; Government Regulations and Investments to Improve Infrastructure.
6. What are the notable trends driving market growth?
Healthcare Sector is Expected to Hold a Significant Market Share.
7. Are there any restraints impacting market growth?
High Cost of the Equipment.
8. Can you provide examples of recent developments in the market?
November 2022: Konica Minolta Healthcare Americas, Inc., a global leader in medical diagnostic imaging and healthcare information technology, introduced groundbreaking digital radiography (DR) technologies designed to revolutionize the clinical utility of X-rays.
9. What pricing options are available for accessing the report?
Pricing options include single-user, multi-user, and enterprise licenses priced at USD 4750, USD 5250, and USD 8750 respectively.
10. Is the market size provided in terms of value or volume?
The market size is provided in terms of value, measured in Million and volume, measured in K Unit.
11. Are there any specific market keywords associated with the report?
Yes, the market keyword associated with the report is "X Ray Machine Manufacturing Industry," which aids in identifying and referencing the specific market segment covered.
12. How do I determine which pricing option suits my needs best?
The pricing options vary based on user requirements and access needs. Individual users may opt for single-user licenses, while businesses requiring broader access may choose multi-user or enterprise licenses for cost-effective access to the report.
13. Are there any additional resources or data provided in the X Ray Machine Manufacturing Industry report?
While the report offers comprehensive insights, it's advisable to review the specific contents or supplementary materials provided to ascertain if additional resources or data are available.
14. How can I stay updated on further developments or reports in the X Ray Machine Manufacturing Industry?
To stay informed about further developments, trends, and reports in the X Ray Machine Manufacturing Industry, consider subscribing to industry newsletters, following relevant companies and organizations, or regularly checking reputable industry news sources and publications.
Methodology
Step 1 - Identification of Relevant Samples Size from Population Database


Step 2 - Approaches for Defining Global Market Size (Value, Volume* & Price*)

Note*: In applicable scenarios
Step 3 - Data Sources
Primary Research
- Web Analytics
- Survey Reports
- Research Institute
- Latest Research Reports
- Opinion Leaders
Secondary Research
- Annual Reports
- White Paper
- Latest Press Release
- Industry Association
- Paid Database
- Investor Presentations

Step 4 - Data Triangulation
Involves using different sources of information in order to increase the validity of a study
These sources are likely to be stakeholders in a program - participants, other researchers, program staff, other community members, and so on.
Then we put all data in single framework & apply various statistical tools to find out the dynamic on the market.
During the analysis stage, feedback from the stakeholder groups would be compared to determine areas of agreement as well as areas of divergence