

Key Insights
The global zeolite molecular sieve market is poised for significant expansion, projected to grow at a Compound Annual Growth Rate (CAGR) of 3.9%. This robust growth trajectory is driven by increasing demand across various key industries. The market size was valued at approximately 1729 million in the base year 2025. Primary growth catalysts include the escalating adoption of zeolites for air and water purification, spurred by heightened environmental consciousness and stringent regulatory frameworks. The petrochemical sector's continued reliance on zeolites for critical catalysis and separation processes further fuels market expansion. Additionally, ongoing advancements in zeolite synthesis methodologies are enabling the development of highly efficient and specialized materials, thereby broadening their application scope into detergent formulations, HVAC systems, and industrial gas production. The agricultural sector also presents substantial growth prospects through the utilization of zeolites for enhanced soil fertility and water management.
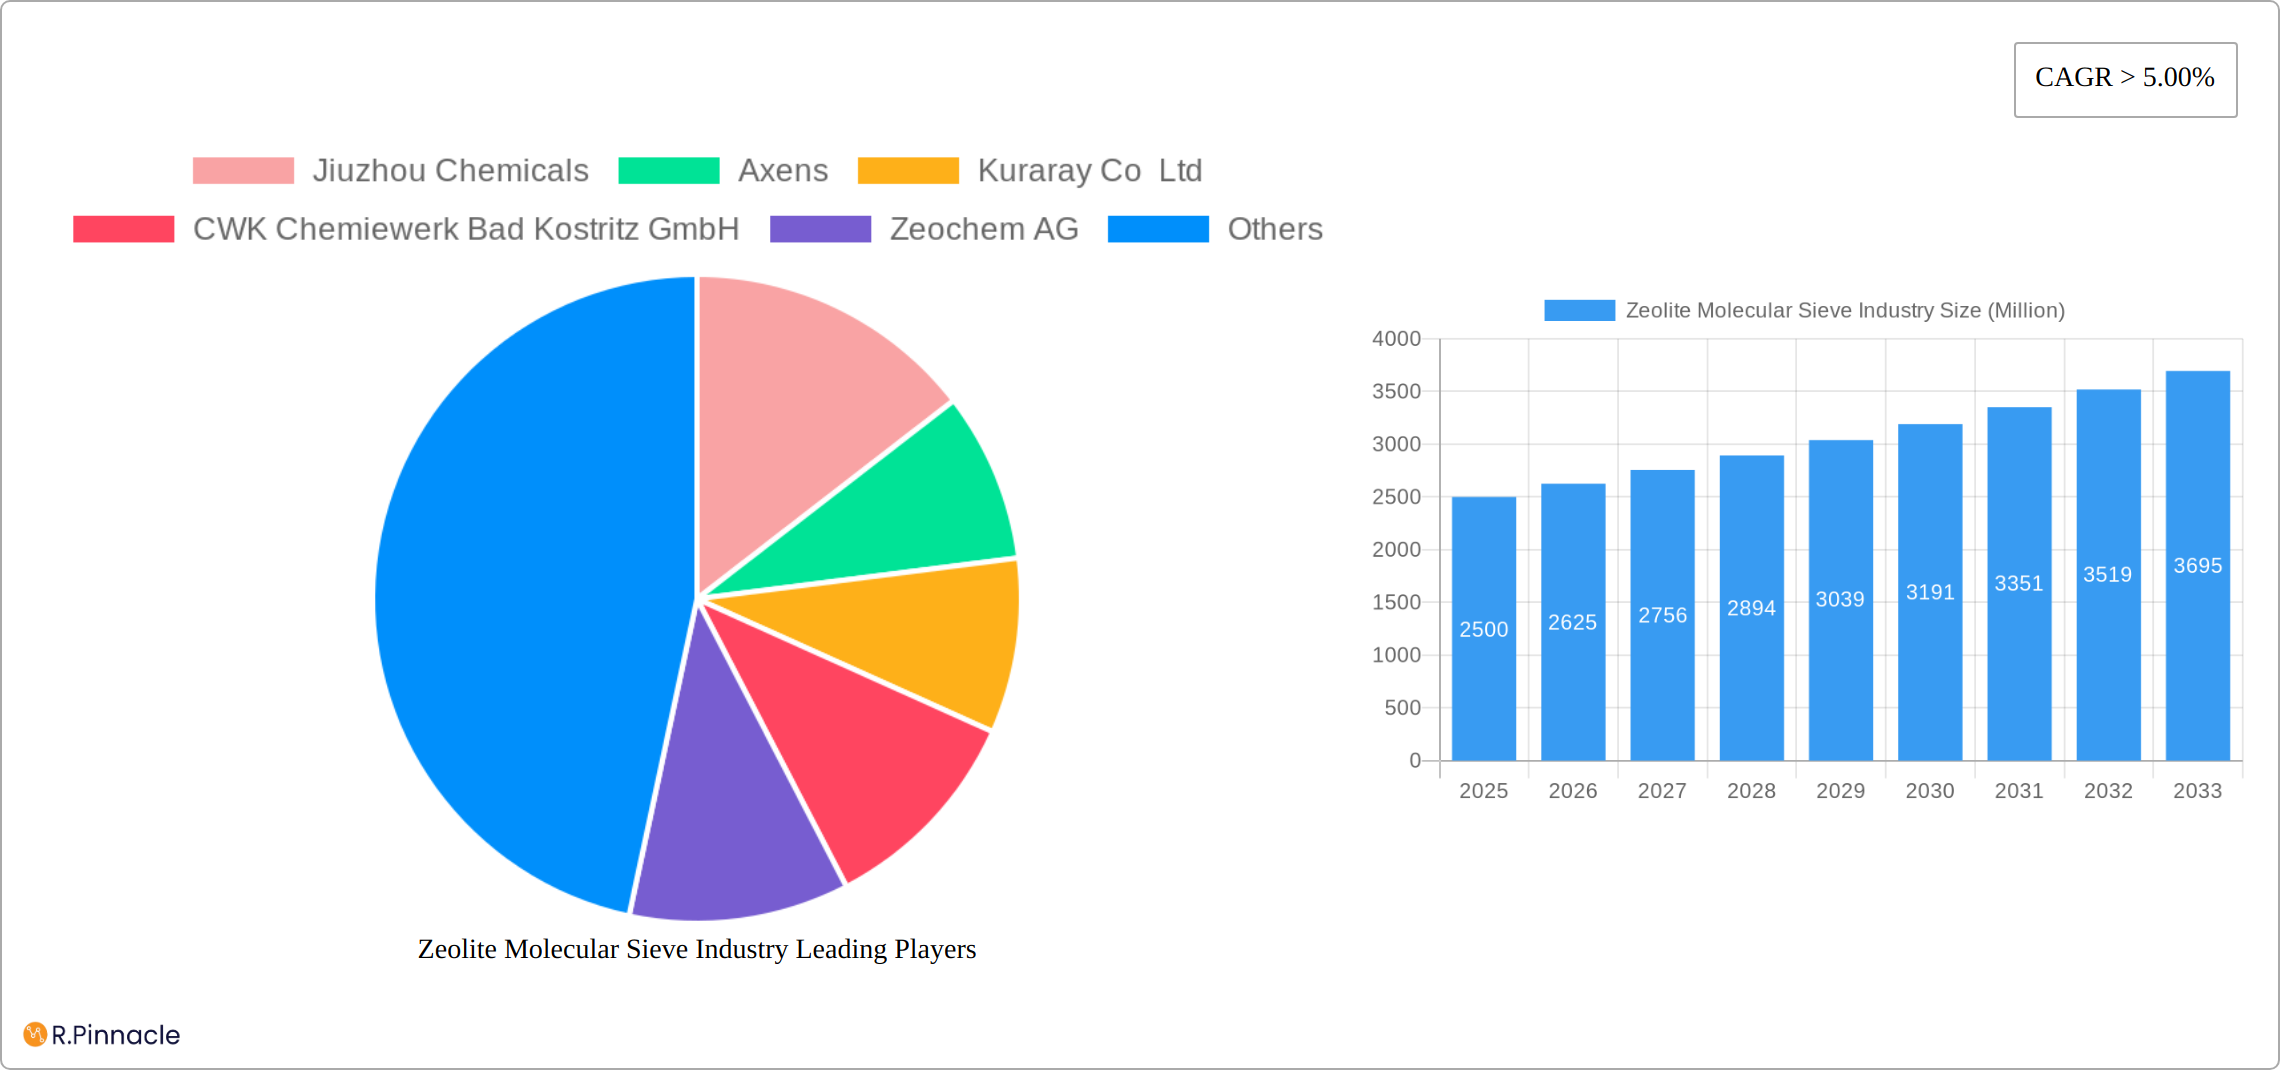
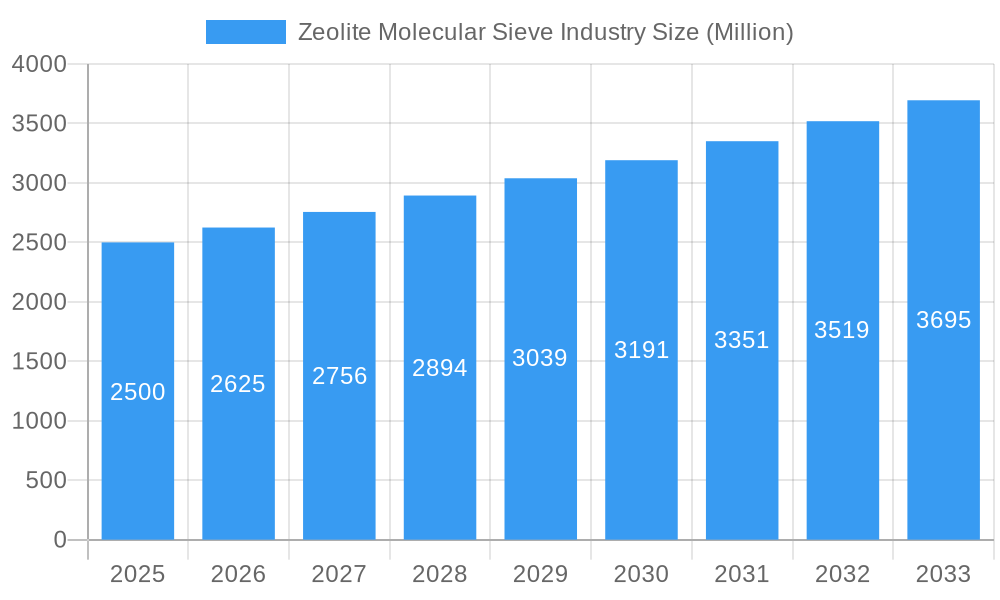
Zeolite Molecular Sieve Industry Market Size (In Billion)
Market segmentation indicates a substantial share held by natural zeolites, primarily due to their cost-effectiveness and abundant availability. Conversely, the synthetic zeolite segment is anticipated to experience more rapid growth, driven by the capability to precisely engineer properties for specialized applications. Among end-use applications, air and water purification represent the leading segments, closely followed by the petrochemical and detergent industries. Geographically, North America and Asia-Pacific currently dominate market share, propelled by robust industrial expansion and stringent environmental mandates. Emerging economies within Asia-Pacific and the Middle East and Africa are projected to become significant contributors to future market growth, supported by rising disposable incomes and infrastructure development initiatives. Key market participants comprise established chemical manufacturers and specialized zeolite producers, actively pursuing innovation and market penetration through strategic collaborations and acquisitions. The sustained growth of this market highlights its critical role in addressing diverse industrial and environmental challenges.
Zeolite Molecular Sieve Industry Company Market Share
Zeolite Molecular Sieve Industry Market Report: 2019-2033
This comprehensive report provides a detailed analysis of the Zeolite Molecular Sieve industry, offering invaluable insights for industry professionals, investors, and researchers. Covering the period from 2019 to 2033, with a focus on 2025, this report leverages extensive market research to forecast future trends and identify key opportunities. The global market size is projected to reach xx Million by 2033.
Zeolite Molecular Sieve Industry Market Structure & Innovation Trends
The Zeolite Molecular Sieve market exhibits a moderately concentrated structure, with key players like BASF SE, Arkema Group, and Tosoh Corp holding significant market share. The industry is driven by continuous innovation in zeolite synthesis, leading to improved performance and expanded applications. Regulatory frameworks, particularly concerning environmental protection and safety, play a crucial role. Product substitutes, such as activated carbon, pose a competitive challenge, while M&A activity remains moderate, with recent deals valued at approximately xx Million.
- Market Concentration: Moderately concentrated, with top 5 players holding approximately xx% market share in 2025.
- Innovation Drivers: Improved synthesis techniques, enhanced selectivity, and development of novel zeolite structures.
- Regulatory Landscape: Stringent environmental regulations drive demand for eco-friendly zeolite applications.
- M&A Activity: A moderate number of deals (xx in the past 5 years) with an average deal value of xx Million.
- Product Substitutes: Activated carbon, silica gel, and other adsorbents pose competitive challenges.
Zeolite Molecular Sieve Industry Market Dynamics & Trends
The Zeolite Molecular Sieve market is experiencing robust growth, driven by increasing demand across diverse end-use sectors. The compound annual growth rate (CAGR) from 2025-2033 is projected to be xx%, fueled by technological advancements that enhance zeolite efficiency and affordability. Market penetration in emerging economies is also a significant growth factor, along with evolving consumer preferences for sustainable and environmentally friendly products. Intense competition amongst established players and new entrants further shapes market dynamics.
Dominant Regions & Segments in Zeolite Molecular Sieve Industry
The Asia-Pacific region is projected to maintain its dominance in the Zeolite Molecular Sieve market throughout the forecast period. This leadership is fueled by rapid industrialization, robust growth in key end-use sectors such as petrochemicals and wastewater treatment, and increasing infrastructure investments. Within the raw materials segment, the demand for artificial zeolites is outpacing that of natural zeolites, driven by their superior performance characteristics, consistent quality, and potential for customization to meet specific application needs. Petrochemicals and industrial gas production remain major application areas, while the wastewater treatment sector exhibits significant growth potential, spurred by tightening environmental regulations and a global emphasis on sustainability. The increasing adoption of zeolites in emerging applications, such as carbon capture and green energy technologies, further contributes to the market's expansion.
- Key Drivers in Asia-Pacific: Rapid industrial expansion, substantial investments in infrastructure development, supportive government policies promoting technological advancement and environmental sustainability, and a burgeoning middle class driving increased consumption.
- Artificial Zeolite Dominance: Superior performance, consistent quality, tailored properties enabling optimized performance in diverse applications, and the ability to meet stringent industry specifications contribute to the preference for artificial zeolites.
- Petrochemical & Industrial Gas Production: High and consistent demand from established and rapidly expanding industries, necessitating continuous innovation in zeolite catalyst and adsorbent technologies.
- Waste and Water Treatment Growth: Stringent environmental regulations, growing awareness of water scarcity and pollution, and the increasing adoption of sustainable technologies are driving the demand for efficient and effective zeolite-based solutions.
Zeolite Molecular Sieve Industry Product Innovations
Recent innovations in the zeolite molecular sieve industry are focused on enhancing several key performance characteristics. Significant advancements are being made in developing zeolites with superior selectivity, improved thermal stability, and enhanced hydrothermal stability. This involves the creation of novel zeolite structures with precisely tailored pore sizes and shapes to meet the specific demands of various applications. For example, researchers are developing advanced catalysts for petrochemical processes that offer increased efficiency and selectivity, leading to higher yields and reduced waste. In the area of adsorption, innovations are focused on creating more efficient adsorbents for air and water purification, addressing the growing need for cleaner and safer environments. Furthermore, research is exploring the use of zeolites in emerging applications such as carbon capture, green energy technologies and pharmaceuticals.
Report Scope & Segmentation Analysis
This report segments the Zeolite Molecular Sieve market by raw material (natural and artificial zeolites) and end-use (air purification, detergent, heating & refrigeration, industrial gas production, petrochemicals, agricultural products, waste & water treatment, and others). Each segment’s market size, growth projections, and competitive dynamics are analyzed in detail. For instance, the petrochemical segment is expected to maintain a significant market share, while the waste & water treatment segment demonstrates strong growth potential.
Key Drivers of Zeolite Molecular Sieve Industry Growth
The growth of the Zeolite Molecular Sieve industry is primarily driven by the increasing demand for environmentally friendly solutions across various applications. This is coupled with technological advancements leading to the development of more efficient and cost-effective zeolite materials and processes. Stringent environmental regulations further propel the adoption of zeolites in various industries.
Challenges in the Zeolite Molecular Sieve Industry Sector
Key challenges include the fluctuating prices of raw materials, particularly for natural zeolites, and the competitive pressure from substitute materials. Supply chain disruptions and high energy consumption during zeolite production also pose significant hurdles. Furthermore, complex regulatory landscapes and evolving environmental standards can impact profitability.
Emerging Opportunities in Zeolite Molecular Sieve Industry
Emerging opportunities lie in developing advanced zeolite materials for specific niche applications, such as carbon capture and green energy technologies. The expanding market for environmentally conscious products creates significant opportunities, along with the exploration of new end-use applications in emerging economies.
Leading Players in the Zeolite Molecular Sieve Industry Market
- Jiuzhou Chemicals
- Axens
- Kuraray Co Ltd
- CWK Chemiewerk Bad Kostritz GmbH
- Zeochem AG
- Sorbead India
- Tosoh Corp
- KNT Group
- BASF SE
- Arkema Group
- Zeolyst
- Hengye Group
- W R Grace
- Clariant AG
Key Developments in Zeolite Molecular Sieve Industry Industry
- 2022 Q4: BASF SE launched a new high-performance zeolite catalyst for xylene isomerization, showcasing advancements in catalyst efficiency and selectivity.
- 2023 Q1: Arkema Group's acquisition of a smaller zeolite producer expanded its market reach and product portfolio, strengthening its competitive position.
- 2023 Q3: Tosoh Corp's significant investment in research and development for next-generation zeolite materials underlines the industry's commitment to innovation and the pursuit of advanced materials with enhanced properties. (Further details to be added in the full report)
- Ongoing Trends: Increased focus on sustainability, development of customized zeolite solutions for niche applications, and strategic partnerships to accelerate innovation and market penetration are shaping the industry landscape.
Future Outlook for Zeolite Molecular Sieve Industry Market
The future of the Zeolite Molecular Sieve industry remains exceptionally promising. Sustained growth in key end-use sectors, coupled with ongoing innovation in zeolite materials and technologies, points towards significant market expansion. Emerging economies present substantial growth opportunities, while the development of specialized zeolite applications in areas such as carbon capture, green energy, and advanced catalysis will further drive market demand. The industry is poised for substantial expansion, particularly in emerging markets and specialized applications, creating significant strategic opportunities for existing and new industry players. Continued investment in R&D and strategic collaborations will be crucial for companies seeking to capitalize on this promising market outlook.
Zeolite Molecular Sieve Industry Segmentation
-
1. Raw Material
- 1.1. Natural Zeolite
- 1.2. Artificial Zeolite
-
2. End-use
- 2.1. Air Purification
- 2.2. Detergent
- 2.3. Heating and Refrigeration
- 2.4. Industrial Gas Production
- 2.5. Petrochemical
- 2.6. Agricultural Products
- 2.7. Waste and Water Treatment
- 2.8. Other End-uses
Zeolite Molecular Sieve Industry Segmentation By Geography
-
1. Asia Pacific
- 1.1. China
- 1.2. India
- 1.3. Japan
- 1.4. South Korea
- 1.5. Rest of Asia Pacific
-
2. North America
- 2.1. United States
- 2.2. Canada
- 2.3. Mexico
-
3. Europe
- 3.1. Germany
- 3.2. United Kingdom
- 3.3. France
- 3.4. Italy
- 3.5. Rest of Europe
-
4. South America
- 4.1. Brazil
- 4.2. Argentina
- 4.3. Rest of South America
- 5. Middle East
-
6. Saudi Arabia
- 6.1. South Africa
- 6.2. Rest of Middle East
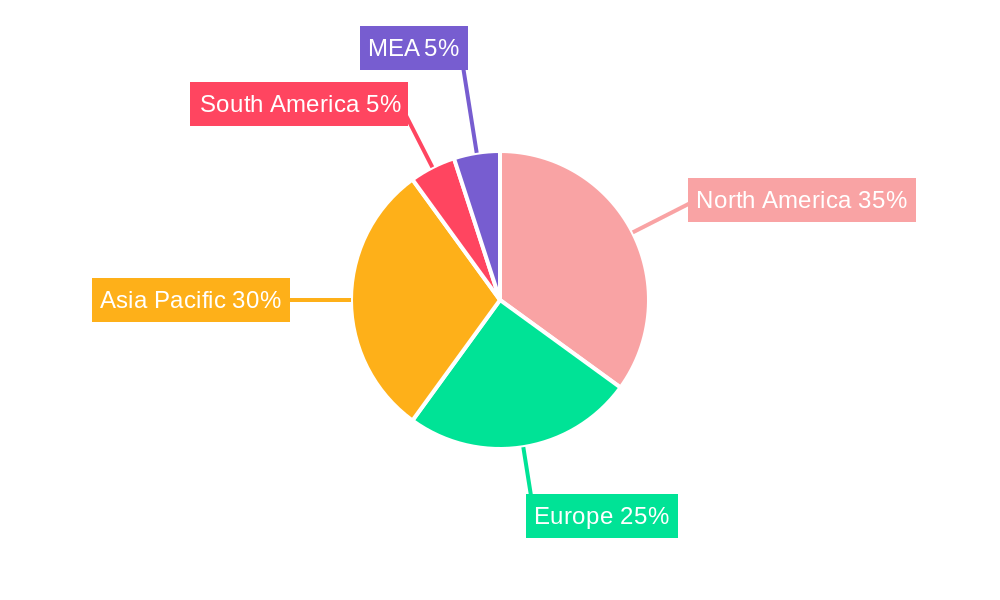
Zeolite Molecular Sieve Industry Regional Market Share
Geographic Coverage of Zeolite Molecular Sieve Industry
Zeolite Molecular Sieve Industry REPORT HIGHLIGHTS
| Aspects | Details |
|---|---|
| Study Period | 2020-2034 |
| Base Year | 2025 |
| Estimated Year | 2026 |
| Forecast Period | 2026-2034 |
| Historical Period | 2020-2025 |
| Growth Rate | CAGR of 3.9% from 2020-2034 |
| Segmentation |
|
Table of Contents
- 1. Introduction
- 1.1. Research Scope
- 1.2. Market Segmentation
- 1.3. Research Objective
- 1.4. Definitions and Assumptions
- 2. Executive Summary
- 2.1. Market Snapshot
- 3. Market Dynamics
- 3.1. Market Drivers
- 3.2. Market Restrains
- 3.3. Market Trends
- 3.4. Market Opportunities
- 4. Market Factor Analysis
- 4.1. Porters Five Forces
- 4.1.1. Bargaining Power of Suppliers
- 4.1.2. Bargaining Power of Buyers
- 4.1.3. Threat of New Entrants
- 4.1.4. Threat of Substitutes
- 4.1.5. Competitive Rivalry
- 4.2. PESTEL analysis
- 4.3. BCG Analysis
- 4.3.1. Stars (High Growth, High Market Share)
- 4.3.2. Cash Cows (Low Growth, High Market Share)
- 4.3.3. Question Mark (High Growth, Low Market Share)
- 4.3.4. Dogs (Low Growth, Low Market Share)
- 4.4. Ansoff Matrix Analysis
- 4.5. Supply Chain Analysis
- 4.6. Regulatory Landscape
- 4.7. Current Market Potential and Opportunity Assessment (TAM–SAM–SOM Framework)
- 4.8. PRI Analyst Note
- 4.1. Porters Five Forces
- 5. Market Analysis, Insights and Forecast 2021-2033
- 5.1. Market Analysis, Insights and Forecast - by Raw Material
- 5.1.1. Natural Zeolite
- 5.1.2. Artificial Zeolite
- 5.2. Market Analysis, Insights and Forecast - by End-use
- 5.2.1. Air Purification
- 5.2.2. Detergent
- 5.2.3. Heating and Refrigeration
- 5.2.4. Industrial Gas Production
- 5.2.5. Petrochemical
- 5.2.6. Agricultural Products
- 5.2.7. Waste and Water Treatment
- 5.2.8. Other End-uses
- 5.3. Market Analysis, Insights and Forecast - by Region
- 5.3.1. Asia Pacific
- 5.3.2. North America
- 5.3.3. Europe
- 5.3.4. South America
- 5.3.5. Middle East
- 5.3.6. Saudi Arabia
- 5.1. Market Analysis, Insights and Forecast - by Raw Material
- 6. Global Zeolite Molecular Sieve Industry Analysis, Insights and Forecast, 2021-2033
- 6.1. Market Analysis, Insights and Forecast - by Raw Material
- 6.1.1. Natural Zeolite
- 6.1.2. Artificial Zeolite
- 6.2. Market Analysis, Insights and Forecast - by End-use
- 6.2.1. Air Purification
- 6.2.2. Detergent
- 6.2.3. Heating and Refrigeration
- 6.2.4. Industrial Gas Production
- 6.2.5. Petrochemical
- 6.2.6. Agricultural Products
- 6.2.7. Waste and Water Treatment
- 6.2.8. Other End-uses
- 6.1. Market Analysis, Insights and Forecast - by Raw Material
- 7. Asia Pacific Zeolite Molecular Sieve Industry Analysis, Insights and Forecast, 2020-2032
- 7.1. Market Analysis, Insights and Forecast - by Raw Material
- 7.1.1. Natural Zeolite
- 7.1.2. Artificial Zeolite
- 7.2. Market Analysis, Insights and Forecast - by End-use
- 7.2.1. Air Purification
- 7.2.2. Detergent
- 7.2.3. Heating and Refrigeration
- 7.2.4. Industrial Gas Production
- 7.2.5. Petrochemical
- 7.2.6. Agricultural Products
- 7.2.7. Waste and Water Treatment
- 7.2.8. Other End-uses
- 7.1. Market Analysis, Insights and Forecast - by Raw Material
- 8. North America Zeolite Molecular Sieve Industry Analysis, Insights and Forecast, 2020-2032
- 8.1. Market Analysis, Insights and Forecast - by Raw Material
- 8.1.1. Natural Zeolite
- 8.1.2. Artificial Zeolite
- 8.2. Market Analysis, Insights and Forecast - by End-use
- 8.2.1. Air Purification
- 8.2.2. Detergent
- 8.2.3. Heating and Refrigeration
- 8.2.4. Industrial Gas Production
- 8.2.5. Petrochemical
- 8.2.6. Agricultural Products
- 8.2.7. Waste and Water Treatment
- 8.2.8. Other End-uses
- 8.1. Market Analysis, Insights and Forecast - by Raw Material
- 9. Europe Zeolite Molecular Sieve Industry Analysis, Insights and Forecast, 2020-2032
- 9.1. Market Analysis, Insights and Forecast - by Raw Material
- 9.1.1. Natural Zeolite
- 9.1.2. Artificial Zeolite
- 9.2. Market Analysis, Insights and Forecast - by End-use
- 9.2.1. Air Purification
- 9.2.2. Detergent
- 9.2.3. Heating and Refrigeration
- 9.2.4. Industrial Gas Production
- 9.2.5. Petrochemical
- 9.2.6. Agricultural Products
- 9.2.7. Waste and Water Treatment
- 9.2.8. Other End-uses
- 9.1. Market Analysis, Insights and Forecast - by Raw Material
- 10. South America Zeolite Molecular Sieve Industry Analysis, Insights and Forecast, 2020-2032
- 10.1. Market Analysis, Insights and Forecast - by Raw Material
- 10.1.1. Natural Zeolite
- 10.1.2. Artificial Zeolite
- 10.2. Market Analysis, Insights and Forecast - by End-use
- 10.2.1. Air Purification
- 10.2.2. Detergent
- 10.2.3. Heating and Refrigeration
- 10.2.4. Industrial Gas Production
- 10.2.5. Petrochemical
- 10.2.6. Agricultural Products
- 10.2.7. Waste and Water Treatment
- 10.2.8. Other End-uses
- 10.1. Market Analysis, Insights and Forecast - by Raw Material
- 11. Middle East Zeolite Molecular Sieve Industry Analysis, Insights and Forecast, 2020-2032
- 11.1. Market Analysis, Insights and Forecast - by Raw Material
- 11.1.1. Natural Zeolite
- 11.1.2. Artificial Zeolite
- 11.2. Market Analysis, Insights and Forecast - by End-use
- 11.2.1. Air Purification
- 11.2.2. Detergent
- 11.2.3. Heating and Refrigeration
- 11.2.4. Industrial Gas Production
- 11.2.5. Petrochemical
- 11.2.6. Agricultural Products
- 11.2.7. Waste and Water Treatment
- 11.2.8. Other End-uses
- 11.1. Market Analysis, Insights and Forecast - by Raw Material
- 12. Saudi Arabia Zeolite Molecular Sieve Industry Analysis, Insights and Forecast, 2020-2032
- 12.1. Market Analysis, Insights and Forecast - by Raw Material
- 12.1.1. Natural Zeolite
- 12.1.2. Artificial Zeolite
- 12.2. Market Analysis, Insights and Forecast - by End-use
- 12.2.1. Air Purification
- 12.2.2. Detergent
- 12.2.3. Heating and Refrigeration
- 12.2.4. Industrial Gas Production
- 12.2.5. Petrochemical
- 12.2.6. Agricultural Products
- 12.2.7. Waste and Water Treatment
- 12.2.8. Other End-uses
- 12.1. Market Analysis, Insights and Forecast - by Raw Material
- 13. Competitive Analysis
- 13.1. Company Profiles
- 13.1.1 Jiuzhou Chemicals
- 13.1.1.1. Company Overview
- 13.1.1.2. Products
- 13.1.1.3. Company Financials
- 13.1.1.4. SWOT Analysis
- 13.1.2 Axens
- 13.1.2.1. Company Overview
- 13.1.2.2. Products
- 13.1.2.3. Company Financials
- 13.1.2.4. SWOT Analysis
- 13.1.3 Kuraray Co Ltd
- 13.1.3.1. Company Overview
- 13.1.3.2. Products
- 13.1.3.3. Company Financials
- 13.1.3.4. SWOT Analysis
- 13.1.4 CWK Chemiewerk Bad Kostritz GmbH
- 13.1.4.1. Company Overview
- 13.1.4.2. Products
- 13.1.4.3. Company Financials
- 13.1.4.4. SWOT Analysis
- 13.1.5 Zeochem AG
- 13.1.5.1. Company Overview
- 13.1.5.2. Products
- 13.1.5.3. Company Financials
- 13.1.5.4. SWOT Analysis
- 13.1.6 Sorbead India
- 13.1.6.1. Company Overview
- 13.1.6.2. Products
- 13.1.6.3. Company Financials
- 13.1.6.4. SWOT Analysis
- 13.1.7 Tosoh Corp
- 13.1.7.1. Company Overview
- 13.1.7.2. Products
- 13.1.7.3. Company Financials
- 13.1.7.4. SWOT Analysis
- 13.1.8 KNT Group
- 13.1.8.1. Company Overview
- 13.1.8.2. Products
- 13.1.8.3. Company Financials
- 13.1.8.4. SWOT Analysis
- 13.1.9 BASF SE
- 13.1.9.1. Company Overview
- 13.1.9.2. Products
- 13.1.9.3. Company Financials
- 13.1.9.4. SWOT Analysis
- 13.1.10 Arkema Group
- 13.1.10.1. Company Overview
- 13.1.10.2. Products
- 13.1.10.3. Company Financials
- 13.1.10.4. SWOT Analysis
- 13.1.11 Zeolyst
- 13.1.11.1. Company Overview
- 13.1.11.2. Products
- 13.1.11.3. Company Financials
- 13.1.11.4. SWOT Analysis
- 13.1.12 Hengye Group
- 13.1.12.1. Company Overview
- 13.1.12.2. Products
- 13.1.12.3. Company Financials
- 13.1.12.4. SWOT Analysis
- 13.1.13 W R Grace
- 13.1.13.1. Company Overview
- 13.1.13.2. Products
- 13.1.13.3. Company Financials
- 13.1.13.4. SWOT Analysis
- 13.1.14 Clariant AG
- 13.1.14.1. Company Overview
- 13.1.14.2. Products
- 13.1.14.3. Company Financials
- 13.1.14.4. SWOT Analysis
- 13.1.1 Jiuzhou Chemicals
- 13.2. Market Entropy
- 13.2.1 Company's Key Areas Served
- 13.2.2 Recent Developments
- 13.3. Company Market Share Analysis 2025
- 13.3.1 Top 5 Companies Market Share Analysis
- 13.3.2 Top 3 Companies Market Share Analysis
- 13.4. List of Potential Customers
- 14. Research Methodology
List of Figures
- Figure 1: Global Zeolite Molecular Sieve Industry Revenue Breakdown (million, %) by Region 2025 & 2033
- Figure 2: Global Zeolite Molecular Sieve Industry Volume Breakdown (K Tons, %) by Region 2025 & 2033
- Figure 3: Asia Pacific Zeolite Molecular Sieve Industry Revenue (million), by Raw Material 2025 & 2033
- Figure 4: Asia Pacific Zeolite Molecular Sieve Industry Volume (K Tons), by Raw Material 2025 & 2033
- Figure 5: Asia Pacific Zeolite Molecular Sieve Industry Revenue Share (%), by Raw Material 2025 & 2033
- Figure 6: Asia Pacific Zeolite Molecular Sieve Industry Volume Share (%), by Raw Material 2025 & 2033
- Figure 7: Asia Pacific Zeolite Molecular Sieve Industry Revenue (million), by End-use 2025 & 2033
- Figure 8: Asia Pacific Zeolite Molecular Sieve Industry Volume (K Tons), by End-use 2025 & 2033
- Figure 9: Asia Pacific Zeolite Molecular Sieve Industry Revenue Share (%), by End-use 2025 & 2033
- Figure 10: Asia Pacific Zeolite Molecular Sieve Industry Volume Share (%), by End-use 2025 & 2033
- Figure 11: Asia Pacific Zeolite Molecular Sieve Industry Revenue (million), by Country 2025 & 2033
- Figure 12: Asia Pacific Zeolite Molecular Sieve Industry Volume (K Tons), by Country 2025 & 2033
- Figure 13: Asia Pacific Zeolite Molecular Sieve Industry Revenue Share (%), by Country 2025 & 2033
- Figure 14: Asia Pacific Zeolite Molecular Sieve Industry Volume Share (%), by Country 2025 & 2033
- Figure 15: North America Zeolite Molecular Sieve Industry Revenue (million), by Raw Material 2025 & 2033
- Figure 16: North America Zeolite Molecular Sieve Industry Volume (K Tons), by Raw Material 2025 & 2033
- Figure 17: North America Zeolite Molecular Sieve Industry Revenue Share (%), by Raw Material 2025 & 2033
- Figure 18: North America Zeolite Molecular Sieve Industry Volume Share (%), by Raw Material 2025 & 2033
- Figure 19: North America Zeolite Molecular Sieve Industry Revenue (million), by End-use 2025 & 2033
- Figure 20: North America Zeolite Molecular Sieve Industry Volume (K Tons), by End-use 2025 & 2033
- Figure 21: North America Zeolite Molecular Sieve Industry Revenue Share (%), by End-use 2025 & 2033
- Figure 22: North America Zeolite Molecular Sieve Industry Volume Share (%), by End-use 2025 & 2033
- Figure 23: North America Zeolite Molecular Sieve Industry Revenue (million), by Country 2025 & 2033
- Figure 24: North America Zeolite Molecular Sieve Industry Volume (K Tons), by Country 2025 & 2033
- Figure 25: North America Zeolite Molecular Sieve Industry Revenue Share (%), by Country 2025 & 2033
- Figure 26: North America Zeolite Molecular Sieve Industry Volume Share (%), by Country 2025 & 2033
- Figure 27: Europe Zeolite Molecular Sieve Industry Revenue (million), by Raw Material 2025 & 2033
- Figure 28: Europe Zeolite Molecular Sieve Industry Volume (K Tons), by Raw Material 2025 & 2033
- Figure 29: Europe Zeolite Molecular Sieve Industry Revenue Share (%), by Raw Material 2025 & 2033
- Figure 30: Europe Zeolite Molecular Sieve Industry Volume Share (%), by Raw Material 2025 & 2033
- Figure 31: Europe Zeolite Molecular Sieve Industry Revenue (million), by End-use 2025 & 2033
- Figure 32: Europe Zeolite Molecular Sieve Industry Volume (K Tons), by End-use 2025 & 2033
- Figure 33: Europe Zeolite Molecular Sieve Industry Revenue Share (%), by End-use 2025 & 2033
- Figure 34: Europe Zeolite Molecular Sieve Industry Volume Share (%), by End-use 2025 & 2033
- Figure 35: Europe Zeolite Molecular Sieve Industry Revenue (million), by Country 2025 & 2033
- Figure 36: Europe Zeolite Molecular Sieve Industry Volume (K Tons), by Country 2025 & 2033
- Figure 37: Europe Zeolite Molecular Sieve Industry Revenue Share (%), by Country 2025 & 2033
- Figure 38: Europe Zeolite Molecular Sieve Industry Volume Share (%), by Country 2025 & 2033
- Figure 39: South America Zeolite Molecular Sieve Industry Revenue (million), by Raw Material 2025 & 2033
- Figure 40: South America Zeolite Molecular Sieve Industry Volume (K Tons), by Raw Material 2025 & 2033
- Figure 41: South America Zeolite Molecular Sieve Industry Revenue Share (%), by Raw Material 2025 & 2033
- Figure 42: South America Zeolite Molecular Sieve Industry Volume Share (%), by Raw Material 2025 & 2033
- Figure 43: South America Zeolite Molecular Sieve Industry Revenue (million), by End-use 2025 & 2033
- Figure 44: South America Zeolite Molecular Sieve Industry Volume (K Tons), by End-use 2025 & 2033
- Figure 45: South America Zeolite Molecular Sieve Industry Revenue Share (%), by End-use 2025 & 2033
- Figure 46: South America Zeolite Molecular Sieve Industry Volume Share (%), by End-use 2025 & 2033
- Figure 47: South America Zeolite Molecular Sieve Industry Revenue (million), by Country 2025 & 2033
- Figure 48: South America Zeolite Molecular Sieve Industry Volume (K Tons), by Country 2025 & 2033
- Figure 49: South America Zeolite Molecular Sieve Industry Revenue Share (%), by Country 2025 & 2033
- Figure 50: South America Zeolite Molecular Sieve Industry Volume Share (%), by Country 2025 & 2033
- Figure 51: Middle East Zeolite Molecular Sieve Industry Revenue (million), by Raw Material 2025 & 2033
- Figure 52: Middle East Zeolite Molecular Sieve Industry Volume (K Tons), by Raw Material 2025 & 2033
- Figure 53: Middle East Zeolite Molecular Sieve Industry Revenue Share (%), by Raw Material 2025 & 2033
- Figure 54: Middle East Zeolite Molecular Sieve Industry Volume Share (%), by Raw Material 2025 & 2033
- Figure 55: Middle East Zeolite Molecular Sieve Industry Revenue (million), by End-use 2025 & 2033
- Figure 56: Middle East Zeolite Molecular Sieve Industry Volume (K Tons), by End-use 2025 & 2033
- Figure 57: Middle East Zeolite Molecular Sieve Industry Revenue Share (%), by End-use 2025 & 2033
- Figure 58: Middle East Zeolite Molecular Sieve Industry Volume Share (%), by End-use 2025 & 2033
- Figure 59: Middle East Zeolite Molecular Sieve Industry Revenue (million), by Country 2025 & 2033
- Figure 60: Middle East Zeolite Molecular Sieve Industry Volume (K Tons), by Country 2025 & 2033
- Figure 61: Middle East Zeolite Molecular Sieve Industry Revenue Share (%), by Country 2025 & 2033
- Figure 62: Middle East Zeolite Molecular Sieve Industry Volume Share (%), by Country 2025 & 2033
- Figure 63: Saudi Arabia Zeolite Molecular Sieve Industry Revenue (million), by Raw Material 2025 & 2033
- Figure 64: Saudi Arabia Zeolite Molecular Sieve Industry Volume (K Tons), by Raw Material 2025 & 2033
- Figure 65: Saudi Arabia Zeolite Molecular Sieve Industry Revenue Share (%), by Raw Material 2025 & 2033
- Figure 66: Saudi Arabia Zeolite Molecular Sieve Industry Volume Share (%), by Raw Material 2025 & 2033
- Figure 67: Saudi Arabia Zeolite Molecular Sieve Industry Revenue (million), by End-use 2025 & 2033
- Figure 68: Saudi Arabia Zeolite Molecular Sieve Industry Volume (K Tons), by End-use 2025 & 2033
- Figure 69: Saudi Arabia Zeolite Molecular Sieve Industry Revenue Share (%), by End-use 2025 & 2033
- Figure 70: Saudi Arabia Zeolite Molecular Sieve Industry Volume Share (%), by End-use 2025 & 2033
- Figure 71: Saudi Arabia Zeolite Molecular Sieve Industry Revenue (million), by Country 2025 & 2033
- Figure 72: Saudi Arabia Zeolite Molecular Sieve Industry Volume (K Tons), by Country 2025 & 2033
- Figure 73: Saudi Arabia Zeolite Molecular Sieve Industry Revenue Share (%), by Country 2025 & 2033
- Figure 74: Saudi Arabia Zeolite Molecular Sieve Industry Volume Share (%), by Country 2025 & 2033
List of Tables
- Table 1: Global Zeolite Molecular Sieve Industry Revenue million Forecast, by Raw Material 2020 & 2033
- Table 2: Global Zeolite Molecular Sieve Industry Volume K Tons Forecast, by Raw Material 2020 & 2033
- Table 3: Global Zeolite Molecular Sieve Industry Revenue million Forecast, by End-use 2020 & 2033
- Table 4: Global Zeolite Molecular Sieve Industry Volume K Tons Forecast, by End-use 2020 & 2033
- Table 5: Global Zeolite Molecular Sieve Industry Revenue million Forecast, by Region 2020 & 2033
- Table 6: Global Zeolite Molecular Sieve Industry Volume K Tons Forecast, by Region 2020 & 2033
- Table 7: Global Zeolite Molecular Sieve Industry Revenue million Forecast, by Raw Material 2020 & 2033
- Table 8: Global Zeolite Molecular Sieve Industry Volume K Tons Forecast, by Raw Material 2020 & 2033
- Table 9: Global Zeolite Molecular Sieve Industry Revenue million Forecast, by End-use 2020 & 2033
- Table 10: Global Zeolite Molecular Sieve Industry Volume K Tons Forecast, by End-use 2020 & 2033
- Table 11: Global Zeolite Molecular Sieve Industry Revenue million Forecast, by Country 2020 & 2033
- Table 12: Global Zeolite Molecular Sieve Industry Volume K Tons Forecast, by Country 2020 & 2033
- Table 13: China Zeolite Molecular Sieve Industry Revenue (million) Forecast, by Application 2020 & 2033
- Table 14: China Zeolite Molecular Sieve Industry Volume (K Tons) Forecast, by Application 2020 & 2033
- Table 15: India Zeolite Molecular Sieve Industry Revenue (million) Forecast, by Application 2020 & 2033
- Table 16: India Zeolite Molecular Sieve Industry Volume (K Tons) Forecast, by Application 2020 & 2033
- Table 17: Japan Zeolite Molecular Sieve Industry Revenue (million) Forecast, by Application 2020 & 2033
- Table 18: Japan Zeolite Molecular Sieve Industry Volume (K Tons) Forecast, by Application 2020 & 2033
- Table 19: South Korea Zeolite Molecular Sieve Industry Revenue (million) Forecast, by Application 2020 & 2033
- Table 20: South Korea Zeolite Molecular Sieve Industry Volume (K Tons) Forecast, by Application 2020 & 2033
- Table 21: Rest of Asia Pacific Zeolite Molecular Sieve Industry Revenue (million) Forecast, by Application 2020 & 2033
- Table 22: Rest of Asia Pacific Zeolite Molecular Sieve Industry Volume (K Tons) Forecast, by Application 2020 & 2033
- Table 23: Global Zeolite Molecular Sieve Industry Revenue million Forecast, by Raw Material 2020 & 2033
- Table 24: Global Zeolite Molecular Sieve Industry Volume K Tons Forecast, by Raw Material 2020 & 2033
- Table 25: Global Zeolite Molecular Sieve Industry Revenue million Forecast, by End-use 2020 & 2033
- Table 26: Global Zeolite Molecular Sieve Industry Volume K Tons Forecast, by End-use 2020 & 2033
- Table 27: Global Zeolite Molecular Sieve Industry Revenue million Forecast, by Country 2020 & 2033
- Table 28: Global Zeolite Molecular Sieve Industry Volume K Tons Forecast, by Country 2020 & 2033
- Table 29: United States Zeolite Molecular Sieve Industry Revenue (million) Forecast, by Application 2020 & 2033
- Table 30: United States Zeolite Molecular Sieve Industry Volume (K Tons) Forecast, by Application 2020 & 2033
- Table 31: Canada Zeolite Molecular Sieve Industry Revenue (million) Forecast, by Application 2020 & 2033
- Table 32: Canada Zeolite Molecular Sieve Industry Volume (K Tons) Forecast, by Application 2020 & 2033
- Table 33: Mexico Zeolite Molecular Sieve Industry Revenue (million) Forecast, by Application 2020 & 2033
- Table 34: Mexico Zeolite Molecular Sieve Industry Volume (K Tons) Forecast, by Application 2020 & 2033
- Table 35: Global Zeolite Molecular Sieve Industry Revenue million Forecast, by Raw Material 2020 & 2033
- Table 36: Global Zeolite Molecular Sieve Industry Volume K Tons Forecast, by Raw Material 2020 & 2033
- Table 37: Global Zeolite Molecular Sieve Industry Revenue million Forecast, by End-use 2020 & 2033
- Table 38: Global Zeolite Molecular Sieve Industry Volume K Tons Forecast, by End-use 2020 & 2033
- Table 39: Global Zeolite Molecular Sieve Industry Revenue million Forecast, by Country 2020 & 2033
- Table 40: Global Zeolite Molecular Sieve Industry Volume K Tons Forecast, by Country 2020 & 2033
- Table 41: Germany Zeolite Molecular Sieve Industry Revenue (million) Forecast, by Application 2020 & 2033
- Table 42: Germany Zeolite Molecular Sieve Industry Volume (K Tons) Forecast, by Application 2020 & 2033
- Table 43: United Kingdom Zeolite Molecular Sieve Industry Revenue (million) Forecast, by Application 2020 & 2033
- Table 44: United Kingdom Zeolite Molecular Sieve Industry Volume (K Tons) Forecast, by Application 2020 & 2033
- Table 45: France Zeolite Molecular Sieve Industry Revenue (million) Forecast, by Application 2020 & 2033
- Table 46: France Zeolite Molecular Sieve Industry Volume (K Tons) Forecast, by Application 2020 & 2033
- Table 47: Italy Zeolite Molecular Sieve Industry Revenue (million) Forecast, by Application 2020 & 2033
- Table 48: Italy Zeolite Molecular Sieve Industry Volume (K Tons) Forecast, by Application 2020 & 2033
- Table 49: Rest of Europe Zeolite Molecular Sieve Industry Revenue (million) Forecast, by Application 2020 & 2033
- Table 50: Rest of Europe Zeolite Molecular Sieve Industry Volume (K Tons) Forecast, by Application 2020 & 2033
- Table 51: Global Zeolite Molecular Sieve Industry Revenue million Forecast, by Raw Material 2020 & 2033
- Table 52: Global Zeolite Molecular Sieve Industry Volume K Tons Forecast, by Raw Material 2020 & 2033
- Table 53: Global Zeolite Molecular Sieve Industry Revenue million Forecast, by End-use 2020 & 2033
- Table 54: Global Zeolite Molecular Sieve Industry Volume K Tons Forecast, by End-use 2020 & 2033
- Table 55: Global Zeolite Molecular Sieve Industry Revenue million Forecast, by Country 2020 & 2033
- Table 56: Global Zeolite Molecular Sieve Industry Volume K Tons Forecast, by Country 2020 & 2033
- Table 57: Brazil Zeolite Molecular Sieve Industry Revenue (million) Forecast, by Application 2020 & 2033
- Table 58: Brazil Zeolite Molecular Sieve Industry Volume (K Tons) Forecast, by Application 2020 & 2033
- Table 59: Argentina Zeolite Molecular Sieve Industry Revenue (million) Forecast, by Application 2020 & 2033
- Table 60: Argentina Zeolite Molecular Sieve Industry Volume (K Tons) Forecast, by Application 2020 & 2033
- Table 61: Rest of South America Zeolite Molecular Sieve Industry Revenue (million) Forecast, by Application 2020 & 2033
- Table 62: Rest of South America Zeolite Molecular Sieve Industry Volume (K Tons) Forecast, by Application 2020 & 2033
- Table 63: Global Zeolite Molecular Sieve Industry Revenue million Forecast, by Raw Material 2020 & 2033
- Table 64: Global Zeolite Molecular Sieve Industry Volume K Tons Forecast, by Raw Material 2020 & 2033
- Table 65: Global Zeolite Molecular Sieve Industry Revenue million Forecast, by End-use 2020 & 2033
- Table 66: Global Zeolite Molecular Sieve Industry Volume K Tons Forecast, by End-use 2020 & 2033
- Table 67: Global Zeolite Molecular Sieve Industry Revenue million Forecast, by Country 2020 & 2033
- Table 68: Global Zeolite Molecular Sieve Industry Volume K Tons Forecast, by Country 2020 & 2033
- Table 69: Global Zeolite Molecular Sieve Industry Revenue million Forecast, by Raw Material 2020 & 2033
- Table 70: Global Zeolite Molecular Sieve Industry Volume K Tons Forecast, by Raw Material 2020 & 2033
- Table 71: Global Zeolite Molecular Sieve Industry Revenue million Forecast, by End-use 2020 & 2033
- Table 72: Global Zeolite Molecular Sieve Industry Volume K Tons Forecast, by End-use 2020 & 2033
- Table 73: Global Zeolite Molecular Sieve Industry Revenue million Forecast, by Country 2020 & 2033
- Table 74: Global Zeolite Molecular Sieve Industry Volume K Tons Forecast, by Country 2020 & 2033
- Table 75: South Africa Zeolite Molecular Sieve Industry Revenue (million) Forecast, by Application 2020 & 2033
- Table 76: South Africa Zeolite Molecular Sieve Industry Volume (K Tons) Forecast, by Application 2020 & 2033
- Table 77: Rest of Middle East Zeolite Molecular Sieve Industry Revenue (million) Forecast, by Application 2020 & 2033
- Table 78: Rest of Middle East Zeolite Molecular Sieve Industry Volume (K Tons) Forecast, by Application 2020 & 2033
Frequently Asked Questions
1. What is the projected Compound Annual Growth Rate (CAGR) of the Zeolite Molecular Sieve Industry?
The projected CAGR is approximately 3.9%.
2. Which companies are prominent players in the Zeolite Molecular Sieve Industry?
Key companies in the market include Jiuzhou Chemicals, Axens, Kuraray Co Ltd, CWK Chemiewerk Bad Kostritz GmbH, Zeochem AG, Sorbead India, Tosoh Corp, KNT Group, BASF SE, Arkema Group, Zeolyst, Hengye Group, W R Grace, Clariant AG.
3. What are the main segments of the Zeolite Molecular Sieve Industry?
The market segments include Raw Material, End-use.
4. Can you provide details about the market size?
The market size is estimated to be USD 1729 million as of 2022.
5. What are some drivers contributing to market growth?
; Rising Awareness for Treatment of Hazardous Organic Materials in Wastewater; High Demand from the Detergent Market.
6. What are the notable trends driving market growth?
Detergent Segment to Dominate the Market Demand.
7. Are there any restraints impacting market growth?
; Threat from Chemical Composites. Enzymes. and Other Substitutes.
8. Can you provide examples of recent developments in the market?
N/A
9. What pricing options are available for accessing the report?
Pricing options include single-user, multi-user, and enterprise licenses priced at USD 4750, USD 5250, and USD 8750 respectively.
10. Is the market size provided in terms of value or volume?
The market size is provided in terms of value, measured in million and volume, measured in K Tons.
11. Are there any specific market keywords associated with the report?
Yes, the market keyword associated with the report is "Zeolite Molecular Sieve Industry," which aids in identifying and referencing the specific market segment covered.
12. How do I determine which pricing option suits my needs best?
The pricing options vary based on user requirements and access needs. Individual users may opt for single-user licenses, while businesses requiring broader access may choose multi-user or enterprise licenses for cost-effective access to the report.
13. Are there any additional resources or data provided in the Zeolite Molecular Sieve Industry report?
While the report offers comprehensive insights, it's advisable to review the specific contents or supplementary materials provided to ascertain if additional resources or data are available.
14. How can I stay updated on further developments or reports in the Zeolite Molecular Sieve Industry?
To stay informed about further developments, trends, and reports in the Zeolite Molecular Sieve Industry, consider subscribing to industry newsletters, following relevant companies and organizations, or regularly checking reputable industry news sources and publications.
Methodology
Step 1 - Identification of Relevant Samples Size from Population Database


Step 2 - Approaches for Defining Global Market Size (Value, Volume* & Price*)

Note*: In applicable scenarios
Step 3 - Data Sources
Primary Research
- Web Analytics
- Survey Reports
- Research Institute
- Latest Research Reports
- Opinion Leaders
Secondary Research
- Annual Reports
- White Paper
- Latest Press Release
- Industry Association
- Paid Database
- Investor Presentations

Step 4 - Data Triangulation
Involves using different sources of information in order to increase the validity of a study
These sources are likely to be stakeholders in a program - participants, other researchers, program staff, other community members, and so on.
Then we put all data in single framework & apply various statistical tools to find out the dynamic on the market.
During the analysis stage, feedback from the stakeholder groups would be compared to determine areas of agreement as well as areas of divergence