

Key Insights
The global zinc sulfate market, valued at approximately $2 billion in 2025, is projected to grow at a Compound Annual Growth Rate (CAGR) of 5.5% from 2025 to 2033. This expansion is fueled by escalating demand across key sectors: agriculture (micronutrient fertilizers), chemicals & petrochemicals (reagents & catalysts), and pharmaceuticals (formulations). Growing global construction and infrastructure development also drives demand in the paints and coatings industry. Market growth may be tempered by zinc price volatility and environmental regulations. The market is segmented by product type (monohydrate, heptahydrate) and end-user industry, with agriculture and chemicals/petrochemicals holding significant shares. The competitive landscape features established global players and regional entities engaged in strategic collaborations and product innovation.
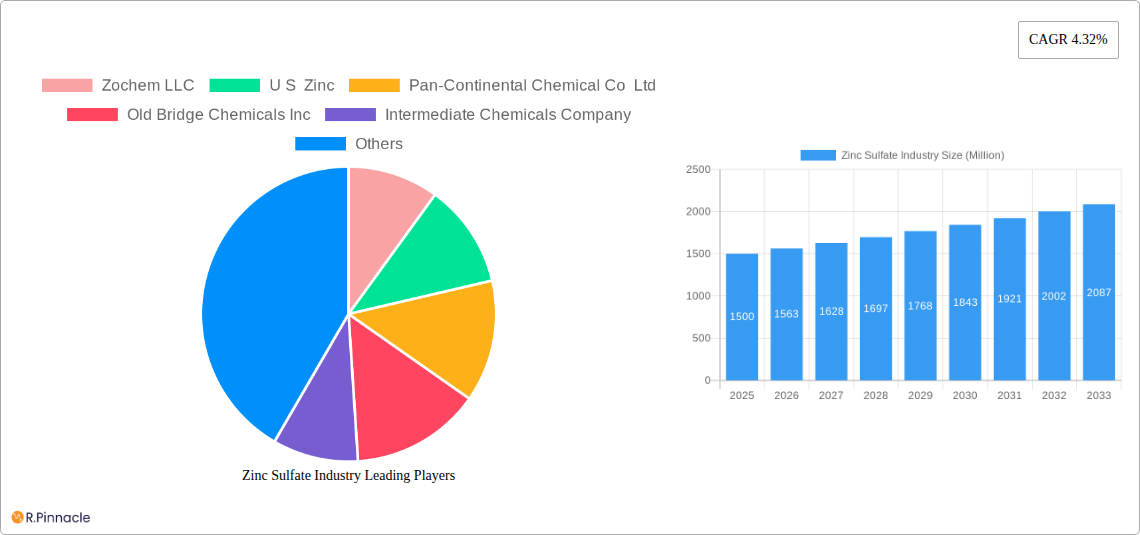
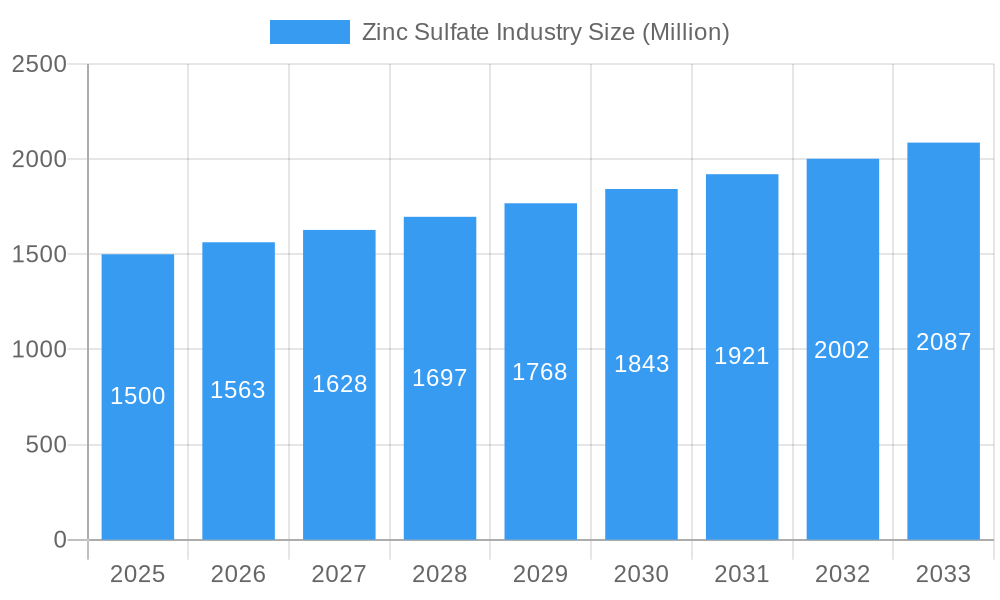
Zinc Sulfate Industry Market Size (In Billion)
Geographically, North America and Europe remain dominant markets due to mature industrial sectors and strong regulatory environments. The Asia-Pacific region, led by China and India, is poised for the most rapid growth, driven by industrial expansion, agricultural advancement, and increasing consumer spending. South America and the Middle East & Africa are expected to exhibit moderate growth, influenced by developmental initiatives and infrastructure investments. To maintain growth momentum, market participants are prioritizing R&D for efficient and sustainable production methods, addressing environmental considerations, and aligning with evolving industry requirements.
Zinc Sulfate Industry Company Market Share
Zinc Sulfate Industry: Market Analysis & Forecast 2019-2033
This comprehensive report provides an in-depth analysis of the global Zinc Sulfate industry, offering invaluable insights for industry professionals, investors, and stakeholders. Covering the period from 2019 to 2033, with a focus on 2025, this report delivers crucial data and projections to navigate the evolving market landscape. Key segments like Zinc Oxide, Zinc Sulfate, Zinc Carbonate, and Zinc Chloride are analyzed across diverse end-user industries, including Agriculture, Chemicals & Petrochemicals, and Pharmaceuticals.
Zinc Sulfate Industry Market Structure & Innovation Trends
This section analyzes the competitive landscape of the Zinc Sulfate market, examining market concentration, innovation drivers, regulatory frameworks, and key industry dynamics. We delve into the impact of mergers and acquisitions (M&A) activities, assessing their influence on market share and overall industry structure. The report quantifies market concentration using metrics such as the Herfindahl-Hirschman Index (HHI) and identifies key players exhibiting significant market share. We explore the value of completed M&A deals in the industry during the study period (2019-2024) amounting to approximately $XX Million. Innovation drivers, such as advancements in production technologies and the development of sustainable Zinc Sulfate solutions, are also discussed, along with regulatory frameworks influencing market growth and product development. This includes assessing the impact of environmental regulations and their implications for manufacturers. Finally, the analysis also considers the impact of substitute products and their potential to disrupt the market. The section concludes with an examination of end-user demographics and their evolving needs and preferences in relation to Zinc Sulfate products.
Zinc Sulfate Industry Market Dynamics & Trends
This section provides a detailed analysis of the market dynamics, including market growth drivers, technological disruptions, evolving consumer preferences, and the competitive landscape. The report presents a comprehensive overview of the factors driving market growth, such as the increasing demand from key end-user industries. Specific examples include the rising consumption of Zinc Sulfate in agriculture as a micronutrient and its use in chemical processing as a catalyst. Furthermore, we examine technological disruptions that are likely to impact the market in the forecast period (2025-2033), such as the adoption of more sustainable and efficient production methods. The analysis also considers consumer preferences and their influence on product development and market segmentation. This includes an assessment of the increasing demand for environmentally friendly and sustainably produced Zinc Sulfate. The competitive dynamics are analyzed by examining the strategies employed by key players to maintain and expand their market share. The projected Compound Annual Growth Rate (CAGR) for the Zinc Sulfate market is estimated to be XX% during the forecast period (2025-2033), while market penetration of specific Zinc Sulfate types is assessed across various end-user segments.
Dominant Regions & Segments in Zinc Sulfate Industry
This section identifies the leading regions and segments within the Zinc Sulfate industry. A detailed analysis is conducted to understand the factors contributing to their dominance. The key drivers are explored using bullet points, whereas the dominance analysis utilizes detailed paragraphs.
Leading Regions: The report identifies [Region X] as the dominant region, followed by [Region Y] and [Region Z].
- Key Drivers for [Region X]:
- Strong economic growth fueling industrial activities.
- Favorable government policies and supportive infrastructure.
- High demand from key end-user industries such as agriculture and chemicals.
- Dominance Analysis for [Region X]: [Region X]'s strong economic performance and favorable regulatory environment have created a fertile ground for the growth of the Zinc Sulfate industry. The high concentration of major players and substantial investments in production capacity have further solidified its position as the dominant region.
- Key Drivers for [Region X]:
Leading Segments: [Specific Type, e.g., Zinc Sulfate] and [Specific End-User Industry, e.g., Agriculture] segments are highlighted as the leading segments. Similar detailed analyses are performed for each dominant segment.
Zinc Sulfate Industry Product Innovations
Recent advancements in Zinc Sulfate production have led to the introduction of high-purity grades tailored for specific applications. These innovations enhance product performance, allowing for greater efficiency and effectiveness in end-use sectors. New applications, driven by technological advancements, expand the market's reach into new industries. The competitive advantages offered by these innovative products are significant, fostering increased market penetration and improved profitability. This section also addresses the sustainability improvements integrated into product development, reflecting the industry's growing focus on environmentally responsible practices.
Report Scope & Segmentation Analysis
This report comprehensively segments the Zinc Sulfate market by Type (Zinc Oxide, Zinc Sulfate, Zinc Carbonate, Zinc Chloride, Other Types) and End-user Industry (Agriculture, Chemicals and Petrochemicals, Ceramic, Pharmaceutical, Paints and Coatings, Rubber Processing, Other End-user Industries). Each segment is analyzed in terms of market size, growth projections, and competitive dynamics. The market size for each segment in 2025 is estimated as follows: Zinc Sulfate (XX Million), Zinc Oxide (XX Million), Zinc Carbonate (XX Million), Zinc Chloride (XX Million), Other Types (XX Million). Growth projections and competitive dynamics are discussed for each segment within the report.
Key Drivers of Zinc Sulfate Industry Growth
Growth in the Zinc Sulfate industry is primarily driven by increasing demand from the agricultural sector, owing to its importance as a micronutrient for plant growth. Further, the expanding chemicals and petrochemicals industry requires significant quantities of Zinc Sulfate as a crucial component in various chemical processes. Government regulations promoting sustainable agriculture practices indirectly boost demand for Zinc Sulfate-based fertilizers. Lastly, technological advancements in Zinc Sulfate production methods, resulting in higher efficiency and cost-effectiveness, are also key growth catalysts.
Challenges in the Zinc Sulfate Industry Sector
The Zinc Sulfate industry faces challenges such as fluctuating raw material prices, which directly impact production costs. Stringent environmental regulations necessitate substantial investments in sustainable manufacturing practices, potentially increasing operational expenditures. Competition from substitute materials and the emergence of new technologies present ongoing challenges. These factors, coupled with global economic uncertainty, could potentially limit industry growth.
Emerging Opportunities in Zinc Sulfate Industry
Emerging opportunities exist in the development of specialized Zinc Sulfate formulations for niche applications, catering to the evolving needs of various end-user industries. The growing demand for sustainable and environmentally friendly products presents opportunities for manufacturers to innovate and capture market share. Expansion into emerging economies with growing agricultural sectors also holds immense potential. Further, advancements in nanotechnology offer exciting prospects for developing novel Zinc Sulfate-based materials with enhanced properties.
Leading Players in the Zinc Sulfate Industry Market
- Zochem LLC
- U S Zinc
- Pan-Continental Chemical Co Ltd
- Old Bridge Chemicals Inc
- Intermediate Chemicals Company
- Nexa
- EverZinc
- Rech Chemical Co Ltd
- L Brüggemann GmbH & Co KG
- Rubamin
- Changsha Lantian Chemical Co Ltd
- Weifang Longda Zinc Industry Co Ltd
- Flaurea Chemicals
- Silox India Pvt Ltd
- Seyang Zinc Technology (Huai An) Co Ltd
- TIB Chemicals AG
- Global Chemical Co Ltd
- Hakusui Tech
- American Chemet Corporation
Key Developments in Zinc Sulfate Industry Industry
- 2022 Q3: [Company X] launched a new high-purity Zinc Sulfate product line.
- 2021 Q4: [Company Y] announced a significant expansion of its production facilities.
- 2020 Q2: A merger between [Company A] and [Company B] reshaped the competitive landscape. (Further details of specific developments will be included in the complete report)
Future Outlook for Zinc Sulfate Industry Market
The Zinc Sulfate market is poised for sustained growth, driven by increasing demand from key sectors and technological advancements. Strategic partnerships and collaborations among industry players are expected to further accelerate growth. The focus on sustainability and the development of eco-friendly products will be crucial for success in this evolving market. Emerging economies present significant untapped potential, while innovations in product applications and formulations will continue to drive expansion. The overall market outlook remains positive, offering significant opportunities for both established players and new entrants.
Zinc Sulfate Industry Segmentation
-
1. Type
- 1.1. Zinc Oxide
- 1.2. Zinc Sulfate
- 1.3. Zinc Carbonate
- 1.4. Zinc Chloride
- 1.5. Other Types
-
2. End-user Industry
- 2.1. Agriculture
- 2.2. Chemicals and Petrochemicals
- 2.3. Ceramic
- 2.4. Pharmaceutical
- 2.5. Paints and Coatings
- 2.6. Rubber Processing
- 2.7. Other End-user Industries
Zinc Sulfate Industry Segmentation By Geography
-
1. Asia Pacific
- 1.1. China
- 1.2. India
- 1.3. Japan
- 1.4. South Korea
- 1.5. Malaysia
- 1.6. Thailand
- 1.7. Indonesia
- 1.8. Vietnam
- 1.9. Rest of Asia Pacific
-
2. North America
- 2.1. United States
- 2.2. Canada
- 2.3. Mexico
-
3. Europe
- 3.1. Germany
- 3.2. United Kingdom
- 3.3. France
- 3.4. Italy
- 3.5. Spain
- 3.6. Turkey
- 3.7. Russia
- 3.8. NORDIC Countries
- 3.9. Rest of Europe
-
4. South America
- 4.1. Brazil
- 4.2. Argentina
- 4.3. Colombia
- 4.4. Rest of South America
-
5. Middle East and Africa
- 5.1. Saudi Arabia
- 5.2. Nigeria
- 5.3. Qatar
- 5.4. Egypt
- 5.5. United Arab Emirates
- 5.6. South Africa
- 5.7. Rest of Middle East and Africa
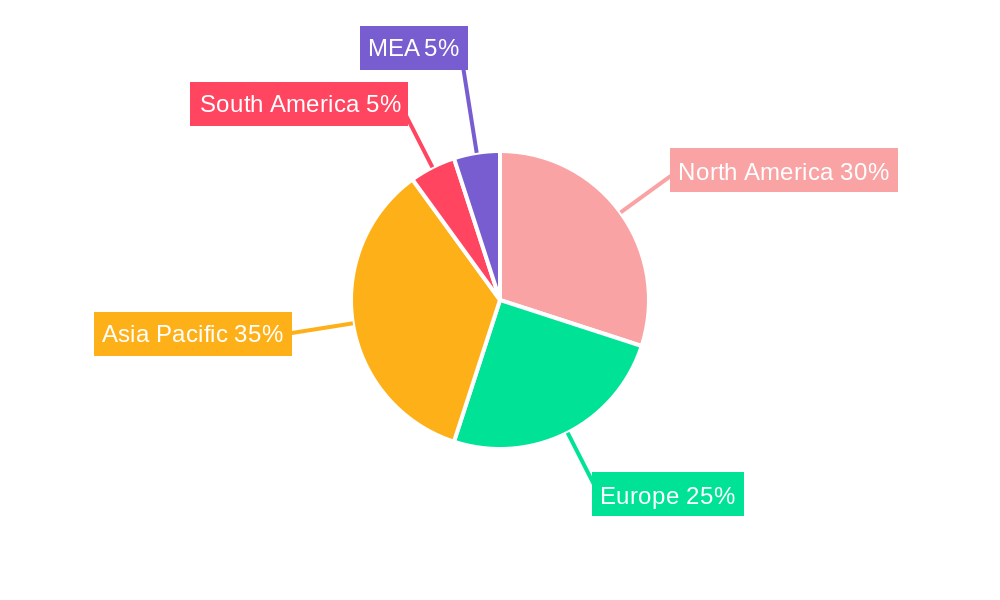
Zinc Sulfate Industry Regional Market Share
Geographic Coverage of Zinc Sulfate Industry
Zinc Sulfate Industry REPORT HIGHLIGHTS
| Aspects | Details |
|---|---|
| Study Period | 2020-2034 |
| Base Year | 2025 |
| Estimated Year | 2026 |
| Forecast Period | 2026-2034 |
| Historical Period | 2020-2025 |
| Growth Rate | CAGR of 5.5% from 2020-2034 |
| Segmentation |
|
Table of Contents
- 1. Introduction
- 1.1. Research Scope
- 1.2. Market Segmentation
- 1.3. Research Objective
- 1.4. Definitions and Assumptions
- 2. Executive Summary
- 2.1. Market Snapshot
- 3. Market Dynamics
- 3.1. Market Drivers
- 3.2. Market Restrains
- 3.3. Market Trends
- 3.4. Market Opportunities
- 4. Market Factor Analysis
- 4.1. Porters Five Forces
- 4.1.1. Bargaining Power of Suppliers
- 4.1.2. Bargaining Power of Buyers
- 4.1.3. Threat of New Entrants
- 4.1.4. Threat of Substitutes
- 4.1.5. Competitive Rivalry
- 4.2. PESTEL analysis
- 4.3. BCG Analysis
- 4.3.1. Stars (High Growth, High Market Share)
- 4.3.2. Cash Cows (Low Growth, High Market Share)
- 4.3.3. Question Mark (High Growth, Low Market Share)
- 4.3.4. Dogs (Low Growth, Low Market Share)
- 4.4. Ansoff Matrix Analysis
- 4.5. Supply Chain Analysis
- 4.6. Regulatory Landscape
- 4.7. Current Market Potential and Opportunity Assessment (TAM–SAM–SOM Framework)
- 4.8. PRI Analyst Note
- 4.1. Porters Five Forces
- 5. Market Analysis, Insights and Forecast 2021-2033
- 5.1. Market Analysis, Insights and Forecast - by Type
- 5.1.1. Zinc Oxide
- 5.1.2. Zinc Sulfate
- 5.1.3. Zinc Carbonate
- 5.1.4. Zinc Chloride
- 5.1.5. Other Types
- 5.2. Market Analysis, Insights and Forecast - by End-user Industry
- 5.2.1. Agriculture
- 5.2.2. Chemicals and Petrochemicals
- 5.2.3. Ceramic
- 5.2.4. Pharmaceutical
- 5.2.5. Paints and Coatings
- 5.2.6. Rubber Processing
- 5.2.7. Other End-user Industries
- 5.3. Market Analysis, Insights and Forecast - by Region
- 5.3.1. Asia Pacific
- 5.3.2. North America
- 5.3.3. Europe
- 5.3.4. South America
- 5.3.5. Middle East and Africa
- 5.1. Market Analysis, Insights and Forecast - by Type
- 6. Global Zinc Sulfate Industry Analysis, Insights and Forecast, 2021-2033
- 6.1. Market Analysis, Insights and Forecast - by Type
- 6.1.1. Zinc Oxide
- 6.1.2. Zinc Sulfate
- 6.1.3. Zinc Carbonate
- 6.1.4. Zinc Chloride
- 6.1.5. Other Types
- 6.2. Market Analysis, Insights and Forecast - by End-user Industry
- 6.2.1. Agriculture
- 6.2.2. Chemicals and Petrochemicals
- 6.2.3. Ceramic
- 6.2.4. Pharmaceutical
- 6.2.5. Paints and Coatings
- 6.2.6. Rubber Processing
- 6.2.7. Other End-user Industries
- 6.1. Market Analysis, Insights and Forecast - by Type
- 7. Asia Pacific Zinc Sulfate Industry Analysis, Insights and Forecast, 2020-2032
- 7.1. Market Analysis, Insights and Forecast - by Type
- 7.1.1. Zinc Oxide
- 7.1.2. Zinc Sulfate
- 7.1.3. Zinc Carbonate
- 7.1.4. Zinc Chloride
- 7.1.5. Other Types
- 7.2. Market Analysis, Insights and Forecast - by End-user Industry
- 7.2.1. Agriculture
- 7.2.2. Chemicals and Petrochemicals
- 7.2.3. Ceramic
- 7.2.4. Pharmaceutical
- 7.2.5. Paints and Coatings
- 7.2.6. Rubber Processing
- 7.2.7. Other End-user Industries
- 7.1. Market Analysis, Insights and Forecast - by Type
- 8. North America Zinc Sulfate Industry Analysis, Insights and Forecast, 2020-2032
- 8.1. Market Analysis, Insights and Forecast - by Type
- 8.1.1. Zinc Oxide
- 8.1.2. Zinc Sulfate
- 8.1.3. Zinc Carbonate
- 8.1.4. Zinc Chloride
- 8.1.5. Other Types
- 8.2. Market Analysis, Insights and Forecast - by End-user Industry
- 8.2.1. Agriculture
- 8.2.2. Chemicals and Petrochemicals
- 8.2.3. Ceramic
- 8.2.4. Pharmaceutical
- 8.2.5. Paints and Coatings
- 8.2.6. Rubber Processing
- 8.2.7. Other End-user Industries
- 8.1. Market Analysis, Insights and Forecast - by Type
- 9. Europe Zinc Sulfate Industry Analysis, Insights and Forecast, 2020-2032
- 9.1. Market Analysis, Insights and Forecast - by Type
- 9.1.1. Zinc Oxide
- 9.1.2. Zinc Sulfate
- 9.1.3. Zinc Carbonate
- 9.1.4. Zinc Chloride
- 9.1.5. Other Types
- 9.2. Market Analysis, Insights and Forecast - by End-user Industry
- 9.2.1. Agriculture
- 9.2.2. Chemicals and Petrochemicals
- 9.2.3. Ceramic
- 9.2.4. Pharmaceutical
- 9.2.5. Paints and Coatings
- 9.2.6. Rubber Processing
- 9.2.7. Other End-user Industries
- 9.1. Market Analysis, Insights and Forecast - by Type
- 10. South America Zinc Sulfate Industry Analysis, Insights and Forecast, 2020-2032
- 10.1. Market Analysis, Insights and Forecast - by Type
- 10.1.1. Zinc Oxide
- 10.1.2. Zinc Sulfate
- 10.1.3. Zinc Carbonate
- 10.1.4. Zinc Chloride
- 10.1.5. Other Types
- 10.2. Market Analysis, Insights and Forecast - by End-user Industry
- 10.2.1. Agriculture
- 10.2.2. Chemicals and Petrochemicals
- 10.2.3. Ceramic
- 10.2.4. Pharmaceutical
- 10.2.5. Paints and Coatings
- 10.2.6. Rubber Processing
- 10.2.7. Other End-user Industries
- 10.1. Market Analysis, Insights and Forecast - by Type
- 11. Middle East and Africa Zinc Sulfate Industry Analysis, Insights and Forecast, 2020-2032
- 11.1. Market Analysis, Insights and Forecast - by Type
- 11.1.1. Zinc Oxide
- 11.1.2. Zinc Sulfate
- 11.1.3. Zinc Carbonate
- 11.1.4. Zinc Chloride
- 11.1.5. Other Types
- 11.2. Market Analysis, Insights and Forecast - by End-user Industry
- 11.2.1. Agriculture
- 11.2.2. Chemicals and Petrochemicals
- 11.2.3. Ceramic
- 11.2.4. Pharmaceutical
- 11.2.5. Paints and Coatings
- 11.2.6. Rubber Processing
- 11.2.7. Other End-user Industries
- 11.1. Market Analysis, Insights and Forecast - by Type
- 12. Competitive Analysis
- 12.1. Company Profiles
- 12.1.1 Zochem LLC
- 12.1.1.1. Company Overview
- 12.1.1.2. Products
- 12.1.1.3. Company Financials
- 12.1.1.4. SWOT Analysis
- 12.1.2 U S Zinc
- 12.1.2.1. Company Overview
- 12.1.2.2. Products
- 12.1.2.3. Company Financials
- 12.1.2.4. SWOT Analysis
- 12.1.3 Pan-Continental Chemical Co Ltd
- 12.1.3.1. Company Overview
- 12.1.3.2. Products
- 12.1.3.3. Company Financials
- 12.1.3.4. SWOT Analysis
- 12.1.4 Old Bridge Chemicals Inc
- 12.1.4.1. Company Overview
- 12.1.4.2. Products
- 12.1.4.3. Company Financials
- 12.1.4.4. SWOT Analysis
- 12.1.5 Intermediate Chemicals Company
- 12.1.5.1. Company Overview
- 12.1.5.2. Products
- 12.1.5.3. Company Financials
- 12.1.5.4. SWOT Analysis
- 12.1.6 Nexa
- 12.1.6.1. Company Overview
- 12.1.6.2. Products
- 12.1.6.3. Company Financials
- 12.1.6.4. SWOT Analysis
- 12.1.7 EverZinc
- 12.1.7.1. Company Overview
- 12.1.7.2. Products
- 12.1.7.3. Company Financials
- 12.1.7.4. SWOT Analysis
- 12.1.8 Rech Chemical Co Ltd
- 12.1.8.1. Company Overview
- 12.1.8.2. Products
- 12.1.8.3. Company Financials
- 12.1.8.4. SWOT Analysis
- 12.1.9 L Brüggemann GmbH & Co KG
- 12.1.9.1. Company Overview
- 12.1.9.2. Products
- 12.1.9.3. Company Financials
- 12.1.9.4. SWOT Analysis
- 12.1.10 Rubamin
- 12.1.10.1. Company Overview
- 12.1.10.2. Products
- 12.1.10.3. Company Financials
- 12.1.10.4. SWOT Analysis
- 12.1.11 Changsha Lantian Chemical Co Ltd
- 12.1.11.1. Company Overview
- 12.1.11.2. Products
- 12.1.11.3. Company Financials
- 12.1.11.4. SWOT Analysis
- 12.1.12 Weifang Longda Zinc Industry Co Ltd
- 12.1.12.1. Company Overview
- 12.1.12.2. Products
- 12.1.12.3. Company Financials
- 12.1.12.4. SWOT Analysis
- 12.1.13 Flaurea Chemicals
- 12.1.13.1. Company Overview
- 12.1.13.2. Products
- 12.1.13.3. Company Financials
- 12.1.13.4. SWOT Analysis
- 12.1.14 Silox India Pvt Ltd
- 12.1.14.1. Company Overview
- 12.1.14.2. Products
- 12.1.14.3. Company Financials
- 12.1.14.4. SWOT Analysis
- 12.1.15 Seyang Zinc Technology (Huai An) Co Ltd
- 12.1.15.1. Company Overview
- 12.1.15.2. Products
- 12.1.15.3. Company Financials
- 12.1.15.4. SWOT Analysis
- 12.1.16 TIB Chemicals AG
- 12.1.16.1. Company Overview
- 12.1.16.2. Products
- 12.1.16.3. Company Financials
- 12.1.16.4. SWOT Analysis
- 12.1.17 Global Chemical Co Ltd
- 12.1.17.1. Company Overview
- 12.1.17.2. Products
- 12.1.17.3. Company Financials
- 12.1.17.4. SWOT Analysis
- 12.1.18 Hakusui Tech
- 12.1.18.1. Company Overview
- 12.1.18.2. Products
- 12.1.18.3. Company Financials
- 12.1.18.4. SWOT Analysis
- 12.1.19 American Chemet Corporation
- 12.1.19.1. Company Overview
- 12.1.19.2. Products
- 12.1.19.3. Company Financials
- 12.1.19.4. SWOT Analysis
- 12.1.1 Zochem LLC
- 12.2. Market Entropy
- 12.2.1 Company's Key Areas Served
- 12.2.2 Recent Developments
- 12.3. Company Market Share Analysis 2025
- 12.3.1 Top 5 Companies Market Share Analysis
- 12.3.2 Top 3 Companies Market Share Analysis
- 12.4. List of Potential Customers
- 13. Research Methodology
List of Figures
- Figure 1: Global Zinc Sulfate Industry Revenue Breakdown (billion, %) by Region 2025 & 2033
- Figure 2: Global Zinc Sulfate Industry Volume Breakdown (K Tons, %) by Region 2025 & 2033
- Figure 3: Asia Pacific Zinc Sulfate Industry Revenue (billion), by Type 2025 & 2033
- Figure 4: Asia Pacific Zinc Sulfate Industry Volume (K Tons), by Type 2025 & 2033
- Figure 5: Asia Pacific Zinc Sulfate Industry Revenue Share (%), by Type 2025 & 2033
- Figure 6: Asia Pacific Zinc Sulfate Industry Volume Share (%), by Type 2025 & 2033
- Figure 7: Asia Pacific Zinc Sulfate Industry Revenue (billion), by End-user Industry 2025 & 2033
- Figure 8: Asia Pacific Zinc Sulfate Industry Volume (K Tons), by End-user Industry 2025 & 2033
- Figure 9: Asia Pacific Zinc Sulfate Industry Revenue Share (%), by End-user Industry 2025 & 2033
- Figure 10: Asia Pacific Zinc Sulfate Industry Volume Share (%), by End-user Industry 2025 & 2033
- Figure 11: Asia Pacific Zinc Sulfate Industry Revenue (billion), by Country 2025 & 2033
- Figure 12: Asia Pacific Zinc Sulfate Industry Volume (K Tons), by Country 2025 & 2033
- Figure 13: Asia Pacific Zinc Sulfate Industry Revenue Share (%), by Country 2025 & 2033
- Figure 14: Asia Pacific Zinc Sulfate Industry Volume Share (%), by Country 2025 & 2033
- Figure 15: North America Zinc Sulfate Industry Revenue (billion), by Type 2025 & 2033
- Figure 16: North America Zinc Sulfate Industry Volume (K Tons), by Type 2025 & 2033
- Figure 17: North America Zinc Sulfate Industry Revenue Share (%), by Type 2025 & 2033
- Figure 18: North America Zinc Sulfate Industry Volume Share (%), by Type 2025 & 2033
- Figure 19: North America Zinc Sulfate Industry Revenue (billion), by End-user Industry 2025 & 2033
- Figure 20: North America Zinc Sulfate Industry Volume (K Tons), by End-user Industry 2025 & 2033
- Figure 21: North America Zinc Sulfate Industry Revenue Share (%), by End-user Industry 2025 & 2033
- Figure 22: North America Zinc Sulfate Industry Volume Share (%), by End-user Industry 2025 & 2033
- Figure 23: North America Zinc Sulfate Industry Revenue (billion), by Country 2025 & 2033
- Figure 24: North America Zinc Sulfate Industry Volume (K Tons), by Country 2025 & 2033
- Figure 25: North America Zinc Sulfate Industry Revenue Share (%), by Country 2025 & 2033
- Figure 26: North America Zinc Sulfate Industry Volume Share (%), by Country 2025 & 2033
- Figure 27: Europe Zinc Sulfate Industry Revenue (billion), by Type 2025 & 2033
- Figure 28: Europe Zinc Sulfate Industry Volume (K Tons), by Type 2025 & 2033
- Figure 29: Europe Zinc Sulfate Industry Revenue Share (%), by Type 2025 & 2033
- Figure 30: Europe Zinc Sulfate Industry Volume Share (%), by Type 2025 & 2033
- Figure 31: Europe Zinc Sulfate Industry Revenue (billion), by End-user Industry 2025 & 2033
- Figure 32: Europe Zinc Sulfate Industry Volume (K Tons), by End-user Industry 2025 & 2033
- Figure 33: Europe Zinc Sulfate Industry Revenue Share (%), by End-user Industry 2025 & 2033
- Figure 34: Europe Zinc Sulfate Industry Volume Share (%), by End-user Industry 2025 & 2033
- Figure 35: Europe Zinc Sulfate Industry Revenue (billion), by Country 2025 & 2033
- Figure 36: Europe Zinc Sulfate Industry Volume (K Tons), by Country 2025 & 2033
- Figure 37: Europe Zinc Sulfate Industry Revenue Share (%), by Country 2025 & 2033
- Figure 38: Europe Zinc Sulfate Industry Volume Share (%), by Country 2025 & 2033
- Figure 39: South America Zinc Sulfate Industry Revenue (billion), by Type 2025 & 2033
- Figure 40: South America Zinc Sulfate Industry Volume (K Tons), by Type 2025 & 2033
- Figure 41: South America Zinc Sulfate Industry Revenue Share (%), by Type 2025 & 2033
- Figure 42: South America Zinc Sulfate Industry Volume Share (%), by Type 2025 & 2033
- Figure 43: South America Zinc Sulfate Industry Revenue (billion), by End-user Industry 2025 & 2033
- Figure 44: South America Zinc Sulfate Industry Volume (K Tons), by End-user Industry 2025 & 2033
- Figure 45: South America Zinc Sulfate Industry Revenue Share (%), by End-user Industry 2025 & 2033
- Figure 46: South America Zinc Sulfate Industry Volume Share (%), by End-user Industry 2025 & 2033
- Figure 47: South America Zinc Sulfate Industry Revenue (billion), by Country 2025 & 2033
- Figure 48: South America Zinc Sulfate Industry Volume (K Tons), by Country 2025 & 2033
- Figure 49: South America Zinc Sulfate Industry Revenue Share (%), by Country 2025 & 2033
- Figure 50: South America Zinc Sulfate Industry Volume Share (%), by Country 2025 & 2033
- Figure 51: Middle East and Africa Zinc Sulfate Industry Revenue (billion), by Type 2025 & 2033
- Figure 52: Middle East and Africa Zinc Sulfate Industry Volume (K Tons), by Type 2025 & 2033
- Figure 53: Middle East and Africa Zinc Sulfate Industry Revenue Share (%), by Type 2025 & 2033
- Figure 54: Middle East and Africa Zinc Sulfate Industry Volume Share (%), by Type 2025 & 2033
- Figure 55: Middle East and Africa Zinc Sulfate Industry Revenue (billion), by End-user Industry 2025 & 2033
- Figure 56: Middle East and Africa Zinc Sulfate Industry Volume (K Tons), by End-user Industry 2025 & 2033
- Figure 57: Middle East and Africa Zinc Sulfate Industry Revenue Share (%), by End-user Industry 2025 & 2033
- Figure 58: Middle East and Africa Zinc Sulfate Industry Volume Share (%), by End-user Industry 2025 & 2033
- Figure 59: Middle East and Africa Zinc Sulfate Industry Revenue (billion), by Country 2025 & 2033
- Figure 60: Middle East and Africa Zinc Sulfate Industry Volume (K Tons), by Country 2025 & 2033
- Figure 61: Middle East and Africa Zinc Sulfate Industry Revenue Share (%), by Country 2025 & 2033
- Figure 62: Middle East and Africa Zinc Sulfate Industry Volume Share (%), by Country 2025 & 2033
List of Tables
- Table 1: Global Zinc Sulfate Industry Revenue billion Forecast, by Type 2020 & 2033
- Table 2: Global Zinc Sulfate Industry Volume K Tons Forecast, by Type 2020 & 2033
- Table 3: Global Zinc Sulfate Industry Revenue billion Forecast, by End-user Industry 2020 & 2033
- Table 4: Global Zinc Sulfate Industry Volume K Tons Forecast, by End-user Industry 2020 & 2033
- Table 5: Global Zinc Sulfate Industry Revenue billion Forecast, by Region 2020 & 2033
- Table 6: Global Zinc Sulfate Industry Volume K Tons Forecast, by Region 2020 & 2033
- Table 7: Global Zinc Sulfate Industry Revenue billion Forecast, by Type 2020 & 2033
- Table 8: Global Zinc Sulfate Industry Volume K Tons Forecast, by Type 2020 & 2033
- Table 9: Global Zinc Sulfate Industry Revenue billion Forecast, by End-user Industry 2020 & 2033
- Table 10: Global Zinc Sulfate Industry Volume K Tons Forecast, by End-user Industry 2020 & 2033
- Table 11: Global Zinc Sulfate Industry Revenue billion Forecast, by Country 2020 & 2033
- Table 12: Global Zinc Sulfate Industry Volume K Tons Forecast, by Country 2020 & 2033
- Table 13: China Zinc Sulfate Industry Revenue (billion) Forecast, by Application 2020 & 2033
- Table 14: China Zinc Sulfate Industry Volume (K Tons) Forecast, by Application 2020 & 2033
- Table 15: India Zinc Sulfate Industry Revenue (billion) Forecast, by Application 2020 & 2033
- Table 16: India Zinc Sulfate Industry Volume (K Tons) Forecast, by Application 2020 & 2033
- Table 17: Japan Zinc Sulfate Industry Revenue (billion) Forecast, by Application 2020 & 2033
- Table 18: Japan Zinc Sulfate Industry Volume (K Tons) Forecast, by Application 2020 & 2033
- Table 19: South Korea Zinc Sulfate Industry Revenue (billion) Forecast, by Application 2020 & 2033
- Table 20: South Korea Zinc Sulfate Industry Volume (K Tons) Forecast, by Application 2020 & 2033
- Table 21: Malaysia Zinc Sulfate Industry Revenue (billion) Forecast, by Application 2020 & 2033
- Table 22: Malaysia Zinc Sulfate Industry Volume (K Tons) Forecast, by Application 2020 & 2033
- Table 23: Thailand Zinc Sulfate Industry Revenue (billion) Forecast, by Application 2020 & 2033
- Table 24: Thailand Zinc Sulfate Industry Volume (K Tons) Forecast, by Application 2020 & 2033
- Table 25: Indonesia Zinc Sulfate Industry Revenue (billion) Forecast, by Application 2020 & 2033
- Table 26: Indonesia Zinc Sulfate Industry Volume (K Tons) Forecast, by Application 2020 & 2033
- Table 27: Vietnam Zinc Sulfate Industry Revenue (billion) Forecast, by Application 2020 & 2033
- Table 28: Vietnam Zinc Sulfate Industry Volume (K Tons) Forecast, by Application 2020 & 2033
- Table 29: Rest of Asia Pacific Zinc Sulfate Industry Revenue (billion) Forecast, by Application 2020 & 2033
- Table 30: Rest of Asia Pacific Zinc Sulfate Industry Volume (K Tons) Forecast, by Application 2020 & 2033
- Table 31: Global Zinc Sulfate Industry Revenue billion Forecast, by Type 2020 & 2033
- Table 32: Global Zinc Sulfate Industry Volume K Tons Forecast, by Type 2020 & 2033
- Table 33: Global Zinc Sulfate Industry Revenue billion Forecast, by End-user Industry 2020 & 2033
- Table 34: Global Zinc Sulfate Industry Volume K Tons Forecast, by End-user Industry 2020 & 2033
- Table 35: Global Zinc Sulfate Industry Revenue billion Forecast, by Country 2020 & 2033
- Table 36: Global Zinc Sulfate Industry Volume K Tons Forecast, by Country 2020 & 2033
- Table 37: United States Zinc Sulfate Industry Revenue (billion) Forecast, by Application 2020 & 2033
- Table 38: United States Zinc Sulfate Industry Volume (K Tons) Forecast, by Application 2020 & 2033
- Table 39: Canada Zinc Sulfate Industry Revenue (billion) Forecast, by Application 2020 & 2033
- Table 40: Canada Zinc Sulfate Industry Volume (K Tons) Forecast, by Application 2020 & 2033
- Table 41: Mexico Zinc Sulfate Industry Revenue (billion) Forecast, by Application 2020 & 2033
- Table 42: Mexico Zinc Sulfate Industry Volume (K Tons) Forecast, by Application 2020 & 2033
- Table 43: Global Zinc Sulfate Industry Revenue billion Forecast, by Type 2020 & 2033
- Table 44: Global Zinc Sulfate Industry Volume K Tons Forecast, by Type 2020 & 2033
- Table 45: Global Zinc Sulfate Industry Revenue billion Forecast, by End-user Industry 2020 & 2033
- Table 46: Global Zinc Sulfate Industry Volume K Tons Forecast, by End-user Industry 2020 & 2033
- Table 47: Global Zinc Sulfate Industry Revenue billion Forecast, by Country 2020 & 2033
- Table 48: Global Zinc Sulfate Industry Volume K Tons Forecast, by Country 2020 & 2033
- Table 49: Germany Zinc Sulfate Industry Revenue (billion) Forecast, by Application 2020 & 2033
- Table 50: Germany Zinc Sulfate Industry Volume (K Tons) Forecast, by Application 2020 & 2033
- Table 51: United Kingdom Zinc Sulfate Industry Revenue (billion) Forecast, by Application 2020 & 2033
- Table 52: United Kingdom Zinc Sulfate Industry Volume (K Tons) Forecast, by Application 2020 & 2033
- Table 53: France Zinc Sulfate Industry Revenue (billion) Forecast, by Application 2020 & 2033
- Table 54: France Zinc Sulfate Industry Volume (K Tons) Forecast, by Application 2020 & 2033
- Table 55: Italy Zinc Sulfate Industry Revenue (billion) Forecast, by Application 2020 & 2033
- Table 56: Italy Zinc Sulfate Industry Volume (K Tons) Forecast, by Application 2020 & 2033
- Table 57: Spain Zinc Sulfate Industry Revenue (billion) Forecast, by Application 2020 & 2033
- Table 58: Spain Zinc Sulfate Industry Volume (K Tons) Forecast, by Application 2020 & 2033
- Table 59: Turkey Zinc Sulfate Industry Revenue (billion) Forecast, by Application 2020 & 2033
- Table 60: Turkey Zinc Sulfate Industry Volume (K Tons) Forecast, by Application 2020 & 2033
- Table 61: Russia Zinc Sulfate Industry Revenue (billion) Forecast, by Application 2020 & 2033
- Table 62: Russia Zinc Sulfate Industry Volume (K Tons) Forecast, by Application 2020 & 2033
- Table 63: NORDIC Countries Zinc Sulfate Industry Revenue (billion) Forecast, by Application 2020 & 2033
- Table 64: NORDIC Countries Zinc Sulfate Industry Volume (K Tons) Forecast, by Application 2020 & 2033
- Table 65: Rest of Europe Zinc Sulfate Industry Revenue (billion) Forecast, by Application 2020 & 2033
- Table 66: Rest of Europe Zinc Sulfate Industry Volume (K Tons) Forecast, by Application 2020 & 2033
- Table 67: Global Zinc Sulfate Industry Revenue billion Forecast, by Type 2020 & 2033
- Table 68: Global Zinc Sulfate Industry Volume K Tons Forecast, by Type 2020 & 2033
- Table 69: Global Zinc Sulfate Industry Revenue billion Forecast, by End-user Industry 2020 & 2033
- Table 70: Global Zinc Sulfate Industry Volume K Tons Forecast, by End-user Industry 2020 & 2033
- Table 71: Global Zinc Sulfate Industry Revenue billion Forecast, by Country 2020 & 2033
- Table 72: Global Zinc Sulfate Industry Volume K Tons Forecast, by Country 2020 & 2033
- Table 73: Brazil Zinc Sulfate Industry Revenue (billion) Forecast, by Application 2020 & 2033
- Table 74: Brazil Zinc Sulfate Industry Volume (K Tons) Forecast, by Application 2020 & 2033
- Table 75: Argentina Zinc Sulfate Industry Revenue (billion) Forecast, by Application 2020 & 2033
- Table 76: Argentina Zinc Sulfate Industry Volume (K Tons) Forecast, by Application 2020 & 2033
- Table 77: Colombia Zinc Sulfate Industry Revenue (billion) Forecast, by Application 2020 & 2033
- Table 78: Colombia Zinc Sulfate Industry Volume (K Tons) Forecast, by Application 2020 & 2033
- Table 79: Rest of South America Zinc Sulfate Industry Revenue (billion) Forecast, by Application 2020 & 2033
- Table 80: Rest of South America Zinc Sulfate Industry Volume (K Tons) Forecast, by Application 2020 & 2033
- Table 81: Global Zinc Sulfate Industry Revenue billion Forecast, by Type 2020 & 2033
- Table 82: Global Zinc Sulfate Industry Volume K Tons Forecast, by Type 2020 & 2033
- Table 83: Global Zinc Sulfate Industry Revenue billion Forecast, by End-user Industry 2020 & 2033
- Table 84: Global Zinc Sulfate Industry Volume K Tons Forecast, by End-user Industry 2020 & 2033
- Table 85: Global Zinc Sulfate Industry Revenue billion Forecast, by Country 2020 & 2033
- Table 86: Global Zinc Sulfate Industry Volume K Tons Forecast, by Country 2020 & 2033
- Table 87: Saudi Arabia Zinc Sulfate Industry Revenue (billion) Forecast, by Application 2020 & 2033
- Table 88: Saudi Arabia Zinc Sulfate Industry Volume (K Tons) Forecast, by Application 2020 & 2033
- Table 89: Nigeria Zinc Sulfate Industry Revenue (billion) Forecast, by Application 2020 & 2033
- Table 90: Nigeria Zinc Sulfate Industry Volume (K Tons) Forecast, by Application 2020 & 2033
- Table 91: Qatar Zinc Sulfate Industry Revenue (billion) Forecast, by Application 2020 & 2033
- Table 92: Qatar Zinc Sulfate Industry Volume (K Tons) Forecast, by Application 2020 & 2033
- Table 93: Egypt Zinc Sulfate Industry Revenue (billion) Forecast, by Application 2020 & 2033
- Table 94: Egypt Zinc Sulfate Industry Volume (K Tons) Forecast, by Application 2020 & 2033
- Table 95: United Arab Emirates Zinc Sulfate Industry Revenue (billion) Forecast, by Application 2020 & 2033
- Table 96: United Arab Emirates Zinc Sulfate Industry Volume (K Tons) Forecast, by Application 2020 & 2033
- Table 97: South Africa Zinc Sulfate Industry Revenue (billion) Forecast, by Application 2020 & 2033
- Table 98: South Africa Zinc Sulfate Industry Volume (K Tons) Forecast, by Application 2020 & 2033
- Table 99: Rest of Middle East and Africa Zinc Sulfate Industry Revenue (billion) Forecast, by Application 2020 & 2033
- Table 100: Rest of Middle East and Africa Zinc Sulfate Industry Volume (K Tons) Forecast, by Application 2020 & 2033
Frequently Asked Questions
1. What is the projected Compound Annual Growth Rate (CAGR) of the Zinc Sulfate Industry?
The projected CAGR is approximately 5.5%.
2. Which companies are prominent players in the Zinc Sulfate Industry?
Key companies in the market include Zochem LLC, U S Zinc, Pan-Continental Chemical Co Ltd, Old Bridge Chemicals Inc, Intermediate Chemicals Company, Nexa, EverZinc, Rech Chemical Co Ltd, L Brüggemann GmbH & Co KG, Rubamin, Changsha Lantian Chemical Co Ltd, Weifang Longda Zinc Industry Co Ltd, Flaurea Chemicals, Silox India Pvt Ltd, Seyang Zinc Technology (Huai An) Co Ltd, TIB Chemicals AG, Global Chemical Co Ltd, Hakusui Tech, American Chemet Corporation.
3. What are the main segments of the Zinc Sulfate Industry?
The market segments include Type, End-user Industry.
4. Can you provide details about the market size?
The market size is estimated to be USD 2 billion as of 2022.
5. What are some drivers contributing to market growth?
Rising Utilization in Automotive Industry; Increasing Demand from the Rubber Tires Industry.
6. What are the notable trends driving market growth?
Rubber Processing Segment to Dominate the Market.
7. Are there any restraints impacting market growth?
Health Hazard Related to Zinc Chemical.
8. Can you provide examples of recent developments in the market?
Recent developments in the market studied will be covered in the complete report.
9. What pricing options are available for accessing the report?
Pricing options include single-user, multi-user, and enterprise licenses priced at USD 4750, USD 5250, and USD 8750 respectively.
10. Is the market size provided in terms of value or volume?
The market size is provided in terms of value, measured in billion and volume, measured in K Tons.
11. Are there any specific market keywords associated with the report?
Yes, the market keyword associated with the report is "Zinc Sulfate Industry," which aids in identifying and referencing the specific market segment covered.
12. How do I determine which pricing option suits my needs best?
The pricing options vary based on user requirements and access needs. Individual users may opt for single-user licenses, while businesses requiring broader access may choose multi-user or enterprise licenses for cost-effective access to the report.
13. Are there any additional resources or data provided in the Zinc Sulfate Industry report?
While the report offers comprehensive insights, it's advisable to review the specific contents or supplementary materials provided to ascertain if additional resources or data are available.
14. How can I stay updated on further developments or reports in the Zinc Sulfate Industry?
To stay informed about further developments, trends, and reports in the Zinc Sulfate Industry, consider subscribing to industry newsletters, following relevant companies and organizations, or regularly checking reputable industry news sources and publications.
Methodology
Step 1 - Identification of Relevant Samples Size from Population Database


Step 2 - Approaches for Defining Global Market Size (Value, Volume* & Price*)

Note*: In applicable scenarios
Step 3 - Data Sources
Primary Research
- Web Analytics
- Survey Reports
- Research Institute
- Latest Research Reports
- Opinion Leaders
Secondary Research
- Annual Reports
- White Paper
- Latest Press Release
- Industry Association
- Paid Database
- Investor Presentations

Step 4 - Data Triangulation
Involves using different sources of information in order to increase the validity of a study
These sources are likely to be stakeholders in a program - participants, other researchers, program staff, other community members, and so on.
Then we put all data in single framework & apply various statistical tools to find out the dynamic on the market.
During the analysis stage, feedback from the stakeholder groups would be compared to determine areas of agreement as well as areas of divergence