Key Insights
The global 3D Cardiac Mapping Systems Market is poised for substantial expansion, projected to reach an impressive $538.60 million by 2025, driven by a robust Compound Annual Growth Rate (CAGR) of 11.40% during the forecast period of 2025-2033. This significant growth trajectory is underpinned by a confluence of factors, including the escalating prevalence of cardiovascular diseases worldwide and the increasing adoption of minimally invasive procedures. Technological advancements are at the forefront of this market dynamism, with innovations in Electroanatomical Mapping (EAM) systems and advanced Real-time Positional Management (RPM) solutions enhancing diagnostic accuracy and therapeutic efficacy. The demand for sophisticated diagnostic tools is further fueled by an aging global population, a key demographic segment more susceptible to cardiac arrhythmias and other heart conditions. Hospitals and specialized cardiac clinics are leading the charge in adopting these cutting-edge systems, recognizing their potential to improve patient outcomes and streamline workflows. The integration of advanced imaging and navigation technologies within these mapping systems is creating new avenues for precise treatment planning and execution in complex cardiac interventions, further solidifying their critical role in modern cardiology.
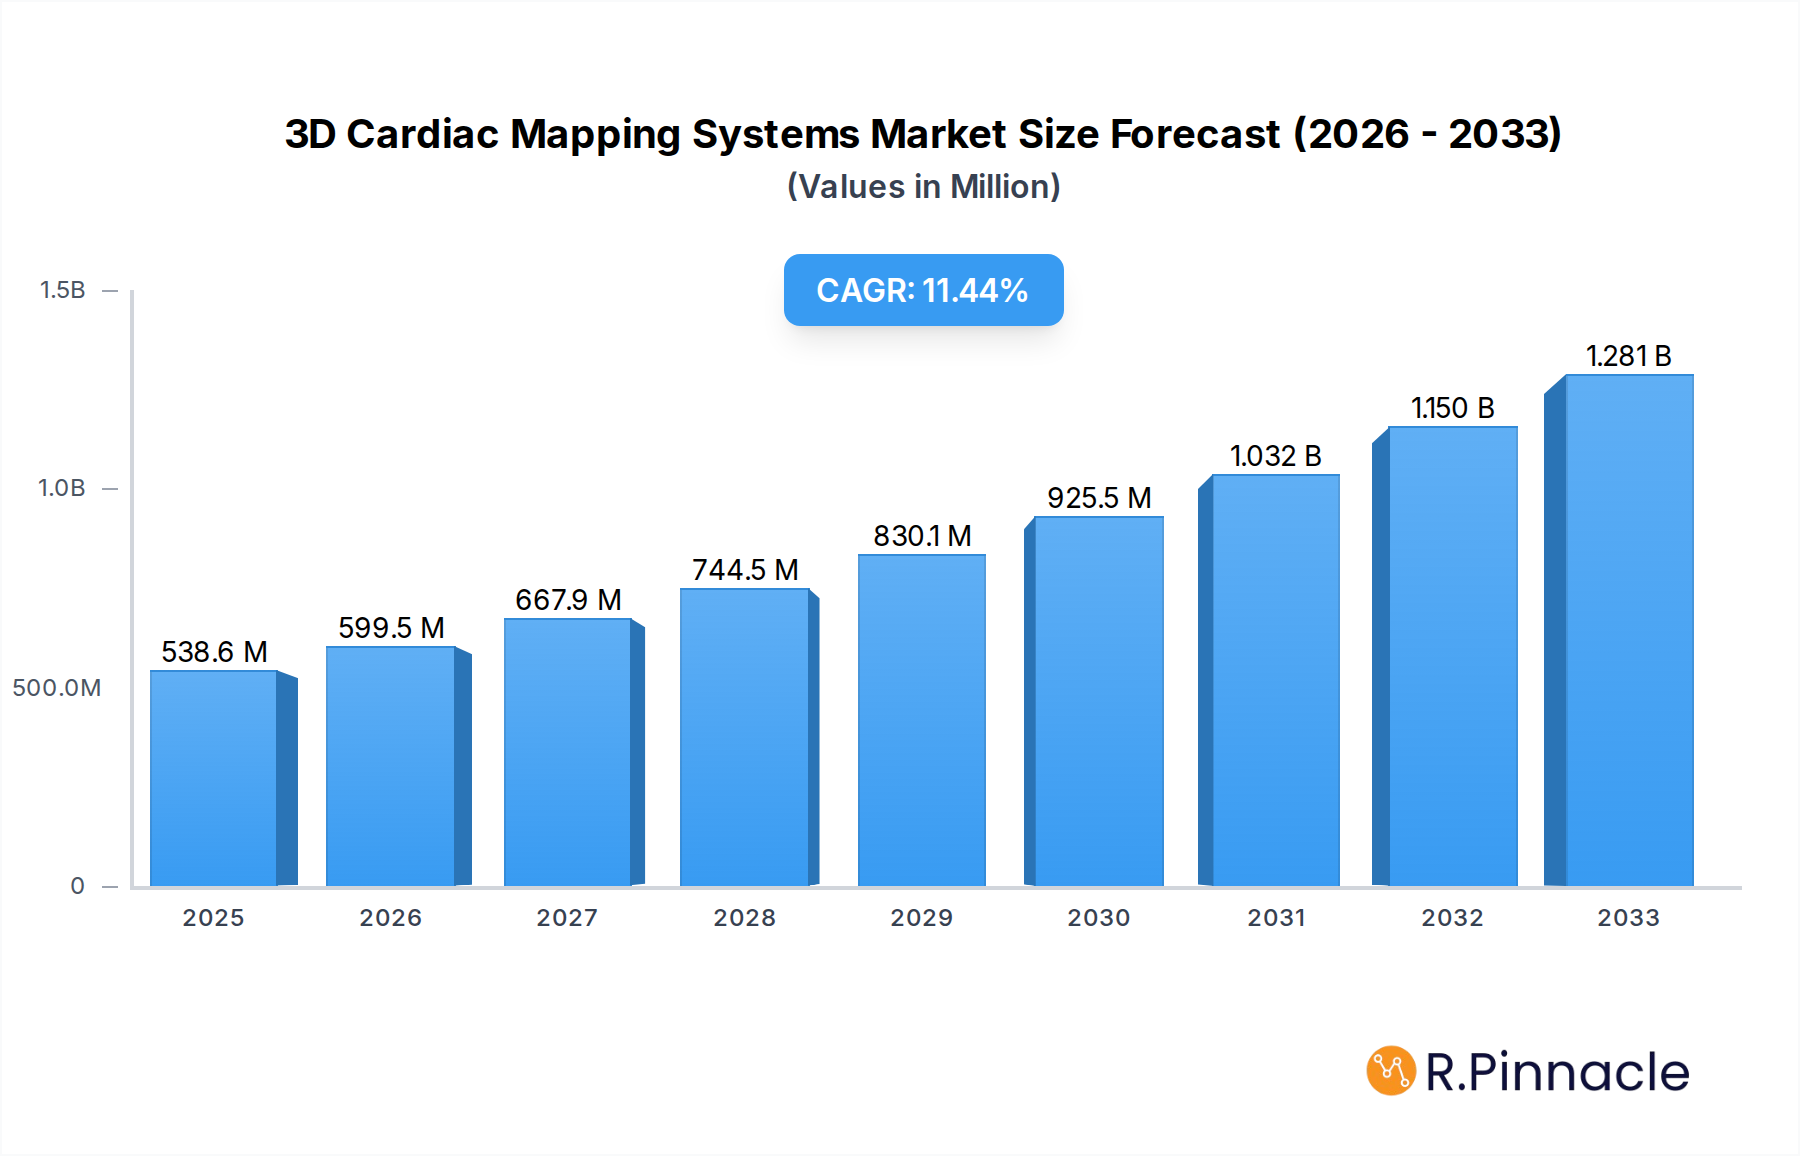
3D Cardiac Mapping Systems Market Market Size (In Million)
The market's upward momentum is further bolstered by the continuous refinement of mapping technologies, including the development of more intuitive Basket Catheter Mapping systems that offer comprehensive atrial coverage. While the market is experiencing strong growth, certain factors could influence its trajectory. The high initial investment cost for these advanced systems and the need for specialized training for healthcare professionals may present adoption challenges, particularly in resource-constrained regions. However, these restraints are being gradually mitigated by increasing healthcare expenditure and strategic partnerships aimed at improving accessibility. Key players such as Medtronic, Abbott, and Siemens Healthineers AG are actively investing in research and development to introduce next-generation mapping solutions, focusing on enhanced interoperability and AI-driven insights. The expanding market landscape also presents opportunities for emerging companies to innovate and capture market share, particularly in regions like Asia Pacific, which is witnessing rapid healthcare infrastructure development and a growing demand for advanced medical technologies. The increasing focus on patient-centric care and the desire for improved treatment personalization are key trends that will continue to shape the evolution of 3D Cardiac Mapping Systems.

3D Cardiac Mapping Systems Market Company Market Share
3D Cardiac Mapping Systems Market: Comprehensive Analysis and Future Projections (2019-2033)
This in-depth report provides a detailed examination of the 3D cardiac mapping systems market, offering actionable insights for industry stakeholders. Spanning from 2019 to 2033, with a base year of 2025, the study forecasts market trends and dynamics through 2033. Leveraging high-ranking keywords such as "cardiac mapping technology," "electrophysiology mapping," "3D heart mapping systems," and "cardiac ablation," this report is meticulously crafted to enhance search visibility and attract professionals actively involved in this dynamic sector. Understand the competitive landscape, technological advancements, regional dominance, and future potential of this critical medical device market.
3D Cardiac Mapping Systems Market Structure & Innovation Trends
The 3D cardiac mapping systems market is characterized by a moderate concentration, with a few key players holding significant market share. Innovation is a primary driver, fueled by the increasing prevalence of cardiac arrhythmias and the demand for less invasive, more precise treatment modalities. Key innovation drivers include advancements in sensor technology, artificial intelligence for data analysis, and the integration of real-time imaging. Regulatory frameworks, while stringent, are also evolving to accommodate new technologies.
- Market Concentration: Dominated by established players with strong R&D capabilities.
- Innovation Drivers: Growing burden of cardiovascular diseases, technological sophistication, demand for minimally invasive procedures.
- Regulatory Frameworks: FDA and CE mark approvals are critical for market entry.
- Product Substitutes: While direct substitutes are limited, advancements in conventional diagnostic tools pose indirect competition.
- End-User Demographics: Primarily hospitals with specialized cardiology departments and electrophysiology labs.
- M&A Activities: Strategic acquisitions and partnerships are observed as companies aim to expand their product portfolios and market reach. M&A deal values are projected to be in the hundreds of Millions, reflecting the strategic importance of this market.
3D Cardiac Mapping Systems Market Market Dynamics & Trends
The global 3D cardiac mapping systems market is experiencing robust growth, driven by a confluence of escalating cardiovascular disease burdens, rapid technological advancements, and an increasing preference for minimally invasive cardiac procedures. The market is projected to witness a Compound Annual Growth Rate (CAGR) of approximately 8.5% over the forecast period (2025-2033). This growth is underpinned by a significant increase in the incidence of atrial fibrillation and other complex arrhythmias, necessitating sophisticated diagnostic and therapeutic tools. The penetration of advanced electrophysiology (EP) labs worldwide is a key enabler, facilitating the adoption of these high-end mapping systems.
Technological disruptions are at the forefront of market evolution. The transition from 2D to 3D mapping has revolutionized the treatment of complex cardiac arrhythmias, offering unparalleled precision and improved patient outcomes. Real-time positional management (RPM) systems and advanced sensor technologies integrated into mapping catheters are enhancing the accuracy and efficiency of ablation procedures. Furthermore, the integration of artificial intelligence (AI) and machine learning (ML) algorithms is beginning to play a crucial role in data interpretation and treatment planning, promising further improvements in diagnostic capabilities and therapeutic efficacy.
Consumer preferences, in this context, translate to healthcare providers and patients demanding safer, more effective, and less intrusive treatment options. 3D cardiac mapping systems directly address these demands by enabling cardiologists to visualize the heart's electrical activity in three dimensions, pinpointing arrhythmogenic sources with greater accuracy and reducing the need for repeat procedures. This leads to shorter recovery times and improved quality of life for patients.
Competitive dynamics within the market are intense, characterized by continuous product innovation, strategic partnerships, and aggressive marketing efforts by leading players. Companies are investing heavily in research and development to introduce next-generation mapping systems with enhanced features, such as higher resolution, greater flexibility, and improved user interfaces. The market penetration of these advanced systems is steadily increasing as healthcare institutions recognize their clinical and economic benefits. Emerging economies are also presenting significant growth opportunities as their healthcare infrastructure develops and the demand for advanced cardiac care rises.
Dominant Regions & Segments in 3D Cardiac Mapping Systems Market
North America currently holds a dominant position in the global 3D cardiac mapping systems market, driven by a high prevalence of cardiovascular diseases, robust healthcare infrastructure, and significant investments in R&D and advanced medical technologies. The United States, in particular, contributes substantially to this dominance due to a well-established healthcare system, high patient awareness, and a strong reimbursement framework for complex electrophysiology procedures.
- Leading Region: North America, with the United States at the forefront.
- Key Drivers: High incidence of cardiac arrhythmias, advanced healthcare infrastructure, strong R&D investments, favorable reimbursement policies.
- Economic Policies: Government initiatives promoting advanced medical technology adoption and patient access.
- Infrastructure: Presence of numerous specialized cardiology centers and hospitals equipped with cutting-edge EP labs.
Europe is another significant market, characterized by a well-developed healthcare system and increasing adoption of minimally invasive cardiac procedures. Countries like Germany, the UK, and France are key contributors, supported by government funding for healthcare innovation and a growing aging population, which is more susceptible to cardiac conditions.
Asia Pacific presents the fastest-growing market, fueled by a rapidly expanding middle class, increasing healthcare expenditure, and a rising burden of cardiovascular diseases. Countries like China and India are witnessing substantial growth due to improving healthcare infrastructure, increasing awareness about cardiac health, and government efforts to enhance access to advanced medical treatments.
In terms of Technology, Electroanatomical Mapping (EAM) is the largest and most dominant segment.
- Electroanatomical Mapping (EAM): This technology, which creates detailed 3D electrical maps of the heart, is fundamental to modern cardiac ablation procedures. Its widespread adoption is driven by its superior accuracy and ability to guide complex ablations. The market size for EAM is estimated to be in the billions of Dollars, with a projected CAGR of around 9%.
- Basket Catheter Mapping: While less prevalent than EAM, basket catheter mapping offers a unique approach for visualizing electrical activity, particularly in specific cardiac chambers. Its market share is smaller but growing as new applications and improved catheter designs emerge.
- Real-time Positional Management (RPM): RPM systems are crucial for accurate catheter navigation within the heart. These systems are integrated into most advanced EAM platforms, driving their growth as a critical component of the overall mapping ecosystem.
Regarding End User, Hospitals are the dominant segment in the 3D cardiac mapping systems market.
- Hospitals: These institutions possess the specialized infrastructure, trained personnel, and patient volume required for complex electrophysiology procedures involving 3D cardiac mapping. The market size for hospital end-users is substantial, representing the bulk of revenue.
- Clinics: While some specialized cardiac clinics are adopting these technologies, their penetration is lower compared to hospitals due to infrastructure and staffing limitations. However, the growth of outpatient cardiac care is a positive trend for this segment.
- Diagnostic Centers: Primarily focused on non-invasive diagnostics, diagnostic centers have a limited role in the direct adoption of 3D cardiac mapping systems, which are primarily therapeutic tools used during invasive procedures.
3D Cardiac Mapping Systems Market Product Innovations
Product innovation in the 3D cardiac mapping systems market is characterized by the development of more sophisticated and user-friendly technologies. These innovations focus on enhancing imaging resolution, improving catheter maneuverability, and integrating advanced algorithms for data analysis. Key competitive advantages stem from increased procedural efficiency, reduced fluoroscopy times, and improved patient safety and outcomes. The trend towards AI-powered mapping and the development of integrated systems that combine imaging, navigation, and ablation are shaping the future of this market, allowing for more personalized and effective treatment of cardiac arrhythmias.
Report Scope & Segmentation Analysis
This report segments the 3D cardiac mapping systems market based on Technology and End User.
Technology:
- Electroanatomical Mapping: This segment is projected to dominate the market due to its widespread adoption in complex cardiac ablation procedures. Its market size is estimated to be over $3 Billion, with a projected CAGR of approximately 9% over the forecast period.
- Basket Catheter Mapping: This segment, while smaller, is expected to witness steady growth, driven by advancements in catheter design and its specific applications. Its market size is projected to reach over $500 Million by 2033.
- Real-time Positional Management: As an integral component of advanced mapping systems, this segment is experiencing robust growth, mirroring the overall market expansion. Its market size is estimated to be over $1 Billion.
End User:
- Hospitals: This segment represents the largest share of the market, driven by the concentration of electrophysiology labs and the high volume of complex cardiac procedures performed. Its market size is projected to exceed $5 Billion by 2033.
- Clinics: While currently a smaller segment, specialized cardiac clinics are expected to show increasing adoption, contributing to a growing market share.
- Diagnostic Centers: This segment has a limited direct role in 3D cardiac mapping systems, as these are primarily therapeutic tools.
Key Drivers of 3D Cardiac Mapping Systems Market Growth
The growth of the 3D cardiac mapping systems market is propelled by several key factors. The escalating global burden of cardiovascular diseases, particularly arrhythmias like atrial fibrillation, creates a constant demand for effective diagnostic and therapeutic solutions. Technological advancements, including the development of higher resolution mapping, AI-driven analytics, and more maneuverable catheters, are significantly enhancing the efficacy and safety of cardiac procedures. Furthermore, a growing preference for minimally invasive treatments by both patients and clinicians, coupled with favorable reimbursement policies for electrophysiology procedures in many developed nations, contributes to market expansion.
Challenges in the 3D Cardiac Mapping Systems Market Sector
Despite its robust growth, the 3D cardiac mapping systems market faces several challenges. High initial investment costs for sophisticated mapping systems and the associated infrastructure can be a significant barrier, especially for smaller healthcare facilities or those in developing economies. Stringent regulatory approvals for new devices and technologies add to the time and cost of market entry. Furthermore, the need for highly skilled and trained electrophysiologists and support staff to operate these complex systems can lead to workforce limitations. Intense competition among existing players and the threat of disruptive technologies also present ongoing challenges that necessitate continuous innovation and strategic adaptation.
Emerging Opportunities in 3D Cardiac Mapping Systems Market
Emerging opportunities in the 3D cardiac mapping systems market are diverse and promising. The expanding healthcare infrastructure and increasing disposable incomes in emerging economies, particularly in Asia Pacific and Latin America, present a significant untapped market. Advancements in AI and machine learning offer opportunities for developing more predictive and personalized treatment algorithms, further enhancing diagnostic accuracy and therapeutic outcomes. The integration of robotic-assisted navigation with 3D mapping systems holds potential for greater precision and reduced physician fatigue. Moreover, the development of novel catheter designs with enhanced sensing capabilities and improved patient comfort could unlock new therapeutic avenues and expand market reach.
Leading Players in the 3D Cardiac Mapping Systems Market Market
- Olympus Corporation
- Medtronic
- GE Healthcare
- Siemens Healthineers AG
- Smith + Nephew
- Abbott
- Intuitive Surgical Inc
- Koninklijke Philips NV
- Stryker Corporation
- Zimmer Biomet
Key Developments in 3D Cardiac Mapping Systems Market Industry
- May 2024: Biosense Webster Inc., a cardiac arrhythmia treatment devices provider and part of Johnson & Johnson MedTech, launched the CARTO 3 System Version 8, the latest version of the company’s leading three-dimension (3D) heart mapping system used in cardiac ablation procedures.
- March 2023: Medtronic received a CE (Conformité Européenne) Mark for the Affer Mapping and Ablation System, including the Sphere-9 Catheter and the Affera Prism-1 Mapping Software.
Future Outlook for 3D Cardiac Mapping Systems Market Market
The future outlook for the 3D cardiac mapping systems market is exceptionally bright, with continued robust growth anticipated. The increasing global prevalence of cardiovascular diseases, coupled with relentless technological innovation, will continue to drive demand for advanced mapping solutions. The integration of AI and machine learning is poised to revolutionize data analysis and treatment planning, leading to more personalized and effective cardiac care. Emerging markets represent significant untapped potential, offering substantial growth opportunities as healthcare infrastructures mature and access to advanced medical technologies expands. Strategic collaborations, product differentiation, and a focus on user-friendly interfaces will be crucial for market leaders to maintain their competitive edge and capitalize on the evolving landscape of cardiac electrophysiology. The market is projected to expand significantly, with new applications and improved functionalities continuously emerging.
3D Cardiac Mapping Systems Market Segmentation
-
1. Technology
- 1.1. Electroanatomical Mapping
- 1.2. Basket Catheter Mapping
- 1.3. Real-time Positional Management
-
2. End User
- 2.1. Hospitals
- 2.2. Clinics
- 2.3. Diagnostic Centers
3D Cardiac Mapping Systems Market Segmentation By Geography
-
1. North America
- 1.1. United States
- 1.2. Canada
- 1.3. Mexico
-
2. Europe
- 2.1. Germany
- 2.2. United Kingdom
- 2.3. France
- 2.4. Italy
- 2.5. Spain
- 2.6. Rest of Europe
-
3. Asia Pacific
- 3.1. China
- 3.2. Japan
- 3.3. India
- 3.4. Australia
- 3.5. South Korea
- 3.6. Rest of Asia Pacific
-
4. Middle East and Africa
- 4.1. GCC
- 4.2. South Africa
- 4.3. Rest of Middle East and Africa
-
5. South America
- 5.1. Brazil
- 5.2. Argentina
- 5.3. Rest of South America

3D Cardiac Mapping Systems Market Regional Market Share
Geographic Coverage of 3D Cardiac Mapping Systems Market
3D Cardiac Mapping Systems Market REPORT HIGHLIGHTS
| Aspects | Details |
|---|---|
| Study Period | 2020-2034 |
| Base Year | 2025 |
| Estimated Year | 2026 |
| Forecast Period | 2026-2034 |
| Historical Period | 2020-2025 |
| Growth Rate | CAGR of 11.40% from 2020-2034 |
| Segmentation |
|
Table of Contents
- 1. Introduction
- 1.1. Research Scope
- 1.2. Market Segmentation
- 1.3. Research Objective
- 1.4. Definitions and Assumptions
- 2. Executive Summary
- 2.1. Market Snapshot
- 3. Market Dynamics
- 3.1. Market Drivers
- 3.2. Market Restrains
- 3.3. Market Trends
- 3.4. Market Opportunities
- 4. Market Factor Analysis
- 4.1. Porters Five Forces
- 4.1.1. Bargaining Power of Suppliers
- 4.1.2. Bargaining Power of Buyers
- 4.1.3. Threat of New Entrants
- 4.1.4. Threat of Substitutes
- 4.1.5. Competitive Rivalry
- 4.2. PESTEL analysis
- 4.3. BCG Analysis
- 4.3.1. Stars (High Growth, High Market Share)
- 4.3.2. Cash Cows (Low Growth, High Market Share)
- 4.3.3. Question Mark (High Growth, Low Market Share)
- 4.3.4. Dogs (Low Growth, Low Market Share)
- 4.4. Ansoff Matrix Analysis
- 4.5. Supply Chain Analysis
- 4.6. Regulatory Landscape
- 4.7. Current Market Potential and Opportunity Assessment (TAM–SAM–SOM Framework)
- 4.8. PRI Analyst Note
- 4.1. Porters Five Forces
- 5. Market Analysis, Insights and Forecast 2021-2033
- 5.1. Market Analysis, Insights and Forecast - by Technology
- 5.1.1. Electroanatomical Mapping
- 5.1.2. Basket Catheter Mapping
- 5.1.3. Real-time Positional Management
- 5.2. Market Analysis, Insights and Forecast - by End User
- 5.2.1. Hospitals
- 5.2.2. Clinics
- 5.2.3. Diagnostic Centers
- 5.3. Market Analysis, Insights and Forecast - by Region
- 5.3.1. North America
- 5.3.2. Europe
- 5.3.3. Asia Pacific
- 5.3.4. Middle East and Africa
- 5.3.5. South America
- 5.1. Market Analysis, Insights and Forecast - by Technology
- 6. Global 3D Cardiac Mapping Systems Market Analysis, Insights and Forecast, 2021-2033
- 6.1. Market Analysis, Insights and Forecast - by Technology
- 6.1.1. Electroanatomical Mapping
- 6.1.2. Basket Catheter Mapping
- 6.1.3. Real-time Positional Management
- 6.2. Market Analysis, Insights and Forecast - by End User
- 6.2.1. Hospitals
- 6.2.2. Clinics
- 6.2.3. Diagnostic Centers
- 6.1. Market Analysis, Insights and Forecast - by Technology
- 7. North America 3D Cardiac Mapping Systems Market Analysis, Insights and Forecast, 2020-2032
- 7.1. Market Analysis, Insights and Forecast - by Technology
- 7.1.1. Electroanatomical Mapping
- 7.1.2. Basket Catheter Mapping
- 7.1.3. Real-time Positional Management
- 7.2. Market Analysis, Insights and Forecast - by End User
- 7.2.1. Hospitals
- 7.2.2. Clinics
- 7.2.3. Diagnostic Centers
- 7.1. Market Analysis, Insights and Forecast - by Technology
- 8. Europe 3D Cardiac Mapping Systems Market Analysis, Insights and Forecast, 2020-2032
- 8.1. Market Analysis, Insights and Forecast - by Technology
- 8.1.1. Electroanatomical Mapping
- 8.1.2. Basket Catheter Mapping
- 8.1.3. Real-time Positional Management
- 8.2. Market Analysis, Insights and Forecast - by End User
- 8.2.1. Hospitals
- 8.2.2. Clinics
- 8.2.3. Diagnostic Centers
- 8.1. Market Analysis, Insights and Forecast - by Technology
- 9. Asia Pacific 3D Cardiac Mapping Systems Market Analysis, Insights and Forecast, 2020-2032
- 9.1. Market Analysis, Insights and Forecast - by Technology
- 9.1.1. Electroanatomical Mapping
- 9.1.2. Basket Catheter Mapping
- 9.1.3. Real-time Positional Management
- 9.2. Market Analysis, Insights and Forecast - by End User
- 9.2.1. Hospitals
- 9.2.2. Clinics
- 9.2.3. Diagnostic Centers
- 9.1. Market Analysis, Insights and Forecast - by Technology
- 10. Middle East and Africa 3D Cardiac Mapping Systems Market Analysis, Insights and Forecast, 2020-2032
- 10.1. Market Analysis, Insights and Forecast - by Technology
- 10.1.1. Electroanatomical Mapping
- 10.1.2. Basket Catheter Mapping
- 10.1.3. Real-time Positional Management
- 10.2. Market Analysis, Insights and Forecast - by End User
- 10.2.1. Hospitals
- 10.2.2. Clinics
- 10.2.3. Diagnostic Centers
- 10.1. Market Analysis, Insights and Forecast - by Technology
- 11. South America 3D Cardiac Mapping Systems Market Analysis, Insights and Forecast, 2020-2032
- 11.1. Market Analysis, Insights and Forecast - by Technology
- 11.1.1. Electroanatomical Mapping
- 11.1.2. Basket Catheter Mapping
- 11.1.3. Real-time Positional Management
- 11.2. Market Analysis, Insights and Forecast - by End User
- 11.2.1. Hospitals
- 11.2.2. Clinics
- 11.2.3. Diagnostic Centers
- 11.1. Market Analysis, Insights and Forecast - by Technology
- 12. Competitive Analysis
- 12.1. Company Profiles
- 12.1.1 Olympus Corporation
- 12.1.1.1. Company Overview
- 12.1.1.2. Products
- 12.1.1.3. Company Financials
- 12.1.1.4. SWOT Analysis
- 12.1.2 Medtronic
- 12.1.2.1. Company Overview
- 12.1.2.2. Products
- 12.1.2.3. Company Financials
- 12.1.2.4. SWOT Analysis
- 12.1.3 GE Healthcare
- 12.1.3.1. Company Overview
- 12.1.3.2. Products
- 12.1.3.3. Company Financials
- 12.1.3.4. SWOT Analysis
- 12.1.4 Siemens Healthineers AG
- 12.1.4.1. Company Overview
- 12.1.4.2. Products
- 12.1.4.3. Company Financials
- 12.1.4.4. SWOT Analysis
- 12.1.5 Smith + Nephew
- 12.1.5.1. Company Overview
- 12.1.5.2. Products
- 12.1.5.3. Company Financials
- 12.1.5.4. SWOT Analysis
- 12.1.6 Abbott
- 12.1.6.1. Company Overview
- 12.1.6.2. Products
- 12.1.6.3. Company Financials
- 12.1.6.4. SWOT Analysis
- 12.1.7 Intuitive Surgical Inc
- 12.1.7.1. Company Overview
- 12.1.7.2. Products
- 12.1.7.3. Company Financials
- 12.1.7.4. SWOT Analysis
- 12.1.8 Koninklijke Philips NV
- 12.1.8.1. Company Overview
- 12.1.8.2. Products
- 12.1.8.3. Company Financials
- 12.1.8.4. SWOT Analysis
- 12.1.9 Stryker Corporation
- 12.1.9.1. Company Overview
- 12.1.9.2. Products
- 12.1.9.3. Company Financials
- 12.1.9.4. SWOT Analysis
- 12.1.10 Zimmer Biomet*List Not Exhaustive
- 12.1.10.1. Company Overview
- 12.1.10.2. Products
- 12.1.10.3. Company Financials
- 12.1.10.4. SWOT Analysis
- 12.1.1 Olympus Corporation
- 12.2. Market Entropy
- 12.2.1 Company's Key Areas Served
- 12.2.2 Recent Developments
- 12.3. Company Market Share Analysis 2025
- 12.3.1 Top 5 Companies Market Share Analysis
- 12.3.2 Top 3 Companies Market Share Analysis
- 12.4. List of Potential Customers
- 13. Research Methodology
List of Figures
- Figure 1: Global 3D Cardiac Mapping Systems Market Revenue Breakdown (Million, %) by Region 2025 & 2033
- Figure 2: Global 3D Cardiac Mapping Systems Market Volume Breakdown (Million, %) by Region 2025 & 2033
- Figure 3: North America 3D Cardiac Mapping Systems Market Revenue (Million), by Technology 2025 & 2033
- Figure 4: North America 3D Cardiac Mapping Systems Market Volume (Million), by Technology 2025 & 2033
- Figure 5: North America 3D Cardiac Mapping Systems Market Revenue Share (%), by Technology 2025 & 2033
- Figure 6: North America 3D Cardiac Mapping Systems Market Volume Share (%), by Technology 2025 & 2033
- Figure 7: North America 3D Cardiac Mapping Systems Market Revenue (Million), by End User 2025 & 2033
- Figure 8: North America 3D Cardiac Mapping Systems Market Volume (Million), by End User 2025 & 2033
- Figure 9: North America 3D Cardiac Mapping Systems Market Revenue Share (%), by End User 2025 & 2033
- Figure 10: North America 3D Cardiac Mapping Systems Market Volume Share (%), by End User 2025 & 2033
- Figure 11: North America 3D Cardiac Mapping Systems Market Revenue (Million), by Country 2025 & 2033
- Figure 12: North America 3D Cardiac Mapping Systems Market Volume (Million), by Country 2025 & 2033
- Figure 13: North America 3D Cardiac Mapping Systems Market Revenue Share (%), by Country 2025 & 2033
- Figure 14: North America 3D Cardiac Mapping Systems Market Volume Share (%), by Country 2025 & 2033
- Figure 15: Europe 3D Cardiac Mapping Systems Market Revenue (Million), by Technology 2025 & 2033
- Figure 16: Europe 3D Cardiac Mapping Systems Market Volume (Million), by Technology 2025 & 2033
- Figure 17: Europe 3D Cardiac Mapping Systems Market Revenue Share (%), by Technology 2025 & 2033
- Figure 18: Europe 3D Cardiac Mapping Systems Market Volume Share (%), by Technology 2025 & 2033
- Figure 19: Europe 3D Cardiac Mapping Systems Market Revenue (Million), by End User 2025 & 2033
- Figure 20: Europe 3D Cardiac Mapping Systems Market Volume (Million), by End User 2025 & 2033
- Figure 21: Europe 3D Cardiac Mapping Systems Market Revenue Share (%), by End User 2025 & 2033
- Figure 22: Europe 3D Cardiac Mapping Systems Market Volume Share (%), by End User 2025 & 2033
- Figure 23: Europe 3D Cardiac Mapping Systems Market Revenue (Million), by Country 2025 & 2033
- Figure 24: Europe 3D Cardiac Mapping Systems Market Volume (Million), by Country 2025 & 2033
- Figure 25: Europe 3D Cardiac Mapping Systems Market Revenue Share (%), by Country 2025 & 2033
- Figure 26: Europe 3D Cardiac Mapping Systems Market Volume Share (%), by Country 2025 & 2033
- Figure 27: Asia Pacific 3D Cardiac Mapping Systems Market Revenue (Million), by Technology 2025 & 2033
- Figure 28: Asia Pacific 3D Cardiac Mapping Systems Market Volume (Million), by Technology 2025 & 2033
- Figure 29: Asia Pacific 3D Cardiac Mapping Systems Market Revenue Share (%), by Technology 2025 & 2033
- Figure 30: Asia Pacific 3D Cardiac Mapping Systems Market Volume Share (%), by Technology 2025 & 2033
- Figure 31: Asia Pacific 3D Cardiac Mapping Systems Market Revenue (Million), by End User 2025 & 2033
- Figure 32: Asia Pacific 3D Cardiac Mapping Systems Market Volume (Million), by End User 2025 & 2033
- Figure 33: Asia Pacific 3D Cardiac Mapping Systems Market Revenue Share (%), by End User 2025 & 2033
- Figure 34: Asia Pacific 3D Cardiac Mapping Systems Market Volume Share (%), by End User 2025 & 2033
- Figure 35: Asia Pacific 3D Cardiac Mapping Systems Market Revenue (Million), by Country 2025 & 2033
- Figure 36: Asia Pacific 3D Cardiac Mapping Systems Market Volume (Million), by Country 2025 & 2033
- Figure 37: Asia Pacific 3D Cardiac Mapping Systems Market Revenue Share (%), by Country 2025 & 2033
- Figure 38: Asia Pacific 3D Cardiac Mapping Systems Market Volume Share (%), by Country 2025 & 2033
- Figure 39: Middle East and Africa 3D Cardiac Mapping Systems Market Revenue (Million), by Technology 2025 & 2033
- Figure 40: Middle East and Africa 3D Cardiac Mapping Systems Market Volume (Million), by Technology 2025 & 2033
- Figure 41: Middle East and Africa 3D Cardiac Mapping Systems Market Revenue Share (%), by Technology 2025 & 2033
- Figure 42: Middle East and Africa 3D Cardiac Mapping Systems Market Volume Share (%), by Technology 2025 & 2033
- Figure 43: Middle East and Africa 3D Cardiac Mapping Systems Market Revenue (Million), by End User 2025 & 2033
- Figure 44: Middle East and Africa 3D Cardiac Mapping Systems Market Volume (Million), by End User 2025 & 2033
- Figure 45: Middle East and Africa 3D Cardiac Mapping Systems Market Revenue Share (%), by End User 2025 & 2033
- Figure 46: Middle East and Africa 3D Cardiac Mapping Systems Market Volume Share (%), by End User 2025 & 2033
- Figure 47: Middle East and Africa 3D Cardiac Mapping Systems Market Revenue (Million), by Country 2025 & 2033
- Figure 48: Middle East and Africa 3D Cardiac Mapping Systems Market Volume (Million), by Country 2025 & 2033
- Figure 49: Middle East and Africa 3D Cardiac Mapping Systems Market Revenue Share (%), by Country 2025 & 2033
- Figure 50: Middle East and Africa 3D Cardiac Mapping Systems Market Volume Share (%), by Country 2025 & 2033
- Figure 51: South America 3D Cardiac Mapping Systems Market Revenue (Million), by Technology 2025 & 2033
- Figure 52: South America 3D Cardiac Mapping Systems Market Volume (Million), by Technology 2025 & 2033
- Figure 53: South America 3D Cardiac Mapping Systems Market Revenue Share (%), by Technology 2025 & 2033
- Figure 54: South America 3D Cardiac Mapping Systems Market Volume Share (%), by Technology 2025 & 2033
- Figure 55: South America 3D Cardiac Mapping Systems Market Revenue (Million), by End User 2025 & 2033
- Figure 56: South America 3D Cardiac Mapping Systems Market Volume (Million), by End User 2025 & 2033
- Figure 57: South America 3D Cardiac Mapping Systems Market Revenue Share (%), by End User 2025 & 2033
- Figure 58: South America 3D Cardiac Mapping Systems Market Volume Share (%), by End User 2025 & 2033
- Figure 59: South America 3D Cardiac Mapping Systems Market Revenue (Million), by Country 2025 & 2033
- Figure 60: South America 3D Cardiac Mapping Systems Market Volume (Million), by Country 2025 & 2033
- Figure 61: South America 3D Cardiac Mapping Systems Market Revenue Share (%), by Country 2025 & 2033
- Figure 62: South America 3D Cardiac Mapping Systems Market Volume Share (%), by Country 2025 & 2033
List of Tables
- Table 1: Global 3D Cardiac Mapping Systems Market Revenue Million Forecast, by Technology 2020 & 2033
- Table 2: Global 3D Cardiac Mapping Systems Market Volume Million Forecast, by Technology 2020 & 2033
- Table 3: Global 3D Cardiac Mapping Systems Market Revenue Million Forecast, by End User 2020 & 2033
- Table 4: Global 3D Cardiac Mapping Systems Market Volume Million Forecast, by End User 2020 & 2033
- Table 5: Global 3D Cardiac Mapping Systems Market Revenue Million Forecast, by Region 2020 & 2033
- Table 6: Global 3D Cardiac Mapping Systems Market Volume Million Forecast, by Region 2020 & 2033
- Table 7: Global 3D Cardiac Mapping Systems Market Revenue Million Forecast, by Technology 2020 & 2033
- Table 8: Global 3D Cardiac Mapping Systems Market Volume Million Forecast, by Technology 2020 & 2033
- Table 9: Global 3D Cardiac Mapping Systems Market Revenue Million Forecast, by End User 2020 & 2033
- Table 10: Global 3D Cardiac Mapping Systems Market Volume Million Forecast, by End User 2020 & 2033
- Table 11: Global 3D Cardiac Mapping Systems Market Revenue Million Forecast, by Country 2020 & 2033
- Table 12: Global 3D Cardiac Mapping Systems Market Volume Million Forecast, by Country 2020 & 2033
- Table 13: United States 3D Cardiac Mapping Systems Market Revenue (Million) Forecast, by Application 2020 & 2033
- Table 14: United States 3D Cardiac Mapping Systems Market Volume (Million) Forecast, by Application 2020 & 2033
- Table 15: Canada 3D Cardiac Mapping Systems Market Revenue (Million) Forecast, by Application 2020 & 2033
- Table 16: Canada 3D Cardiac Mapping Systems Market Volume (Million) Forecast, by Application 2020 & 2033
- Table 17: Mexico 3D Cardiac Mapping Systems Market Revenue (Million) Forecast, by Application 2020 & 2033
- Table 18: Mexico 3D Cardiac Mapping Systems Market Volume (Million) Forecast, by Application 2020 & 2033
- Table 19: Global 3D Cardiac Mapping Systems Market Revenue Million Forecast, by Technology 2020 & 2033
- Table 20: Global 3D Cardiac Mapping Systems Market Volume Million Forecast, by Technology 2020 & 2033
- Table 21: Global 3D Cardiac Mapping Systems Market Revenue Million Forecast, by End User 2020 & 2033
- Table 22: Global 3D Cardiac Mapping Systems Market Volume Million Forecast, by End User 2020 & 2033
- Table 23: Global 3D Cardiac Mapping Systems Market Revenue Million Forecast, by Country 2020 & 2033
- Table 24: Global 3D Cardiac Mapping Systems Market Volume Million Forecast, by Country 2020 & 2033
- Table 25: Germany 3D Cardiac Mapping Systems Market Revenue (Million) Forecast, by Application 2020 & 2033
- Table 26: Germany 3D Cardiac Mapping Systems Market Volume (Million) Forecast, by Application 2020 & 2033
- Table 27: United Kingdom 3D Cardiac Mapping Systems Market Revenue (Million) Forecast, by Application 2020 & 2033
- Table 28: United Kingdom 3D Cardiac Mapping Systems Market Volume (Million) Forecast, by Application 2020 & 2033
- Table 29: France 3D Cardiac Mapping Systems Market Revenue (Million) Forecast, by Application 2020 & 2033
- Table 30: France 3D Cardiac Mapping Systems Market Volume (Million) Forecast, by Application 2020 & 2033
- Table 31: Italy 3D Cardiac Mapping Systems Market Revenue (Million) Forecast, by Application 2020 & 2033
- Table 32: Italy 3D Cardiac Mapping Systems Market Volume (Million) Forecast, by Application 2020 & 2033
- Table 33: Spain 3D Cardiac Mapping Systems Market Revenue (Million) Forecast, by Application 2020 & 2033
- Table 34: Spain 3D Cardiac Mapping Systems Market Volume (Million) Forecast, by Application 2020 & 2033
- Table 35: Rest of Europe 3D Cardiac Mapping Systems Market Revenue (Million) Forecast, by Application 2020 & 2033
- Table 36: Rest of Europe 3D Cardiac Mapping Systems Market Volume (Million) Forecast, by Application 2020 & 2033
- Table 37: Global 3D Cardiac Mapping Systems Market Revenue Million Forecast, by Technology 2020 & 2033
- Table 38: Global 3D Cardiac Mapping Systems Market Volume Million Forecast, by Technology 2020 & 2033
- Table 39: Global 3D Cardiac Mapping Systems Market Revenue Million Forecast, by End User 2020 & 2033
- Table 40: Global 3D Cardiac Mapping Systems Market Volume Million Forecast, by End User 2020 & 2033
- Table 41: Global 3D Cardiac Mapping Systems Market Revenue Million Forecast, by Country 2020 & 2033
- Table 42: Global 3D Cardiac Mapping Systems Market Volume Million Forecast, by Country 2020 & 2033
- Table 43: China 3D Cardiac Mapping Systems Market Revenue (Million) Forecast, by Application 2020 & 2033
- Table 44: China 3D Cardiac Mapping Systems Market Volume (Million) Forecast, by Application 2020 & 2033
- Table 45: Japan 3D Cardiac Mapping Systems Market Revenue (Million) Forecast, by Application 2020 & 2033
- Table 46: Japan 3D Cardiac Mapping Systems Market Volume (Million) Forecast, by Application 2020 & 2033
- Table 47: India 3D Cardiac Mapping Systems Market Revenue (Million) Forecast, by Application 2020 & 2033
- Table 48: India 3D Cardiac Mapping Systems Market Volume (Million) Forecast, by Application 2020 & 2033
- Table 49: Australia 3D Cardiac Mapping Systems Market Revenue (Million) Forecast, by Application 2020 & 2033
- Table 50: Australia 3D Cardiac Mapping Systems Market Volume (Million) Forecast, by Application 2020 & 2033
- Table 51: South Korea 3D Cardiac Mapping Systems Market Revenue (Million) Forecast, by Application 2020 & 2033
- Table 52: South Korea 3D Cardiac Mapping Systems Market Volume (Million) Forecast, by Application 2020 & 2033
- Table 53: Rest of Asia Pacific 3D Cardiac Mapping Systems Market Revenue (Million) Forecast, by Application 2020 & 2033
- Table 54: Rest of Asia Pacific 3D Cardiac Mapping Systems Market Volume (Million) Forecast, by Application 2020 & 2033
- Table 55: Global 3D Cardiac Mapping Systems Market Revenue Million Forecast, by Technology 2020 & 2033
- Table 56: Global 3D Cardiac Mapping Systems Market Volume Million Forecast, by Technology 2020 & 2033
- Table 57: Global 3D Cardiac Mapping Systems Market Revenue Million Forecast, by End User 2020 & 2033
- Table 58: Global 3D Cardiac Mapping Systems Market Volume Million Forecast, by End User 2020 & 2033
- Table 59: Global 3D Cardiac Mapping Systems Market Revenue Million Forecast, by Country 2020 & 2033
- Table 60: Global 3D Cardiac Mapping Systems Market Volume Million Forecast, by Country 2020 & 2033
- Table 61: GCC 3D Cardiac Mapping Systems Market Revenue (Million) Forecast, by Application 2020 & 2033
- Table 62: GCC 3D Cardiac Mapping Systems Market Volume (Million) Forecast, by Application 2020 & 2033
- Table 63: South Africa 3D Cardiac Mapping Systems Market Revenue (Million) Forecast, by Application 2020 & 2033
- Table 64: South Africa 3D Cardiac Mapping Systems Market Volume (Million) Forecast, by Application 2020 & 2033
- Table 65: Rest of Middle East and Africa 3D Cardiac Mapping Systems Market Revenue (Million) Forecast, by Application 2020 & 2033
- Table 66: Rest of Middle East and Africa 3D Cardiac Mapping Systems Market Volume (Million) Forecast, by Application 2020 & 2033
- Table 67: Global 3D Cardiac Mapping Systems Market Revenue Million Forecast, by Technology 2020 & 2033
- Table 68: Global 3D Cardiac Mapping Systems Market Volume Million Forecast, by Technology 2020 & 2033
- Table 69: Global 3D Cardiac Mapping Systems Market Revenue Million Forecast, by End User 2020 & 2033
- Table 70: Global 3D Cardiac Mapping Systems Market Volume Million Forecast, by End User 2020 & 2033
- Table 71: Global 3D Cardiac Mapping Systems Market Revenue Million Forecast, by Country 2020 & 2033
- Table 72: Global 3D Cardiac Mapping Systems Market Volume Million Forecast, by Country 2020 & 2033
- Table 73: Brazil 3D Cardiac Mapping Systems Market Revenue (Million) Forecast, by Application 2020 & 2033
- Table 74: Brazil 3D Cardiac Mapping Systems Market Volume (Million) Forecast, by Application 2020 & 2033
- Table 75: Argentina 3D Cardiac Mapping Systems Market Revenue (Million) Forecast, by Application 2020 & 2033
- Table 76: Argentina 3D Cardiac Mapping Systems Market Volume (Million) Forecast, by Application 2020 & 2033
- Table 77: Rest of South America 3D Cardiac Mapping Systems Market Revenue (Million) Forecast, by Application 2020 & 2033
- Table 78: Rest of South America 3D Cardiac Mapping Systems Market Volume (Million) Forecast, by Application 2020 & 2033
Frequently Asked Questions
1. What is the projected Compound Annual Growth Rate (CAGR) of the 3D Cardiac Mapping Systems Market?
The projected CAGR is approximately 11.40%.
2. Which companies are prominent players in the 3D Cardiac Mapping Systems Market?
Key companies in the market include Olympus Corporation, Medtronic, GE Healthcare, Siemens Healthineers AG, Smith + Nephew, Abbott, Intuitive Surgical Inc, Koninklijke Philips NV, Stryker Corporation, Zimmer Biomet*List Not Exhaustive.
3. What are the main segments of the 3D Cardiac Mapping Systems Market?
The market segments include Technology, End User.
4. Can you provide details about the market size?
The market size is estimated to be USD 538.60 Million as of 2022.
5. What are some drivers contributing to market growth?
Rising Prevalence of Cardiovascular Diseases Coupled with the Rising Geriatric Population; Increasing Number of Technological Advancements.
6. What are the notable trends driving market growth?
The Electroanatomical Mapping Segment is Expected to Hold Significant Market Share During the Forecast Period.
7. Are there any restraints impacting market growth?
Rising Prevalence of Cardiovascular Diseases Coupled with the Rising Geriatric Population; Increasing Number of Technological Advancements.
8. Can you provide examples of recent developments in the market?
May 2024: Biosense Webster Inc., a cardiac arrhythmia treatment devices provider and part of Johnson & Johnson MedTech, launched the CARTO 3 System Version 8, the latest version of the company’s leading three-dimension (3D) heart mapping system used in cardiac ablation procedures.
9. What pricing options are available for accessing the report?
Pricing options include single-user, multi-user, and enterprise licenses priced at USD 4750, USD 5250, and USD 8750 respectively.
10. Is the market size provided in terms of value or volume?
The market size is provided in terms of value, measured in Million and volume, measured in Million.
11. Are there any specific market keywords associated with the report?
Yes, the market keyword associated with the report is "3D Cardiac Mapping Systems Market," which aids in identifying and referencing the specific market segment covered.
12. How do I determine which pricing option suits my needs best?
The pricing options vary based on user requirements and access needs. Individual users may opt for single-user licenses, while businesses requiring broader access may choose multi-user or enterprise licenses for cost-effective access to the report.
13. Are there any additional resources or data provided in the 3D Cardiac Mapping Systems Market report?
While the report offers comprehensive insights, it's advisable to review the specific contents or supplementary materials provided to ascertain if additional resources or data are available.
14. How can I stay updated on further developments or reports in the 3D Cardiac Mapping Systems Market?
To stay informed about further developments, trends, and reports in the 3D Cardiac Mapping Systems Market, consider subscribing to industry newsletters, following relevant companies and organizations, or regularly checking reputable industry news sources and publications.
Methodology
Step 1 - Identification of Relevant Samples Size from Population Database


Step 2 - Approaches for Defining Global Market Size (Value, Volume* & Price*)

Note*: In applicable scenarios
Step 3 - Data Sources
Primary Research
- Web Analytics
- Survey Reports
- Research Institute
- Latest Research Reports
- Opinion Leaders
Secondary Research
- Annual Reports
- White Paper
- Latest Press Release
- Industry Association
- Paid Database
- Investor Presentations

Step 4 - Data Triangulation
Involves using different sources of information in order to increase the validity of a study
These sources are likely to be stakeholders in a program - participants, other researchers, program staff, other community members, and so on.
Then we put all data in single framework & apply various statistical tools to find out the dynamic on the market.
During the analysis stage, feedback from the stakeholder groups would be compared to determine areas of agreement as well as areas of divergence

