

Key Insights
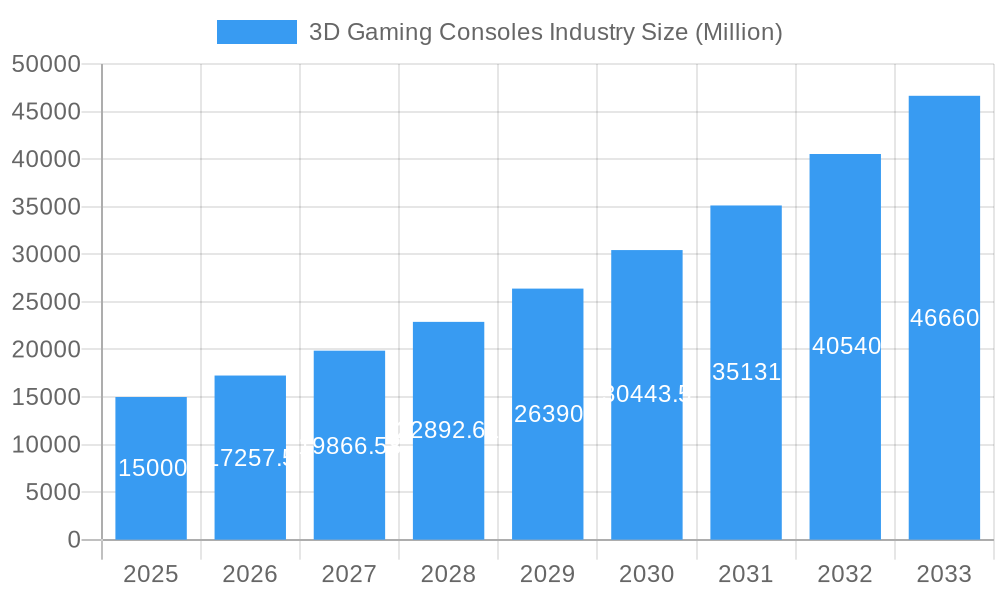
The 3D gaming console market is projected for substantial growth, anticipating a Compound Annual Growth Rate (CAGR) of 15.15% from 2025 to 2033. This expansion is driven by technological advancements in immersive display technology, the increasing integration of Virtual Reality (VR) and Augmented Reality (AR) gaming, and the continuous release of high-fidelity 3D games. The market is segmented by component (hardware, software), console type (home, handheld, micro, dedicated), and platform (Microsoft Xbox, Sony PlayStation, Nintendo). Intense competition among key players fosters innovation and enhances accessibility. While initial investment costs and high-bandwidth internet requirements are considerations, growing affordability of high-speed internet mitigates these restraints. North America, Europe, and Asia-Pacific are key markets, with emerging economies in South America, the Middle East, and Africa showing significant growth potential.
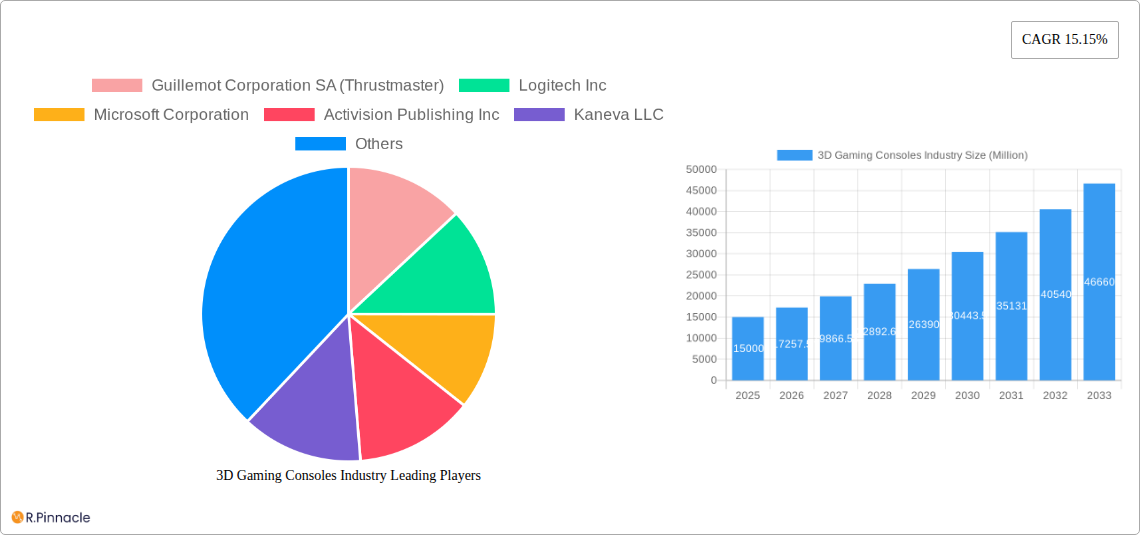
3D Gaming Consoles Industry Market Size (In Billion)
Market segmentation reveals diverse opportunities for industry stakeholders. Hardware innovation focuses on enhanced processing power and display capabilities, while software development prioritizes compelling 3D gaming experiences. The evolution of console types, from home-based to portable solutions, signifies ongoing market diversification. Strategic collaborations between console manufacturers and game studios are critical for platform-specific game development and market share. Regional performance analysis informs targeted marketing strategies. To achieve market leadership, companies must prioritize innovation, competitive pricing, and tailored marketing campaigns. Adapting to emerging VR/AR trends and technological advancements is essential for sustained competitive advantage in this dynamic sector.
3D Gaming Consoles Industry Company Market Share
3D Gaming Consoles Industry Report: 2019-2033
This comprehensive report provides an in-depth analysis of the 3D gaming consoles market, offering invaluable insights for industry professionals, investors, and strategists. Covering the period from 2019 to 2033, with a focus on 2025, this report meticulously examines market structure, dynamics, key players, and future growth prospects. The report leverages extensive data analysis to forecast market trends and identify lucrative opportunities within this dynamic sector. Expected market size in millions will be detailed throughout.
3D Gaming Consoles Industry Market Structure & Innovation Trends
This section analyzes the competitive landscape, innovation drivers, and regulatory factors shaping the 3D gaming consoles market. The report examines market concentration, revealing the market share held by key players like Sony, Microsoft, and Nintendo. It also explores the impact of mergers and acquisitions (M&A), including deal values (xx Million) and their influence on market consolidation. Innovation drivers, such as advancements in graphics processing, virtual reality (VR) integration, and the rise of cloud gaming, are analyzed in detail. The regulatory environment, including content rating systems and data privacy regulations, are also considered. Finally, the report explores the impact of substitute products, such as mobile gaming and PC gaming, on market dynamics and consumer preferences. End-user demographics, including age groups, gaming habits, and spending patterns are also examined.
- Market Concentration: High, with significant market share held by a few major players.
- M&A Activity: xx Million in deals recorded over the historical period (2019-2024). Significant impact on market consolidation expected in the forecast period.
- Innovation Drivers: Advancements in VR/AR technology, cloud gaming, enhanced graphics capabilities.
- Regulatory Framework: Varying across regions, influencing content availability and data protection.
- Product Substitutes: Mobile gaming and PC gaming pose significant competitive pressure.
- End-User Demographics: Primarily young adults, with growing participation from older demographics.
3D Gaming Consoles Industry Market Dynamics & Trends
This section delves into the market's growth trajectory, technological disruptions, evolving consumer preferences, and competitive dynamics. The report provides a detailed analysis of market growth drivers, including increasing disposable incomes, technological advancements, and the growing popularity of esports. Technological disruptions, such as the emergence of Web3 gaming and the metaverse, are examined for their potential impact on market evolution. Consumer preferences, including demand for immersive gaming experiences, high-quality graphics, and cross-platform compatibility, are explored. The report also examines the competitive dynamics within the industry, including pricing strategies, product differentiation, and marketing efforts of major players. Key metrics, such as CAGR (xx%) and market penetration (xx%), are provided to quantify these dynamics.
Dominant Regions & Segments in 3D Gaming Consoles Industry
This section identifies the leading regions, countries, and segments within the 3D gaming consoles market. The report analyzes market dominance across various segments: By Component (Hardware, Software), By Console (Home Consoles, Handheld Consoles, Micro Consoles, Dedicated Consoles), and By Platform (Microsoft Xbox, Sony PlayStation, Nintendo Wii, Other Platforms). Key drivers for regional and segment dominance are identified using bullet points, while detailed analysis focuses on market size, growth rates, and competitive intensity.
- By Component: Hardware currently dominates, with software showing strong growth potential.
- By Console: Home consoles retain the largest market share, though handheld consoles continue to demonstrate significant growth.
- By Platform: Microsoft Xbox, Sony PlayStation, and Nintendo Wii hold the largest market shares, with "Other Platforms" showing steady growth.
Dominant Regions: North America and Asia-Pacific currently lead, driven by strong consumer demand and technological advancements.
- North America: Strong consumer spending power and established gaming culture.
- Asia-Pacific: Rapid economic growth and expanding internet penetration.
3D Gaming Consoles Industry Product Innovations
This section highlights recent product developments, applications, and competitive advantages of new products in the 3D gaming consoles market. The analysis focuses on technological advancements that are driving market trends, such as improved graphics processing units (GPUs), advanced haptic feedback systems, and enhanced VR/AR integration. The report also explores how these innovations contribute to a better market fit by addressing evolving consumer demands and competitive pressures.
Report Scope & Segmentation Analysis
This report segments the 3D gaming consoles market by component (hardware and software), console type (home, handheld, micro, dedicated), and platform (Microsoft Xbox, Sony PlayStation, Nintendo Wii, and others). Each segment’s growth projections, market size (in Millions), and competitive dynamics are detailed. Market size for each segment in 2025 (estimated) and 2033 (forecast) will be provided.
Key Drivers of 3D Gaming Consoles Industry Growth
The 3D gaming consoles market is driven by several factors: technological advancements (enhanced graphics, VR/AR integration), increasing disposable incomes in emerging markets, growing popularity of esports, and favorable government policies promoting digital entertainment. These factors contribute to sustained market growth.
Challenges in the 3D Gaming Consoles Industry Sector
Challenges include intense competition, high development costs, supply chain disruptions, evolving consumer preferences, and regulatory hurdles related to content and data privacy. These factors can impact market growth and profitability.
Emerging Opportunities in 3D Gaming Consoles Industry
Emerging opportunities lie in the expansion of cloud gaming, the integration of blockchain technology (as exemplified by Zilliqa's Web3 console), the growth of the metaverse, and the increasing demand for immersive gaming experiences. These represent significant growth potential.
Leading Players in the 3D Gaming Consoles Industry Market
Key Developments in 3D Gaming Consoles Industry
- September 2022: Zilliqa Blockchain launched the world's first Web3 games console, signaling the integration of blockchain technology into the gaming industry.
- September 2022: Sony Interactive Entertainment launched the Gray Camouflage Collection for the PS5, demonstrating ongoing efforts in product diversification and design innovation.
Future Outlook for 3D Gaming Consoles Industry Market
The future of the 3D gaming consoles market is bright, driven by ongoing technological advancements, expanding internet penetration, and the increasing adoption of cloud gaming. The market is poised for significant growth, offering promising opportunities for innovation and investment. The integration of Web3 technologies and the metaverse promises to reshape the gaming landscape, creating new avenues for growth and market expansion in the coming years. The continued popularity of esports will also further drive market demand.
3D Gaming Consoles Industry Segmentation
-
1. Component
- 1.1. Hardware
- 1.2. Software
-
2. Console
- 2.1. Home Consoles
- 2.2. Handheld Consoles
- 2.3. Micro Consoles
- 2.4. Dedicated Consoles
-
3. Platform
- 3.1. Microsoft Xbox
- 3.2. Sony PlayStation
- 3.3. Nintendo Wii
- 3.4. Other Platforms
3D Gaming Consoles Industry Segmentation By Geography
-
1. North America
- 1.1. United States
- 1.2. Canada
-
2. Europe
- 2.1. United Kingdom
- 2.2. Germany
- 2.3. France
- 2.4. Rest of Europe
-
3. Asia Pacific
- 3.1. China
- 3.2. Japan
- 3.3. India
- 3.4. Rest of Asia Pacific
- 4. Rest of the World
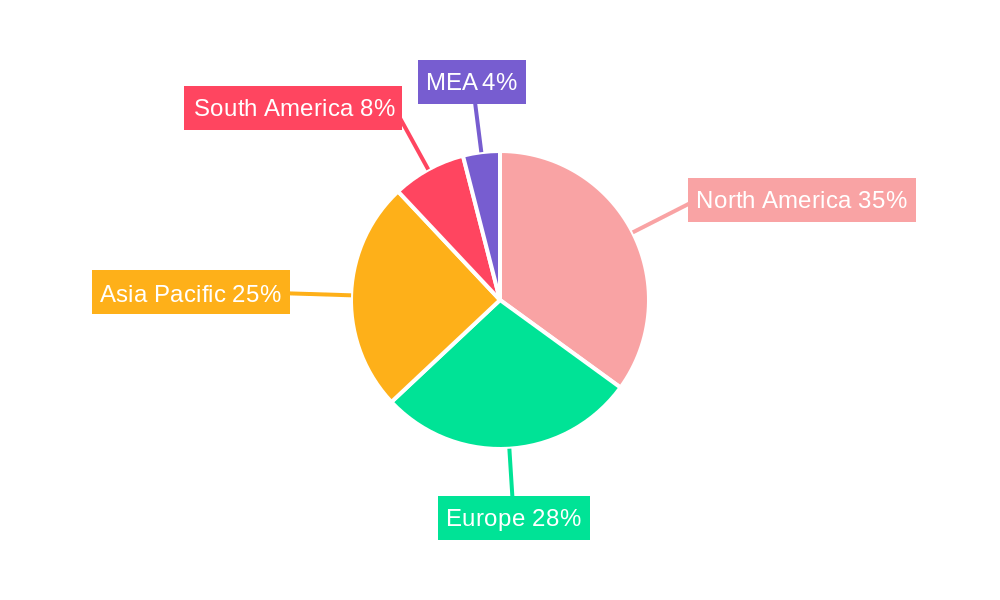
3D Gaming Consoles Industry Regional Market Share
Geographic Coverage of 3D Gaming Consoles Industry
3D Gaming Consoles Industry REPORT HIGHLIGHTS
| Aspects | Details |
|---|---|
| Study Period | 2020-2034 |
| Base Year | 2025 |
| Estimated Year | 2026 |
| Forecast Period | 2026-2034 |
| Historical Period | 2020-2025 |
| Growth Rate | CAGR of 8.21% from 2020-2034 |
| Segmentation |
|
Table of Contents
- 1. Introduction
- 1.1. Research Scope
- 1.2. Market Segmentation
- 1.3. Research Objective
- 1.4. Definitions and Assumptions
- 2. Executive Summary
- 2.1. Market Snapshot
- 3. Market Dynamics
- 3.1. Market Drivers
- 3.2. Market Restrains
- 3.3. Market Trends
- 3.4. Market Opportunities
- 4. Market Factor Analysis
- 4.1. Porters Five Forces
- 4.1.1. Bargaining Power of Suppliers
- 4.1.2. Bargaining Power of Buyers
- 4.1.3. Threat of New Entrants
- 4.1.4. Threat of Substitutes
- 4.1.5. Competitive Rivalry
- 4.2. PESTEL analysis
- 4.3. BCG Analysis
- 4.3.1. Stars (High Growth, High Market Share)
- 4.3.2. Cash Cows (Low Growth, High Market Share)
- 4.3.3. Question Mark (High Growth, Low Market Share)
- 4.3.4. Dogs (Low Growth, Low Market Share)
- 4.4. Ansoff Matrix Analysis
- 4.5. Supply Chain Analysis
- 4.6. Regulatory Landscape
- 4.7. Current Market Potential and Opportunity Assessment (TAM–SAM–SOM Framework)
- 4.8. PRI Analyst Note
- 4.1. Porters Five Forces
- 5. Market Analysis, Insights and Forecast 2021-2033
- 5.1. Market Analysis, Insights and Forecast - by Component
- 5.1.1. Hardware
- 5.1.2. Software
- 5.2. Market Analysis, Insights and Forecast - by Console
- 5.2.1. Home Consoles
- 5.2.2. Handheld Consoles
- 5.2.3. Micro Consoles
- 5.2.4. Dedicated Consoles
- 5.3. Market Analysis, Insights and Forecast - by Platform
- 5.3.1. Microsoft Xbox
- 5.3.2. Sony PlayStation
- 5.3.3. Nintendo Wii
- 5.3.4. Other Platforms
- 5.4. Market Analysis, Insights and Forecast - by Region
- 5.4.1. North America
- 5.4.2. Europe
- 5.4.3. Asia Pacific
- 5.4.4. Rest of the World
- 5.1. Market Analysis, Insights and Forecast - by Component
- 6. Global 3D Gaming Consoles Industry Analysis, Insights and Forecast, 2021-2033
- 6.1. Market Analysis, Insights and Forecast - by Component
- 6.1.1. Hardware
- 6.1.2. Software
- 6.2. Market Analysis, Insights and Forecast - by Console
- 6.2.1. Home Consoles
- 6.2.2. Handheld Consoles
- 6.2.3. Micro Consoles
- 6.2.4. Dedicated Consoles
- 6.3. Market Analysis, Insights and Forecast - by Platform
- 6.3.1. Microsoft Xbox
- 6.3.2. Sony PlayStation
- 6.3.3. Nintendo Wii
- 6.3.4. Other Platforms
- 6.1. Market Analysis, Insights and Forecast - by Component
- 7. North America 3D Gaming Consoles Industry Analysis, Insights and Forecast, 2020-2032
- 7.1. Market Analysis, Insights and Forecast - by Component
- 7.1.1. Hardware
- 7.1.2. Software
- 7.2. Market Analysis, Insights and Forecast - by Console
- 7.2.1. Home Consoles
- 7.2.2. Handheld Consoles
- 7.2.3. Micro Consoles
- 7.2.4. Dedicated Consoles
- 7.3. Market Analysis, Insights and Forecast - by Platform
- 7.3.1. Microsoft Xbox
- 7.3.2. Sony PlayStation
- 7.3.3. Nintendo Wii
- 7.3.4. Other Platforms
- 7.1. Market Analysis, Insights and Forecast - by Component
- 8. Europe 3D Gaming Consoles Industry Analysis, Insights and Forecast, 2020-2032
- 8.1. Market Analysis, Insights and Forecast - by Component
- 8.1.1. Hardware
- 8.1.2. Software
- 8.2. Market Analysis, Insights and Forecast - by Console
- 8.2.1. Home Consoles
- 8.2.2. Handheld Consoles
- 8.2.3. Micro Consoles
- 8.2.4. Dedicated Consoles
- 8.3. Market Analysis, Insights and Forecast - by Platform
- 8.3.1. Microsoft Xbox
- 8.3.2. Sony PlayStation
- 8.3.3. Nintendo Wii
- 8.3.4. Other Platforms
- 8.1. Market Analysis, Insights and Forecast - by Component
- 9. Asia Pacific 3D Gaming Consoles Industry Analysis, Insights and Forecast, 2020-2032
- 9.1. Market Analysis, Insights and Forecast - by Component
- 9.1.1. Hardware
- 9.1.2. Software
- 9.2. Market Analysis, Insights and Forecast - by Console
- 9.2.1. Home Consoles
- 9.2.2. Handheld Consoles
- 9.2.3. Micro Consoles
- 9.2.4. Dedicated Consoles
- 9.3. Market Analysis, Insights and Forecast - by Platform
- 9.3.1. Microsoft Xbox
- 9.3.2. Sony PlayStation
- 9.3.3. Nintendo Wii
- 9.3.4. Other Platforms
- 9.1. Market Analysis, Insights and Forecast - by Component
- 10. Rest of the World 3D Gaming Consoles Industry Analysis, Insights and Forecast, 2020-2032
- 10.1. Market Analysis, Insights and Forecast - by Component
- 10.1.1. Hardware
- 10.1.2. Software
- 10.2. Market Analysis, Insights and Forecast - by Console
- 10.2.1. Home Consoles
- 10.2.2. Handheld Consoles
- 10.2.3. Micro Consoles
- 10.2.4. Dedicated Consoles
- 10.3. Market Analysis, Insights and Forecast - by Platform
- 10.3.1. Microsoft Xbox
- 10.3.2. Sony PlayStation
- 10.3.3. Nintendo Wii
- 10.3.4. Other Platforms
- 10.1. Market Analysis, Insights and Forecast - by Component
- 11. Competitive Analysis
- 11.1. Company Profiles
- 11.1.1 Guillemot Corporation SA (Thrustmaster)
- 11.1.1.1. Company Overview
- 11.1.1.2. Products
- 11.1.1.3. Company Financials
- 11.1.1.4. SWOT Analysis
- 11.1.2 Logitech Inc
- 11.1.2.1. Company Overview
- 11.1.2.2. Products
- 11.1.2.3. Company Financials
- 11.1.2.4. SWOT Analysis
- 11.1.3 Microsoft Corporation
- 11.1.3.1. Company Overview
- 11.1.3.2. Products
- 11.1.3.3. Company Financials
- 11.1.3.4. SWOT Analysis
- 11.1.4 Activision Publishing Inc
- 11.1.4.1. Company Overview
- 11.1.4.2. Products
- 11.1.4.3. Company Financials
- 11.1.4.4. SWOT Analysis
- 11.1.5 Kaneva LLC
- 11.1.5.1. Company Overview
- 11.1.5.2. Products
- 11.1.5.3. Company Financials
- 11.1.5.4. SWOT Analysis
- 11.1.6 Nintendo Co Ltd
- 11.1.6.1. Company Overview
- 11.1.6.2. Products
- 11.1.6.3. Company Financials
- 11.1.6.4. SWOT Analysis
- 11.1.7 Electronic Art Inc
- 11.1.7.1. Company Overview
- 11.1.7.2. Products
- 11.1.7.3. Company Financials
- 11.1.7.4. SWOT Analysis
- 11.1.8 Sony Corporatio
- 11.1.8.1. Company Overview
- 11.1.8.2. Products
- 11.1.8.3. Company Financials
- 11.1.8.4. SWOT Analysis
- 11.1.9 A4Tech Co Ltd
- 11.1.9.1. Company Overview
- 11.1.9.2. Products
- 11.1.9.3. Company Financials
- 11.1.9.4. SWOT Analysis
- 11.1.10 Oculus VR
- 11.1.10.1. Company Overview
- 11.1.10.2. Products
- 11.1.10.3. Company Financials
- 11.1.10.4. SWOT Analysis
- 11.1.1 Guillemot Corporation SA (Thrustmaster)
- 11.2. Market Entropy
- 11.2.1 Company's Key Areas Served
- 11.2.2 Recent Developments
- 11.3. Company Market Share Analysis 2025
- 11.3.1 Top 5 Companies Market Share Analysis
- 11.3.2 Top 3 Companies Market Share Analysis
- 11.4. List of Potential Customers
- 12. Research Methodology
List of Figures
- Figure 1: Global 3D Gaming Consoles Industry Revenue Breakdown (billion, %) by Region 2025 & 2033
- Figure 2: North America 3D Gaming Consoles Industry Revenue (billion), by Component 2025 & 2033
- Figure 3: North America 3D Gaming Consoles Industry Revenue Share (%), by Component 2025 & 2033
- Figure 4: North America 3D Gaming Consoles Industry Revenue (billion), by Console 2025 & 2033
- Figure 5: North America 3D Gaming Consoles Industry Revenue Share (%), by Console 2025 & 2033
- Figure 6: North America 3D Gaming Consoles Industry Revenue (billion), by Platform 2025 & 2033
- Figure 7: North America 3D Gaming Consoles Industry Revenue Share (%), by Platform 2025 & 2033
- Figure 8: North America 3D Gaming Consoles Industry Revenue (billion), by Country 2025 & 2033
- Figure 9: North America 3D Gaming Consoles Industry Revenue Share (%), by Country 2025 & 2033
- Figure 10: Europe 3D Gaming Consoles Industry Revenue (billion), by Component 2025 & 2033
- Figure 11: Europe 3D Gaming Consoles Industry Revenue Share (%), by Component 2025 & 2033
- Figure 12: Europe 3D Gaming Consoles Industry Revenue (billion), by Console 2025 & 2033
- Figure 13: Europe 3D Gaming Consoles Industry Revenue Share (%), by Console 2025 & 2033
- Figure 14: Europe 3D Gaming Consoles Industry Revenue (billion), by Platform 2025 & 2033
- Figure 15: Europe 3D Gaming Consoles Industry Revenue Share (%), by Platform 2025 & 2033
- Figure 16: Europe 3D Gaming Consoles Industry Revenue (billion), by Country 2025 & 2033
- Figure 17: Europe 3D Gaming Consoles Industry Revenue Share (%), by Country 2025 & 2033
- Figure 18: Asia Pacific 3D Gaming Consoles Industry Revenue (billion), by Component 2025 & 2033
- Figure 19: Asia Pacific 3D Gaming Consoles Industry Revenue Share (%), by Component 2025 & 2033
- Figure 20: Asia Pacific 3D Gaming Consoles Industry Revenue (billion), by Console 2025 & 2033
- Figure 21: Asia Pacific 3D Gaming Consoles Industry Revenue Share (%), by Console 2025 & 2033
- Figure 22: Asia Pacific 3D Gaming Consoles Industry Revenue (billion), by Platform 2025 & 2033
- Figure 23: Asia Pacific 3D Gaming Consoles Industry Revenue Share (%), by Platform 2025 & 2033
- Figure 24: Asia Pacific 3D Gaming Consoles Industry Revenue (billion), by Country 2025 & 2033
- Figure 25: Asia Pacific 3D Gaming Consoles Industry Revenue Share (%), by Country 2025 & 2033
- Figure 26: Rest of the World 3D Gaming Consoles Industry Revenue (billion), by Component 2025 & 2033
- Figure 27: Rest of the World 3D Gaming Consoles Industry Revenue Share (%), by Component 2025 & 2033
- Figure 28: Rest of the World 3D Gaming Consoles Industry Revenue (billion), by Console 2025 & 2033
- Figure 29: Rest of the World 3D Gaming Consoles Industry Revenue Share (%), by Console 2025 & 2033
- Figure 30: Rest of the World 3D Gaming Consoles Industry Revenue (billion), by Platform 2025 & 2033
- Figure 31: Rest of the World 3D Gaming Consoles Industry Revenue Share (%), by Platform 2025 & 2033
- Figure 32: Rest of the World 3D Gaming Consoles Industry Revenue (billion), by Country 2025 & 2033
- Figure 33: Rest of the World 3D Gaming Consoles Industry Revenue Share (%), by Country 2025 & 2033
List of Tables
- Table 1: Global 3D Gaming Consoles Industry Revenue billion Forecast, by Component 2020 & 2033
- Table 2: Global 3D Gaming Consoles Industry Revenue billion Forecast, by Console 2020 & 2033
- Table 3: Global 3D Gaming Consoles Industry Revenue billion Forecast, by Platform 2020 & 2033
- Table 4: Global 3D Gaming Consoles Industry Revenue billion Forecast, by Region 2020 & 2033
- Table 5: Global 3D Gaming Consoles Industry Revenue billion Forecast, by Component 2020 & 2033
- Table 6: Global 3D Gaming Consoles Industry Revenue billion Forecast, by Console 2020 & 2033
- Table 7: Global 3D Gaming Consoles Industry Revenue billion Forecast, by Platform 2020 & 2033
- Table 8: Global 3D Gaming Consoles Industry Revenue billion Forecast, by Country 2020 & 2033
- Table 9: United States 3D Gaming Consoles Industry Revenue (billion) Forecast, by Application 2020 & 2033
- Table 10: Canada 3D Gaming Consoles Industry Revenue (billion) Forecast, by Application 2020 & 2033
- Table 11: Global 3D Gaming Consoles Industry Revenue billion Forecast, by Component 2020 & 2033
- Table 12: Global 3D Gaming Consoles Industry Revenue billion Forecast, by Console 2020 & 2033
- Table 13: Global 3D Gaming Consoles Industry Revenue billion Forecast, by Platform 2020 & 2033
- Table 14: Global 3D Gaming Consoles Industry Revenue billion Forecast, by Country 2020 & 2033
- Table 15: United Kingdom 3D Gaming Consoles Industry Revenue (billion) Forecast, by Application 2020 & 2033
- Table 16: Germany 3D Gaming Consoles Industry Revenue (billion) Forecast, by Application 2020 & 2033
- Table 17: France 3D Gaming Consoles Industry Revenue (billion) Forecast, by Application 2020 & 2033
- Table 18: Rest of Europe 3D Gaming Consoles Industry Revenue (billion) Forecast, by Application 2020 & 2033
- Table 19: Global 3D Gaming Consoles Industry Revenue billion Forecast, by Component 2020 & 2033
- Table 20: Global 3D Gaming Consoles Industry Revenue billion Forecast, by Console 2020 & 2033
- Table 21: Global 3D Gaming Consoles Industry Revenue billion Forecast, by Platform 2020 & 2033
- Table 22: Global 3D Gaming Consoles Industry Revenue billion Forecast, by Country 2020 & 2033
- Table 23: China 3D Gaming Consoles Industry Revenue (billion) Forecast, by Application 2020 & 2033
- Table 24: Japan 3D Gaming Consoles Industry Revenue (billion) Forecast, by Application 2020 & 2033
- Table 25: India 3D Gaming Consoles Industry Revenue (billion) Forecast, by Application 2020 & 2033
- Table 26: Rest of Asia Pacific 3D Gaming Consoles Industry Revenue (billion) Forecast, by Application 2020 & 2033
- Table 27: Global 3D Gaming Consoles Industry Revenue billion Forecast, by Component 2020 & 2033
- Table 28: Global 3D Gaming Consoles Industry Revenue billion Forecast, by Console 2020 & 2033
- Table 29: Global 3D Gaming Consoles Industry Revenue billion Forecast, by Platform 2020 & 2033
- Table 30: Global 3D Gaming Consoles Industry Revenue billion Forecast, by Country 2020 & 2033
Frequently Asked Questions
1. What is the projected Compound Annual Growth Rate (CAGR) of the 3D Gaming Consoles Industry?
The projected CAGR is approximately 8.21%.
2. Which companies are prominent players in the 3D Gaming Consoles Industry?
Key companies in the market include Guillemot Corporation SA (Thrustmaster), Logitech Inc, Microsoft Corporation, Activision Publishing Inc, Kaneva LLC, Nintendo Co Ltd, Electronic Art Inc, Sony Corporatio, A4Tech Co Ltd, Oculus VR.
3. What are the main segments of the 3D Gaming Consoles Industry?
The market segments include Component, Console, Platform.
4. Can you provide details about the market size?
The market size is estimated to be USD 12.888 billion as of 2022.
5. What are some drivers contributing to market growth?
Growing Popularity of 3D Devices; Development of Autostereoscopic Technology.
6. What are the notable trends driving market growth?
Home Consoles to Dominate the 3D Gaming Consoles Market.
7. Are there any restraints impacting market growth?
Strong Competition form PCs; Higher Game Development Costs.
8. Can you provide examples of recent developments in the market?
September 2022: Zilliqa Blockchain launched the world's first Web3 games console. With the gaming industry proving itself time and time again as a productive medium for leveraging blockchain technology, Layer-1 blockchain Zilliqa revealed its plans to introduce the world's first Web3 hardware console and gaming hub.
9. What pricing options are available for accessing the report?
Pricing options include single-user, multi-user, and enterprise licenses priced at USD 4750, USD 5250, and USD 8750 respectively.
10. Is the market size provided in terms of value or volume?
The market size is provided in terms of value, measured in billion.
11. Are there any specific market keywords associated with the report?
Yes, the market keyword associated with the report is "3D Gaming Consoles Industry," which aids in identifying and referencing the specific market segment covered.
12. How do I determine which pricing option suits my needs best?
The pricing options vary based on user requirements and access needs. Individual users may opt for single-user licenses, while businesses requiring broader access may choose multi-user or enterprise licenses for cost-effective access to the report.
13. Are there any additional resources or data provided in the 3D Gaming Consoles Industry report?
While the report offers comprehensive insights, it's advisable to review the specific contents or supplementary materials provided to ascertain if additional resources or data are available.
14. How can I stay updated on further developments or reports in the 3D Gaming Consoles Industry?
To stay informed about further developments, trends, and reports in the 3D Gaming Consoles Industry, consider subscribing to industry newsletters, following relevant companies and organizations, or regularly checking reputable industry news sources and publications.
Methodology
Step 1 - Identification of Relevant Samples Size from Population Database


Step 2 - Approaches for Defining Global Market Size (Value, Volume* & Price*)

Note*: In applicable scenarios
Step 3 - Data Sources
Primary Research
- Web Analytics
- Survey Reports
- Research Institute
- Latest Research Reports
- Opinion Leaders
Secondary Research
- Annual Reports
- White Paper
- Latest Press Release
- Industry Association
- Paid Database
- Investor Presentations

Step 4 - Data Triangulation
Involves using different sources of information in order to increase the validity of a study
These sources are likely to be stakeholders in a program - participants, other researchers, program staff, other community members, and so on.
Then we put all data in single framework & apply various statistical tools to find out the dynamic on the market.
During the analysis stage, feedback from the stakeholder groups would be compared to determine areas of agreement as well as areas of divergence