

Key Insights
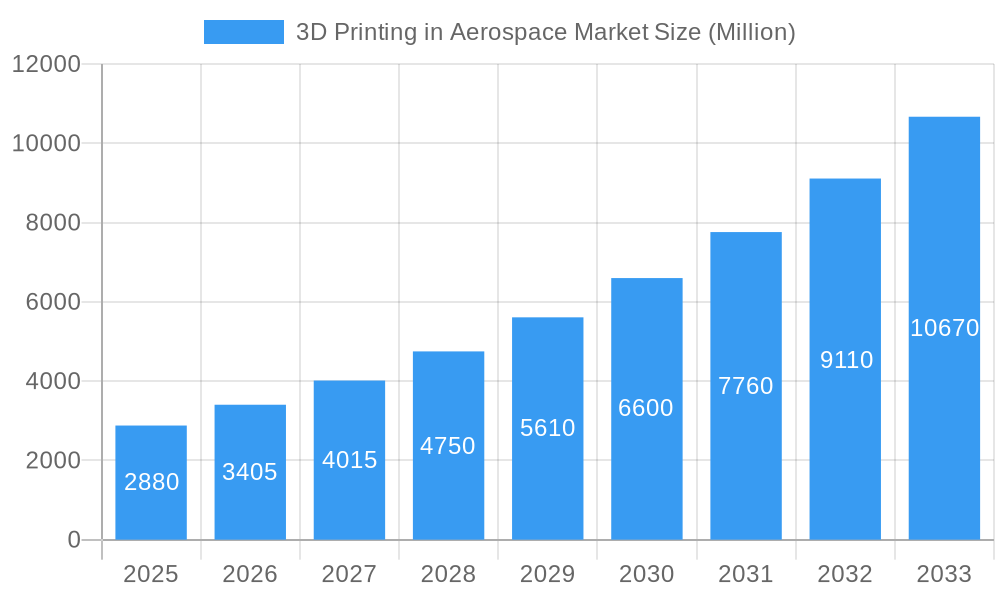
The 3D printing in aerospace market is experiencing robust growth, driven by the increasing demand for lightweight, high-performance components and the need for faster prototyping and manufacturing cycles. A Compound Annual Growth Rate (CAGR) of 18.57% from 2019 to 2024 indicates a significant upward trajectory. This growth is fueled by several key factors. The aerospace industry's persistent need for customized parts, particularly in niche applications like unmanned aerial vehicles (UAVs) and spacecraft, is a major driver. Additive manufacturing's ability to produce complex geometries unattainable through traditional methods offers significant advantages in terms of design flexibility and weight reduction, leading to improved fuel efficiency and performance. Furthermore, the adoption of advanced materials like alloys and special metals in 3D printing is expanding the applications, allowing for the creation of parts with enhanced durability and resistance to extreme conditions. The market segmentation reveals strong growth across various applications, with aircraft and UAV sectors leading the way.
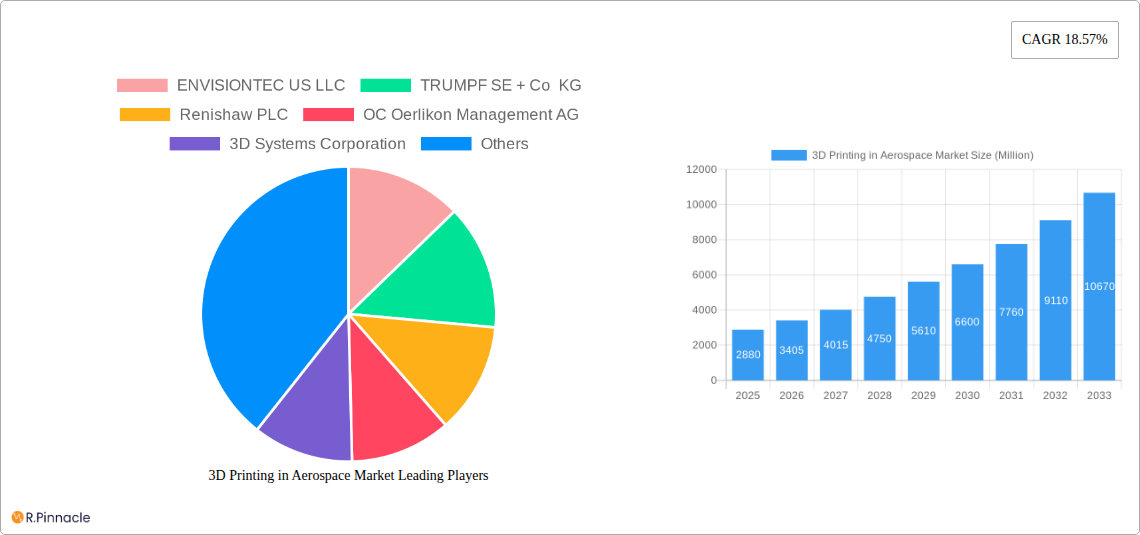
3D Printing in Aerospace Market Market Size (In Billion)
Looking ahead to 2033, the market is projected to continue its expansion, with continued investment in research and development leading to further advancements in materials and printing technologies. While challenges remain, such as the need for wider adoption and standardization of processes, the potential benefits of 3D printing for cost reduction, lead-time improvement, and improved part performance are compelling. Major players like Stratasys, 3D Systems, and GE Additive are actively shaping the market landscape through technological innovations and strategic partnerships. The regional distribution of the market is expected to be heavily influenced by established aerospace hubs like North America and Europe, with Asia-Pacific showing significant growth potential driven by increasing domestic aerospace manufacturing capabilities. The overall forecast paints a picture of sustained and substantial growth, making 3D printing a transformative technology in the aerospace sector.
3D Printing in Aerospace Market Company Market Share
This comprehensive report provides an in-depth analysis of the 3D printing in aerospace market, offering valuable insights for industry professionals, investors, and strategic decision-makers. Covering the period from 2019 to 2033, with a focus on 2025, this report unveils the market's structure, dynamics, dominant players, and future outlook. The global market is projected to reach xx Million by 2033, exhibiting a robust CAGR of xx% during the forecast period (2025-2033).
3D Printing in Aerospace Market Market Structure & Innovation Trends
This section analyzes the market structure, identifying key players and their market share. The report examines innovation drivers, including advancements in materials science and additive manufacturing technologies. Regulatory frameworks impacting the adoption of 3D printing in aerospace are also assessed, alongside an examination of substitute products and their competitive impact. End-user demographics are profiled, and significant mergers and acquisitions (M&A) activities, along with their financial implications (deal values reaching xx Million in some cases), are thoroughly investigated. The competitive landscape reveals a moderately concentrated market with key players like Stratasys Ltd and 3D Systems Corporation holding significant shares. However, new entrants and innovative technologies continue to reshape the market dynamics.
- Market Concentration: Moderately concentrated, with key players holding significant, but not dominant, market shares.
- Innovation Drivers: Advancements in materials (e.g., high-performance alloys), improved printing precision, and software developments.
- Regulatory Framework: Stringent safety and certification standards influence adoption rates.
- M&A Activity: Several significant deals in recent years have reshaped the competitive landscape, with deal values exceeding xx Million in some instances.
3D Printing in Aerospace Market Market Dynamics & Trends
The 3D printing in aerospace market is experiencing robust growth, fueled by a confluence of factors. A primary driver is the escalating demand for lighter, more durable, and higher-performing aircraft and spacecraft components. Additive manufacturing (AM) is increasingly being leveraged for rapid prototyping, sophisticated tooling, and even direct production of end-use parts, leading to significant cost savings and streamlined development cycles. Technological advancements are continuously reshaping the landscape, with the development of novel high-performance materials (such as advanced metal alloys and composite polymers) and the evolution of more efficient and precise printing processes. Furthermore, the aerospace industry's growing emphasis on customization and sustainable manufacturing practices aligns perfectly with the capabilities offered by 3D printing. Competitive dynamics are characterized by strategic collaborations between AM technology providers, material manufacturers, and major aerospace OEMs, as well as investments in R&D to secure intellectual property and enhance production capabilities. The inherent advantages of 3D printing, including design freedom, reduced part counts, and on-demand production, are critical in meeting the industry's stringent requirements for reduced manufacturing costs, faster lead times, and enhanced material properties.
- CAGR: xx% (2025-2033)
- Market Penetration: Expected to increase by xx% by 2033.
Dominant Regions & Segments in 3D Printing in Aerospace Market
This section identifies the leading regions and segments within the 3D printing in aerospace market. North America is currently a dominant region, driven by strong aerospace industries and early adoption of additive manufacturing technologies. Within applications, aircraft manufacturing constitutes the largest segment, followed by unmanned aerial vehicles (UAVs). In terms of materials, alloys and special metals currently dominate due to their strength and performance characteristics.
- Leading Region: North America (due to strong aerospace industry and early adoption)
- Key Drivers (North America): Strong government support for aerospace R&D, robust infrastructure, and skilled workforce.
- Dominant Application Segment: Aircraft manufacturing (due to high demand for lightweight and high-strength components)
- Dominant Material Segment: Alloys and special metals (due to their high strength-to-weight ratio)
3D Printing in Aerospace Market Product Innovations
Innovation in 3D printing for aerospace is heavily focused on pushing the boundaries of material science and process optimization. Recent product developments are centered around enhancing the performance and reliability of printed components. This includes the introduction of advanced metal powders with superior strength-to-weight ratios and improved resistance to extreme temperatures and corrosive environments. Significant strides are also being made in increasing print speeds without compromising accuracy or surface quality, which is crucial for mass production. Furthermore, sophisticated post-processing techniques and in-situ monitoring are leading to components with exceptionally smooth surface finishes, reducing the need for extensive finishing operations and enabling direct integration into critical aerospace systems. These innovations not only improve the functional capabilities of 3D-printed parts but also provide aerospace manufacturers with distinct competitive advantages through faster production cycles, reduced material waste, and unprecedented design flexibility for complex and integrated functionalities.
Report Scope & Segmentation Analysis
This comprehensive report meticulously segments the 3D printing in aerospace market to provide granular insights into its diverse applications and material landscapes. The primary segmentation includes: Application: Aircraft (commercial, military), Unmanned Aerial Vehicles (UAVs), and Spacecraft (satellites, rockets, probes). Detailed analysis is provided for the growth projections, market size, and competitive dynamics within each application segment. The market size for the aircraft application segment is estimated to be xx Million in 2025, with significant growth anticipated for the rapidly expanding UAV and spacecraft segments throughout the forecast period. Material: The report categorizes materials into Alloys (e.g., titanium, aluminum, nickel-based), Special Metals (e.g., refractory metals), and Other Materials (e.g., high-performance polymers, ceramics, composites). While alloys and special metals currently dominate due to their established performance characteristics in aerospace, other advanced materials are projected to gain substantial traction in the coming years, driven by a balance of evolving cost-effectiveness and performance requirements tailored to specific applications.
Key Drivers of 3D Printing in Aerospace Market Growth
The substantial growth of the 3D printing in aerospace market is underpinned by several critical factors. Foremost among these is the persistent demand for lightweight yet exceptionally strong components, which directly contribute to improved fuel efficiency and payload capacity. The ability of 3D printing to significantly reduce manufacturing lead times, from weeks or months to days, is revolutionizing supply chains and enabling more agile development. The inherent design freedom offered by additive manufacturing allows for the creation of complex geometries and integrated functionalities that are impossible with traditional subtractive methods, leading to parts with enhanced performance and reduced assembly requirements. Furthermore, the cost-effectiveness of 3D printing, particularly for complex, low-volume, or customized parts, is a major incentive. Supportive government initiatives and aerospace industry bodies actively promoting the adoption of additive manufacturing, coupled with continuous technological advancements in printers, materials, and software, are further accelerating market expansion.
Challenges in the 3D Printing in Aerospace Market Sector
Challenges include the high cost of 3D printing equipment, the need for skilled operators, stringent quality control requirements, and the need for material certification for aerospace applications. Supply chain disruptions and competitive pressures also pose challenges to market growth. These factors can impact market expansion by xx Million annually.
Emerging Opportunities in 3D Printing in Aerospace Market
The landscape of 3D printing in aerospace is ripe with emerging opportunities that promise to redefine the industry. A significant avenue lies in the continued development and qualification of new materials with advanced properties, such as increased thermal resistance, enhanced fatigue life, and novel functionalities. The integration of Artificial Intelligence (AI) and Machine Learning (ML) into 3D printing workflows presents a transformative opportunity for optimizing print parameters, ensuring real-time quality control, and enabling predictive maintenance of printing equipment. The expanding market for Unmanned Aerial Vehicles (UAVs) is a particularly fertile ground, offering substantial opportunities for the cost-effective and rapid production of specialized components. Beyond traditional aerospace structures, there is a growing potential for 3D printing in novel applications, including the creation of customized medical devices for astronauts, advanced in-space manufacturing capabilities, and innovative solutions for satellite constellations.
Leading Players in the 3D Printing in Aerospace Market Market
- ENVISIONTEC US LLC
- TRUMPF SE + Co KG
- Renishaw PLC
- OC Oerlikon Management AG
- 3D Systems Corporation
- Norsk Titanium AS
- Hoganas A
- EOS GmbH
- Ultimaker BV
- Stratasys Ltd
- MATERIALSE NV
- GE Additive (General Electric Company)
Key Developments in 3D Printing in Aerospace Market Industry
- October 2023: Stratasys Ltd announces a new high-temperature polymer for aerospace applications.
- July 2023: GE Additive launches a new metal 3D printing system with increased speed and precision.
- March 2023: A major aerospace company announces a partnership with a 3D printing firm to develop next-generation aircraft components.
Future Outlook for 3D Printing in Aerospace Market Market
The future of 3D printing in aerospace is bright, driven by continuous technological advancements, increasing demand for lightweight and high-performance components, and supportive government regulations. The market is poised for substantial growth, with significant opportunities for companies that can innovate and adapt to evolving market demands. Strategic partnerships and investments in R&D are expected to play a key role in shaping the future of this market.
3D Printing in Aerospace Market Segmentation
- 1. Production Analysis
- 2. Consumption Analysis
- 3. Import Market Analysis (Value & Volume)
- 4. Export Market Analysis (Value & Volume)
- 5. Price Trend Analysis
3D Printing in Aerospace Market Segmentation By Geography
-
1. North America
- 1.1. United States
- 1.2. Canada
- 1.3. Mexico
-
2. South America
- 2.1. Brazil
- 2.2. Argentina
- 2.3. Rest of South America
-
3. Europe
- 3.1. United Kingdom
- 3.2. Germany
- 3.3. France
- 3.4. Italy
- 3.5. Spain
- 3.6. Russia
- 3.7. Benelux
- 3.8. Nordics
- 3.9. Rest of Europe
-
4. Middle East & Africa
- 4.1. Turkey
- 4.2. Israel
- 4.3. GCC
- 4.4. North Africa
- 4.5. South Africa
- 4.6. Rest of Middle East & Africa
-
5. Asia Pacific
- 5.1. China
- 5.2. India
- 5.3. Japan
- 5.4. South Korea
- 5.5. ASEAN
- 5.6. Oceania
- 5.7. Rest of Asia Pacific
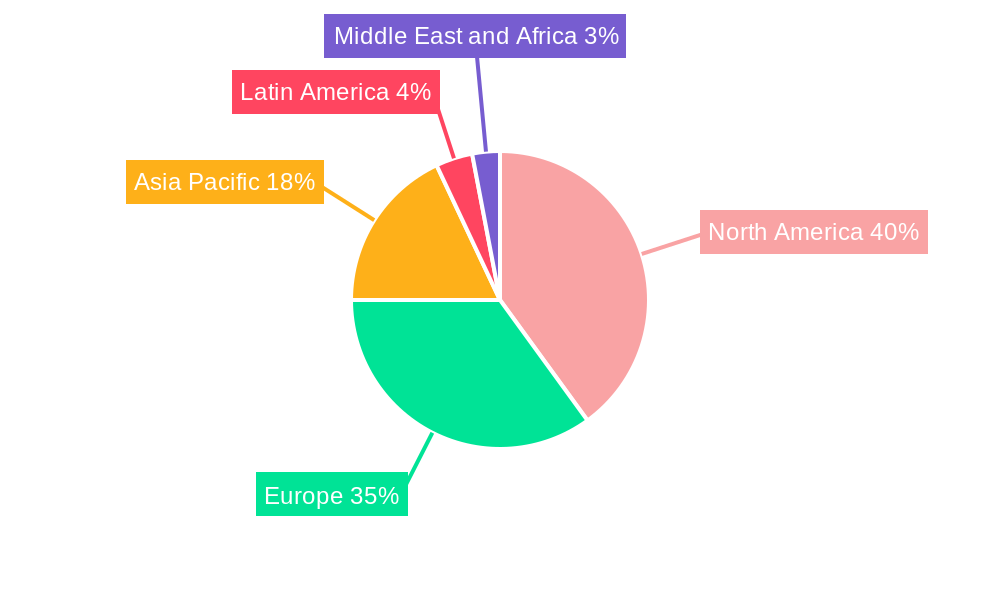
3D Printing in Aerospace Market Regional Market Share
Geographic Coverage of 3D Printing in Aerospace Market
3D Printing in Aerospace Market REPORT HIGHLIGHTS
| Aspects | Details |
|---|---|
| Study Period | 2020-2034 |
| Base Year | 2025 |
| Estimated Year | 2026 |
| Forecast Period | 2026-2034 |
| Historical Period | 2020-2025 |
| Growth Rate | CAGR of 18.57% from 2020-2034 |
| Segmentation |
|
Table of Contents
- 1. Introduction
- 1.1. Research Scope
- 1.2. Market Segmentation
- 1.3. Research Objective
- 1.4. Definitions and Assumptions
- 2. Executive Summary
- 2.1. Market Snapshot
- 3. Market Dynamics
- 3.1. Market Drivers
- 3.2. Market Restrains
- 3.3. Market Trends
- 3.4. Market Opportunities
- 4. Market Factor Analysis
- 4.1. Porters Five Forces
- 4.1.1. Bargaining Power of Suppliers
- 4.1.2. Bargaining Power of Buyers
- 4.1.3. Threat of New Entrants
- 4.1.4. Threat of Substitutes
- 4.1.5. Competitive Rivalry
- 4.2. PESTEL analysis
- 4.3. BCG Analysis
- 4.3.1. Stars (High Growth, High Market Share)
- 4.3.2. Cash Cows (Low Growth, High Market Share)
- 4.3.3. Question Mark (High Growth, Low Market Share)
- 4.3.4. Dogs (Low Growth, Low Market Share)
- 4.4. Ansoff Matrix Analysis
- 4.5. Supply Chain Analysis
- 4.6. Regulatory Landscape
- 4.7. Current Market Potential and Opportunity Assessment (TAM–SAM–SOM Framework)
- 4.8. PRI Analyst Note
- 4.1. Porters Five Forces
- 5. Market Analysis, Insights and Forecast 2021-2033
- 5.1. Market Analysis, Insights and Forecast - by Production Analysis
- 5.2. Market Analysis, Insights and Forecast - by Consumption Analysis
- 5.3. Market Analysis, Insights and Forecast - by Import Market Analysis (Value & Volume)
- 5.4. Market Analysis, Insights and Forecast - by Export Market Analysis (Value & Volume)
- 5.5. Market Analysis, Insights and Forecast - by Price Trend Analysis
- 5.6. Market Analysis, Insights and Forecast - by Region
- 5.6.1. North America
- 5.6.2. South America
- 5.6.3. Europe
- 5.6.4. Middle East & Africa
- 5.6.5. Asia Pacific
- 6. Global 3D Printing in Aerospace Market Analysis, Insights and Forecast, 2021-2033
- 6.1. Market Analysis, Insights and Forecast - by Production Analysis
- 6.2. Market Analysis, Insights and Forecast - by Consumption Analysis
- 6.3. Market Analysis, Insights and Forecast - by Import Market Analysis (Value & Volume)
- 6.4. Market Analysis, Insights and Forecast - by Export Market Analysis (Value & Volume)
- 6.5. Market Analysis, Insights and Forecast - by Price Trend Analysis
- 7. North America 3D Printing in Aerospace Market Analysis, Insights and Forecast, 2020-2032
- 7.1. Market Analysis, Insights and Forecast - by Production Analysis
- 7.2. Market Analysis, Insights and Forecast - by Consumption Analysis
- 7.3. Market Analysis, Insights and Forecast - by Import Market Analysis (Value & Volume)
- 7.4. Market Analysis, Insights and Forecast - by Export Market Analysis (Value & Volume)
- 7.5. Market Analysis, Insights and Forecast - by Price Trend Analysis
- 8. South America 3D Printing in Aerospace Market Analysis, Insights and Forecast, 2020-2032
- 8.1. Market Analysis, Insights and Forecast - by Production Analysis
- 8.2. Market Analysis, Insights and Forecast - by Consumption Analysis
- 8.3. Market Analysis, Insights and Forecast - by Import Market Analysis (Value & Volume)
- 8.4. Market Analysis, Insights and Forecast - by Export Market Analysis (Value & Volume)
- 8.5. Market Analysis, Insights and Forecast - by Price Trend Analysis
- 9. Europe 3D Printing in Aerospace Market Analysis, Insights and Forecast, 2020-2032
- 9.1. Market Analysis, Insights and Forecast - by Production Analysis
- 9.2. Market Analysis, Insights and Forecast - by Consumption Analysis
- 9.3. Market Analysis, Insights and Forecast - by Import Market Analysis (Value & Volume)
- 9.4. Market Analysis, Insights and Forecast - by Export Market Analysis (Value & Volume)
- 9.5. Market Analysis, Insights and Forecast - by Price Trend Analysis
- 10. Middle East & Africa 3D Printing in Aerospace Market Analysis, Insights and Forecast, 2020-2032
- 10.1. Market Analysis, Insights and Forecast - by Production Analysis
- 10.2. Market Analysis, Insights and Forecast - by Consumption Analysis
- 10.3. Market Analysis, Insights and Forecast - by Import Market Analysis (Value & Volume)
- 10.4. Market Analysis, Insights and Forecast - by Export Market Analysis (Value & Volume)
- 10.5. Market Analysis, Insights and Forecast - by Price Trend Analysis
- 11. Asia Pacific 3D Printing in Aerospace Market Analysis, Insights and Forecast, 2020-2032
- 11.1. Market Analysis, Insights and Forecast - by Production Analysis
- 11.2. Market Analysis, Insights and Forecast - by Consumption Analysis
- 11.3. Market Analysis, Insights and Forecast - by Import Market Analysis (Value & Volume)
- 11.4. Market Analysis, Insights and Forecast - by Export Market Analysis (Value & Volume)
- 11.5. Market Analysis, Insights and Forecast - by Price Trend Analysis
- 12. Competitive Analysis
- 12.1. Company Profiles
- 12.1.1 ENVISIONTEC US LLC
- 12.1.1.1. Company Overview
- 12.1.1.2. Products
- 12.1.1.3. Company Financials
- 12.1.1.4. SWOT Analysis
- 12.1.2 TRUMPF SE + Co KG
- 12.1.2.1. Company Overview
- 12.1.2.2. Products
- 12.1.2.3. Company Financials
- 12.1.2.4. SWOT Analysis
- 12.1.3 Renishaw PLC
- 12.1.3.1. Company Overview
- 12.1.3.2. Products
- 12.1.3.3. Company Financials
- 12.1.3.4. SWOT Analysis
- 12.1.4 OC Oerlikon Management AG
- 12.1.4.1. Company Overview
- 12.1.4.2. Products
- 12.1.4.3. Company Financials
- 12.1.4.4. SWOT Analysis
- 12.1.5 3D Systems Corporation
- 12.1.5.1. Company Overview
- 12.1.5.2. Products
- 12.1.5.3. Company Financials
- 12.1.5.4. SWOT Analysis
- 12.1.6 Norsk Titanium AS
- 12.1.6.1. Company Overview
- 12.1.6.2. Products
- 12.1.6.3. Company Financials
- 12.1.6.4. SWOT Analysis
- 12.1.7 Hoganas A
- 12.1.7.1. Company Overview
- 12.1.7.2. Products
- 12.1.7.3. Company Financials
- 12.1.7.4. SWOT Analysis
- 12.1.8 EOS GmbH
- 12.1.8.1. Company Overview
- 12.1.8.2. Products
- 12.1.8.3. Company Financials
- 12.1.8.4. SWOT Analysis
- 12.1.9 Ultimaker BV
- 12.1.9.1. Company Overview
- 12.1.9.2. Products
- 12.1.9.3. Company Financials
- 12.1.9.4. SWOT Analysis
- 12.1.10 Stratasys Ltd
- 12.1.10.1. Company Overview
- 12.1.10.2. Products
- 12.1.10.3. Company Financials
- 12.1.10.4. SWOT Analysis
- 12.1.11 MATERIALSE NV
- 12.1.11.1. Company Overview
- 12.1.11.2. Products
- 12.1.11.3. Company Financials
- 12.1.11.4. SWOT Analysis
- 12.1.12 GE Additive (General Electric Company)
- 12.1.12.1. Company Overview
- 12.1.12.2. Products
- 12.1.12.3. Company Financials
- 12.1.12.4. SWOT Analysis
- 12.1.1 ENVISIONTEC US LLC
- 12.2. Market Entropy
- 12.2.1 Company's Key Areas Served
- 12.2.2 Recent Developments
- 12.3. Company Market Share Analysis 2025
- 12.3.1 Top 5 Companies Market Share Analysis
- 12.3.2 Top 3 Companies Market Share Analysis
- 12.4. List of Potential Customers
- 13. Research Methodology
List of Figures
- Figure 1: Global 3D Printing in Aerospace Market Revenue Breakdown (Million, %) by Region 2025 & 2033
- Figure 2: North America 3D Printing in Aerospace Market Revenue (Million), by Production Analysis 2025 & 2033
- Figure 3: North America 3D Printing in Aerospace Market Revenue Share (%), by Production Analysis 2025 & 2033
- Figure 4: North America 3D Printing in Aerospace Market Revenue (Million), by Consumption Analysis 2025 & 2033
- Figure 5: North America 3D Printing in Aerospace Market Revenue Share (%), by Consumption Analysis 2025 & 2033
- Figure 6: North America 3D Printing in Aerospace Market Revenue (Million), by Import Market Analysis (Value & Volume) 2025 & 2033
- Figure 7: North America 3D Printing in Aerospace Market Revenue Share (%), by Import Market Analysis (Value & Volume) 2025 & 2033
- Figure 8: North America 3D Printing in Aerospace Market Revenue (Million), by Export Market Analysis (Value & Volume) 2025 & 2033
- Figure 9: North America 3D Printing in Aerospace Market Revenue Share (%), by Export Market Analysis (Value & Volume) 2025 & 2033
- Figure 10: North America 3D Printing in Aerospace Market Revenue (Million), by Price Trend Analysis 2025 & 2033
- Figure 11: North America 3D Printing in Aerospace Market Revenue Share (%), by Price Trend Analysis 2025 & 2033
- Figure 12: North America 3D Printing in Aerospace Market Revenue (Million), by Country 2025 & 2033
- Figure 13: North America 3D Printing in Aerospace Market Revenue Share (%), by Country 2025 & 2033
- Figure 14: South America 3D Printing in Aerospace Market Revenue (Million), by Production Analysis 2025 & 2033
- Figure 15: South America 3D Printing in Aerospace Market Revenue Share (%), by Production Analysis 2025 & 2033
- Figure 16: South America 3D Printing in Aerospace Market Revenue (Million), by Consumption Analysis 2025 & 2033
- Figure 17: South America 3D Printing in Aerospace Market Revenue Share (%), by Consumption Analysis 2025 & 2033
- Figure 18: South America 3D Printing in Aerospace Market Revenue (Million), by Import Market Analysis (Value & Volume) 2025 & 2033
- Figure 19: South America 3D Printing in Aerospace Market Revenue Share (%), by Import Market Analysis (Value & Volume) 2025 & 2033
- Figure 20: South America 3D Printing in Aerospace Market Revenue (Million), by Export Market Analysis (Value & Volume) 2025 & 2033
- Figure 21: South America 3D Printing in Aerospace Market Revenue Share (%), by Export Market Analysis (Value & Volume) 2025 & 2033
- Figure 22: South America 3D Printing in Aerospace Market Revenue (Million), by Price Trend Analysis 2025 & 2033
- Figure 23: South America 3D Printing in Aerospace Market Revenue Share (%), by Price Trend Analysis 2025 & 2033
- Figure 24: South America 3D Printing in Aerospace Market Revenue (Million), by Country 2025 & 2033
- Figure 25: South America 3D Printing in Aerospace Market Revenue Share (%), by Country 2025 & 2033
- Figure 26: Europe 3D Printing in Aerospace Market Revenue (Million), by Production Analysis 2025 & 2033
- Figure 27: Europe 3D Printing in Aerospace Market Revenue Share (%), by Production Analysis 2025 & 2033
- Figure 28: Europe 3D Printing in Aerospace Market Revenue (Million), by Consumption Analysis 2025 & 2033
- Figure 29: Europe 3D Printing in Aerospace Market Revenue Share (%), by Consumption Analysis 2025 & 2033
- Figure 30: Europe 3D Printing in Aerospace Market Revenue (Million), by Import Market Analysis (Value & Volume) 2025 & 2033
- Figure 31: Europe 3D Printing in Aerospace Market Revenue Share (%), by Import Market Analysis (Value & Volume) 2025 & 2033
- Figure 32: Europe 3D Printing in Aerospace Market Revenue (Million), by Export Market Analysis (Value & Volume) 2025 & 2033
- Figure 33: Europe 3D Printing in Aerospace Market Revenue Share (%), by Export Market Analysis (Value & Volume) 2025 & 2033
- Figure 34: Europe 3D Printing in Aerospace Market Revenue (Million), by Price Trend Analysis 2025 & 2033
- Figure 35: Europe 3D Printing in Aerospace Market Revenue Share (%), by Price Trend Analysis 2025 & 2033
- Figure 36: Europe 3D Printing in Aerospace Market Revenue (Million), by Country 2025 & 2033
- Figure 37: Europe 3D Printing in Aerospace Market Revenue Share (%), by Country 2025 & 2033
- Figure 38: Middle East & Africa 3D Printing in Aerospace Market Revenue (Million), by Production Analysis 2025 & 2033
- Figure 39: Middle East & Africa 3D Printing in Aerospace Market Revenue Share (%), by Production Analysis 2025 & 2033
- Figure 40: Middle East & Africa 3D Printing in Aerospace Market Revenue (Million), by Consumption Analysis 2025 & 2033
- Figure 41: Middle East & Africa 3D Printing in Aerospace Market Revenue Share (%), by Consumption Analysis 2025 & 2033
- Figure 42: Middle East & Africa 3D Printing in Aerospace Market Revenue (Million), by Import Market Analysis (Value & Volume) 2025 & 2033
- Figure 43: Middle East & Africa 3D Printing in Aerospace Market Revenue Share (%), by Import Market Analysis (Value & Volume) 2025 & 2033
- Figure 44: Middle East & Africa 3D Printing in Aerospace Market Revenue (Million), by Export Market Analysis (Value & Volume) 2025 & 2033
- Figure 45: Middle East & Africa 3D Printing in Aerospace Market Revenue Share (%), by Export Market Analysis (Value & Volume) 2025 & 2033
- Figure 46: Middle East & Africa 3D Printing in Aerospace Market Revenue (Million), by Price Trend Analysis 2025 & 2033
- Figure 47: Middle East & Africa 3D Printing in Aerospace Market Revenue Share (%), by Price Trend Analysis 2025 & 2033
- Figure 48: Middle East & Africa 3D Printing in Aerospace Market Revenue (Million), by Country 2025 & 2033
- Figure 49: Middle East & Africa 3D Printing in Aerospace Market Revenue Share (%), by Country 2025 & 2033
- Figure 50: Asia Pacific 3D Printing in Aerospace Market Revenue (Million), by Production Analysis 2025 & 2033
- Figure 51: Asia Pacific 3D Printing in Aerospace Market Revenue Share (%), by Production Analysis 2025 & 2033
- Figure 52: Asia Pacific 3D Printing in Aerospace Market Revenue (Million), by Consumption Analysis 2025 & 2033
- Figure 53: Asia Pacific 3D Printing in Aerospace Market Revenue Share (%), by Consumption Analysis 2025 & 2033
- Figure 54: Asia Pacific 3D Printing in Aerospace Market Revenue (Million), by Import Market Analysis (Value & Volume) 2025 & 2033
- Figure 55: Asia Pacific 3D Printing in Aerospace Market Revenue Share (%), by Import Market Analysis (Value & Volume) 2025 & 2033
- Figure 56: Asia Pacific 3D Printing in Aerospace Market Revenue (Million), by Export Market Analysis (Value & Volume) 2025 & 2033
- Figure 57: Asia Pacific 3D Printing in Aerospace Market Revenue Share (%), by Export Market Analysis (Value & Volume) 2025 & 2033
- Figure 58: Asia Pacific 3D Printing in Aerospace Market Revenue (Million), by Price Trend Analysis 2025 & 2033
- Figure 59: Asia Pacific 3D Printing in Aerospace Market Revenue Share (%), by Price Trend Analysis 2025 & 2033
- Figure 60: Asia Pacific 3D Printing in Aerospace Market Revenue (Million), by Country 2025 & 2033
- Figure 61: Asia Pacific 3D Printing in Aerospace Market Revenue Share (%), by Country 2025 & 2033
List of Tables
- Table 1: Global 3D Printing in Aerospace Market Revenue Million Forecast, by Production Analysis 2020 & 2033
- Table 2: Global 3D Printing in Aerospace Market Revenue Million Forecast, by Consumption Analysis 2020 & 2033
- Table 3: Global 3D Printing in Aerospace Market Revenue Million Forecast, by Import Market Analysis (Value & Volume) 2020 & 2033
- Table 4: Global 3D Printing in Aerospace Market Revenue Million Forecast, by Export Market Analysis (Value & Volume) 2020 & 2033
- Table 5: Global 3D Printing in Aerospace Market Revenue Million Forecast, by Price Trend Analysis 2020 & 2033
- Table 6: Global 3D Printing in Aerospace Market Revenue Million Forecast, by Region 2020 & 2033
- Table 7: Global 3D Printing in Aerospace Market Revenue Million Forecast, by Production Analysis 2020 & 2033
- Table 8: Global 3D Printing in Aerospace Market Revenue Million Forecast, by Consumption Analysis 2020 & 2033
- Table 9: Global 3D Printing in Aerospace Market Revenue Million Forecast, by Import Market Analysis (Value & Volume) 2020 & 2033
- Table 10: Global 3D Printing in Aerospace Market Revenue Million Forecast, by Export Market Analysis (Value & Volume) 2020 & 2033
- Table 11: Global 3D Printing in Aerospace Market Revenue Million Forecast, by Price Trend Analysis 2020 & 2033
- Table 12: Global 3D Printing in Aerospace Market Revenue Million Forecast, by Country 2020 & 2033
- Table 13: United States 3D Printing in Aerospace Market Revenue (Million) Forecast, by Application 2020 & 2033
- Table 14: Canada 3D Printing in Aerospace Market Revenue (Million) Forecast, by Application 2020 & 2033
- Table 15: Mexico 3D Printing in Aerospace Market Revenue (Million) Forecast, by Application 2020 & 2033
- Table 16: Global 3D Printing in Aerospace Market Revenue Million Forecast, by Production Analysis 2020 & 2033
- Table 17: Global 3D Printing in Aerospace Market Revenue Million Forecast, by Consumption Analysis 2020 & 2033
- Table 18: Global 3D Printing in Aerospace Market Revenue Million Forecast, by Import Market Analysis (Value & Volume) 2020 & 2033
- Table 19: Global 3D Printing in Aerospace Market Revenue Million Forecast, by Export Market Analysis (Value & Volume) 2020 & 2033
- Table 20: Global 3D Printing in Aerospace Market Revenue Million Forecast, by Price Trend Analysis 2020 & 2033
- Table 21: Global 3D Printing in Aerospace Market Revenue Million Forecast, by Country 2020 & 2033
- Table 22: Brazil 3D Printing in Aerospace Market Revenue (Million) Forecast, by Application 2020 & 2033
- Table 23: Argentina 3D Printing in Aerospace Market Revenue (Million) Forecast, by Application 2020 & 2033
- Table 24: Rest of South America 3D Printing in Aerospace Market Revenue (Million) Forecast, by Application 2020 & 2033
- Table 25: Global 3D Printing in Aerospace Market Revenue Million Forecast, by Production Analysis 2020 & 2033
- Table 26: Global 3D Printing in Aerospace Market Revenue Million Forecast, by Consumption Analysis 2020 & 2033
- Table 27: Global 3D Printing in Aerospace Market Revenue Million Forecast, by Import Market Analysis (Value & Volume) 2020 & 2033
- Table 28: Global 3D Printing in Aerospace Market Revenue Million Forecast, by Export Market Analysis (Value & Volume) 2020 & 2033
- Table 29: Global 3D Printing in Aerospace Market Revenue Million Forecast, by Price Trend Analysis 2020 & 2033
- Table 30: Global 3D Printing in Aerospace Market Revenue Million Forecast, by Country 2020 & 2033
- Table 31: United Kingdom 3D Printing in Aerospace Market Revenue (Million) Forecast, by Application 2020 & 2033
- Table 32: Germany 3D Printing in Aerospace Market Revenue (Million) Forecast, by Application 2020 & 2033
- Table 33: France 3D Printing in Aerospace Market Revenue (Million) Forecast, by Application 2020 & 2033
- Table 34: Italy 3D Printing in Aerospace Market Revenue (Million) Forecast, by Application 2020 & 2033
- Table 35: Spain 3D Printing in Aerospace Market Revenue (Million) Forecast, by Application 2020 & 2033
- Table 36: Russia 3D Printing in Aerospace Market Revenue (Million) Forecast, by Application 2020 & 2033
- Table 37: Benelux 3D Printing in Aerospace Market Revenue (Million) Forecast, by Application 2020 & 2033
- Table 38: Nordics 3D Printing in Aerospace Market Revenue (Million) Forecast, by Application 2020 & 2033
- Table 39: Rest of Europe 3D Printing in Aerospace Market Revenue (Million) Forecast, by Application 2020 & 2033
- Table 40: Global 3D Printing in Aerospace Market Revenue Million Forecast, by Production Analysis 2020 & 2033
- Table 41: Global 3D Printing in Aerospace Market Revenue Million Forecast, by Consumption Analysis 2020 & 2033
- Table 42: Global 3D Printing in Aerospace Market Revenue Million Forecast, by Import Market Analysis (Value & Volume) 2020 & 2033
- Table 43: Global 3D Printing in Aerospace Market Revenue Million Forecast, by Export Market Analysis (Value & Volume) 2020 & 2033
- Table 44: Global 3D Printing in Aerospace Market Revenue Million Forecast, by Price Trend Analysis 2020 & 2033
- Table 45: Global 3D Printing in Aerospace Market Revenue Million Forecast, by Country 2020 & 2033
- Table 46: Turkey 3D Printing in Aerospace Market Revenue (Million) Forecast, by Application 2020 & 2033
- Table 47: Israel 3D Printing in Aerospace Market Revenue (Million) Forecast, by Application 2020 & 2033
- Table 48: GCC 3D Printing in Aerospace Market Revenue (Million) Forecast, by Application 2020 & 2033
- Table 49: North Africa 3D Printing in Aerospace Market Revenue (Million) Forecast, by Application 2020 & 2033
- Table 50: South Africa 3D Printing in Aerospace Market Revenue (Million) Forecast, by Application 2020 & 2033
- Table 51: Rest of Middle East & Africa 3D Printing in Aerospace Market Revenue (Million) Forecast, by Application 2020 & 2033
- Table 52: Global 3D Printing in Aerospace Market Revenue Million Forecast, by Production Analysis 2020 & 2033
- Table 53: Global 3D Printing in Aerospace Market Revenue Million Forecast, by Consumption Analysis 2020 & 2033
- Table 54: Global 3D Printing in Aerospace Market Revenue Million Forecast, by Import Market Analysis (Value & Volume) 2020 & 2033
- Table 55: Global 3D Printing in Aerospace Market Revenue Million Forecast, by Export Market Analysis (Value & Volume) 2020 & 2033
- Table 56: Global 3D Printing in Aerospace Market Revenue Million Forecast, by Price Trend Analysis 2020 & 2033
- Table 57: Global 3D Printing in Aerospace Market Revenue Million Forecast, by Country 2020 & 2033
- Table 58: China 3D Printing in Aerospace Market Revenue (Million) Forecast, by Application 2020 & 2033
- Table 59: India 3D Printing in Aerospace Market Revenue (Million) Forecast, by Application 2020 & 2033
- Table 60: Japan 3D Printing in Aerospace Market Revenue (Million) Forecast, by Application 2020 & 2033
- Table 61: South Korea 3D Printing in Aerospace Market Revenue (Million) Forecast, by Application 2020 & 2033
- Table 62: ASEAN 3D Printing in Aerospace Market Revenue (Million) Forecast, by Application 2020 & 2033
- Table 63: Oceania 3D Printing in Aerospace Market Revenue (Million) Forecast, by Application 2020 & 2033
- Table 64: Rest of Asia Pacific 3D Printing in Aerospace Market Revenue (Million) Forecast, by Application 2020 & 2033
Frequently Asked Questions
1. What is the projected Compound Annual Growth Rate (CAGR) of the 3D Printing in Aerospace Market?
The projected CAGR is approximately 18.57%.
2. Which companies are prominent players in the 3D Printing in Aerospace Market?
Key companies in the market include ENVISIONTEC US LLC, TRUMPF SE + Co KG, Renishaw PLC, OC Oerlikon Management AG, 3D Systems Corporation, Norsk Titanium AS, Hoganas A, EOS GmbH, Ultimaker BV, Stratasys Ltd, MATERIALSE NV, GE Additive (General Electric Company).
3. What are the main segments of the 3D Printing in Aerospace Market?
The market segments include Production Analysis, Consumption Analysis, Import Market Analysis (Value & Volume), Export Market Analysis (Value & Volume), Price Trend Analysis.
4. Can you provide details about the market size?
The market size is estimated to be USD 2.88 Million as of 2022.
5. What are some drivers contributing to market growth?
N/A
6. What are the notable trends driving market growth?
The Aircraft Segment is Projected to Witness Highest Growth During the Forecast Period.
7. Are there any restraints impacting market growth?
N/A
8. Can you provide examples of recent developments in the market?
N/A
9. What pricing options are available for accessing the report?
Pricing options include single-user, multi-user, and enterprise licenses priced at USD 4750, USD 5250, and USD 8750 respectively.
10. Is the market size provided in terms of value or volume?
The market size is provided in terms of value, measured in Million.
11. Are there any specific market keywords associated with the report?
Yes, the market keyword associated with the report is "3D Printing in Aerospace Market," which aids in identifying and referencing the specific market segment covered.
12. How do I determine which pricing option suits my needs best?
The pricing options vary based on user requirements and access needs. Individual users may opt for single-user licenses, while businesses requiring broader access may choose multi-user or enterprise licenses for cost-effective access to the report.
13. Are there any additional resources or data provided in the 3D Printing in Aerospace Market report?
While the report offers comprehensive insights, it's advisable to review the specific contents or supplementary materials provided to ascertain if additional resources or data are available.
14. How can I stay updated on further developments or reports in the 3D Printing in Aerospace Market?
To stay informed about further developments, trends, and reports in the 3D Printing in Aerospace Market, consider subscribing to industry newsletters, following relevant companies and organizations, or regularly checking reputable industry news sources and publications.
Methodology
Step 1 - Identification of Relevant Samples Size from Population Database


Step 2 - Approaches for Defining Global Market Size (Value, Volume* & Price*)

Note*: In applicable scenarios
Step 3 - Data Sources
Primary Research
- Web Analytics
- Survey Reports
- Research Institute
- Latest Research Reports
- Opinion Leaders
Secondary Research
- Annual Reports
- White Paper
- Latest Press Release
- Industry Association
- Paid Database
- Investor Presentations

Step 4 - Data Triangulation
Involves using different sources of information in order to increase the validity of a study
These sources are likely to be stakeholders in a program - participants, other researchers, program staff, other community members, and so on.
Then we put all data in single framework & apply various statistical tools to find out the dynamic on the market.
During the analysis stage, feedback from the stakeholder groups would be compared to determine areas of agreement as well as areas of divergence