

Key Insights
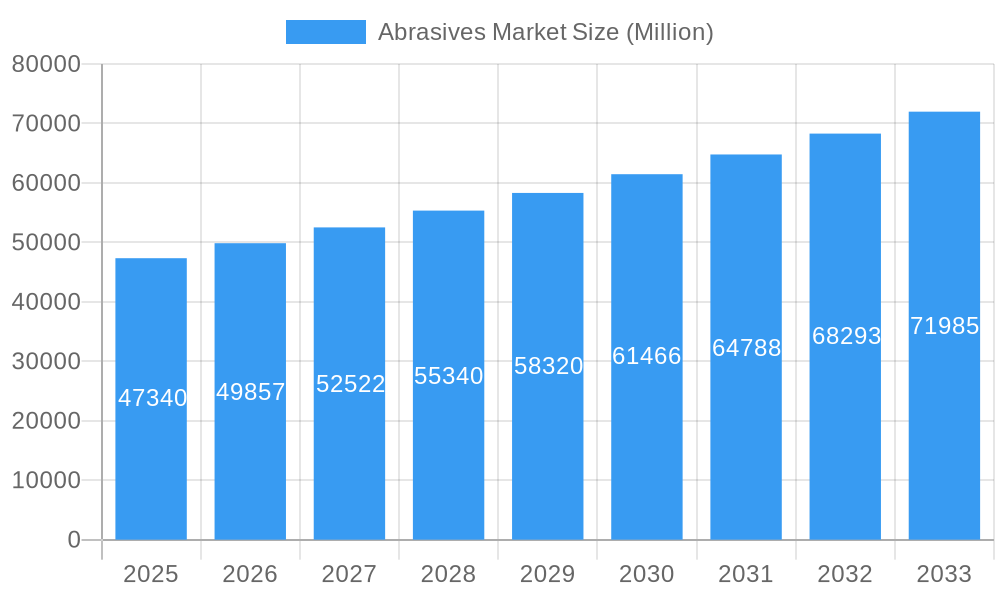
The global abrasives market, valued at $47.34 billion in 2025, is projected to experience robust growth, exhibiting a compound annual growth rate (CAGR) exceeding 5% from 2025 to 2033. This expansion is fueled by several key drivers. The burgeoning automotive and aerospace industries, demanding high-precision surface finishing, significantly contribute to market growth. Similarly, the increasing adoption of abrasives in electronics manufacturing for polishing and deburring processes fuels demand. Furthermore, the construction sector's reliance on abrasives for surface preparation and finishing activities adds to market momentum. Growth is also spurred by advancements in abrasive materials, particularly the development of high-performance synthetic abrasives offering improved cutting efficiency and durability. This technological progress allows for enhanced productivity and reduced manufacturing costs, driving adoption across various end-user industries.
Abrasives Market Market Size (In Billion)
However, the market faces certain restraints. Fluctuations in raw material prices, primarily for natural abrasives, can impact profitability and pricing strategies. Environmental regulations concerning the disposal of abrasive waste and concerns about worker safety related to abrasive usage also pose challenges. Nevertheless, the ongoing innovation in abrasive technology, coupled with expanding applications across diverse sectors like medical devices and oil & gas, is anticipated to mitigate these challenges and sustain market growth. Regional variations exist, with the Asia-Pacific region, particularly China and India, expected to dominate due to their extensive manufacturing bases and rapid industrialization. North America and Europe will also maintain significant market share, driven by established industries and technological advancements. The competitive landscape is characterized by a mix of large multinational corporations and specialized regional players, ensuring a dynamic and innovative market environment.
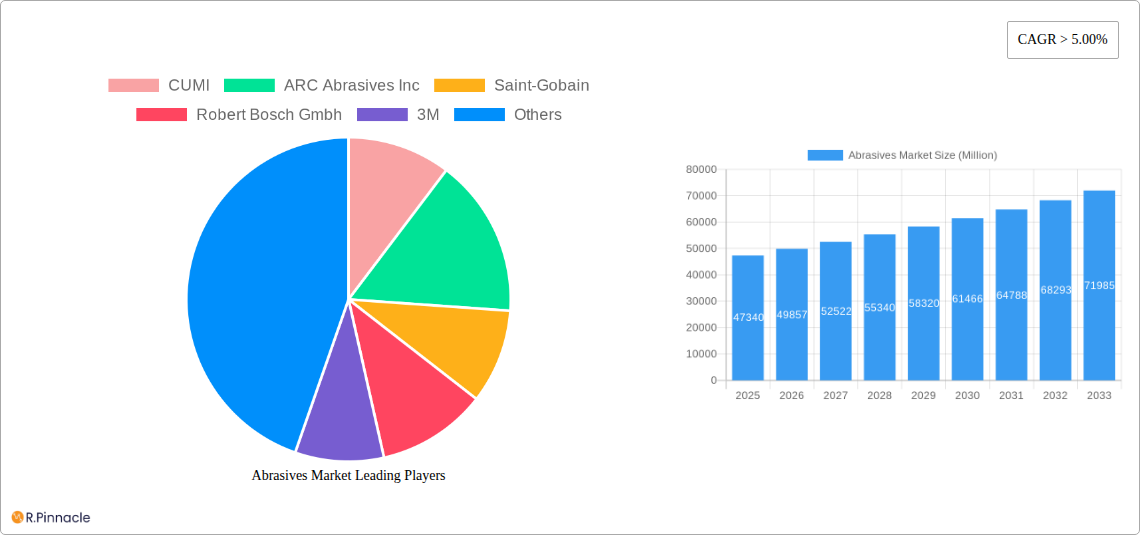
Abrasives Market Company Market Share
Abrasives Market Report: A Comprehensive Analysis (2019-2033)
This in-depth report provides a comprehensive analysis of the Abrasives Market, offering crucial insights for industry professionals, investors, and strategic decision-makers. With a detailed study period spanning from 2019 to 2033 (Base Year: 2025, Forecast Period: 2025-2033), this report unveils market trends, growth drivers, challenges, and opportunities. The report leverages extensive data analysis to forecast market size and growth across various segments.
Abrasives Market Structure & Innovation Trends
This section analyzes the competitive landscape of the Abrasives Market, focusing on market concentration, innovation drivers, regulatory frameworks, product substitutes, end-user demographics, and M&A activities. The market is moderately concentrated, with key players holding significant market share. However, the emergence of new technologies and smaller players is gradually changing this dynamic.
- Market Concentration: The top 10 players account for approximately xx% of the global market share in 2025.
- Innovation Drivers: Advancements in material science (e.g., development of super abrasives), automation in manufacturing processes, and growing demand for high-precision applications are key innovation drivers.
- Regulatory Frameworks: Environmental regulations (regarding dust and waste disposal) and safety standards significantly influence the market. Compliance costs can vary across regions.
- Product Substitutes: While traditional abrasives remain dominant, emerging technologies like laser cutting and waterjet cutting offer some level of substitution, albeit with limitations.
- End-user Demographics: The construction, automotive, and manufacturing sectors are the largest end-users, with significant demand expected from emerging economies.
- M&A Activities: Recent mergers and acquisitions (M&A) activities demonstrate industry consolidation and expansion strategies. For example, Sak Abrasives Limited's acquisition of Jowitt & Rodgers Co. (May 2023) expanded its product portfolio and market reach. The total value of M&A deals in the abrasives market from 2019-2024 was approximately $xx Million.
Abrasives Market Dynamics & Trends
The Abrasives Market is characterized by steady growth driven by industrialization, infrastructure development, and technological advancements. The market exhibits a Compound Annual Growth Rate (CAGR) of xx% during the forecast period (2025-2033). Key growth drivers include: rising demand from various end-user industries, especially in developing economies; technological innovations leading to improved abrasive materials and processes; and increasing adoption of automation in manufacturing. However, challenges like fluctuations in raw material prices and environmental concerns need to be addressed. Market penetration of advanced abrasive technologies such as super abrasives is expected to increase significantly over the forecast period. The market is becoming increasingly competitive, with companies focusing on product differentiation and innovation to gain a competitive edge.
Dominant Regions & Segments in Abrasives Market
This section identifies the leading regions and segments within the Abrasives Market.
- Leading Region: Asia-Pacific is projected to be the dominant region in 2025, driven by rapid industrialization and construction activities in countries like China and India. Other regions showing strong growth include North America and Europe.
- Dominant Material Segment: Synthetic abrasives dominate the market, owing to their superior performance and consistency compared to natural abrasives. The market share of synthetic abrasives is expected to be approximately xx% in 2025.
- Dominant Type Segment: Bonded abrasives hold the largest market share due to their wide range of applications across various industries. Coated abrasives are also a significant segment with considerable growth potential.
- Dominant End-user Industry: The metal manufacturing sector accounts for the largest share of abrasives consumption due to the extensive use of abrasive materials in machining, grinding, and polishing.
Key Drivers:
- Asia-Pacific: Rapid industrialization, expanding infrastructure, and growing automotive and electronics sectors.
- North America: Strong presence of major abrasive manufacturers, advanced manufacturing technologies, and high demand from aerospace and automotive industries.
- Europe: Well-established manufacturing base, strong focus on innovation, and high regulatory standards.
Abrasives Market Product Innovations
Recent innovations in the abrasives market focus on developing advanced materials with improved cutting efficiency, longer lifespan, and enhanced surface finish. These include nanostructured abrasives, advanced ceramic materials, and diamond/CBN super abrasives. The development of customized abrasive solutions for specific applications is also driving market growth. New applications are emerging in areas such as microelectronics, medical devices, and additive manufacturing. These innovations offer significant competitive advantages by enabling higher precision, increased productivity, and reduced manufacturing costs.
Report Scope & Segmentation Analysis
This report provides a detailed segmentation of the Abrasives Market based on material (Natural Abrasives, Synthetic Abrasives), type (Bonded Abrasives, Coated Abrasives, Super Abrasives), and end-user industry (Metal Manufacturing, Electronics, Construction, Automotive and Aerospace, Medical, Oil and Gas, Other End-user Industries). Each segment's growth projection, market size for 2025, and competitive dynamics are analyzed, providing a comprehensive understanding of the market structure.
Key Drivers of Abrasives Market Growth
Several factors contribute to the growth of the Abrasives Market. Firstly, the increasing demand from various end-user industries (automotive, construction, electronics) fuels market expansion. Secondly, technological advancements lead to more efficient and durable abrasive products. Finally, government infrastructure projects across various economies stimulate market demand.
Challenges in the Abrasives Market Sector
The Abrasives Market faces challenges including fluctuating raw material prices (e.g., diamond, silicon carbide), stringent environmental regulations impacting manufacturing processes, and intense competition among established players and new entrants. These factors can influence production costs and profitability.
Emerging Opportunities in Abrasives Market
Emerging opportunities include the growing adoption of advanced manufacturing technologies, the rise of sustainable and eco-friendly abrasive materials, and the expansion into new applications in sectors such as 3D printing and renewable energy. These factors offer considerable potential for market growth and expansion.
Leading Players in the Abrasives Market
- CUMI
- ARC Abrasives Inc
- Saint-Gobain
- Robert Bosch Gmbh
- 3M
- Deerfos
- Abrasive Technology Inc
- SAK Abrasives Limited
- Fujimi Incorporated
- Sia Abrasives Industries AG
- Klingspor AG
- Tyrolit - Schleifmittelwerke Swarovski AG & Co K g
Key Developments in Abrasives Market Industry
- May 2023: Sak Abrasives Limited acquired Jowitt & Rodgers Co., expanding its product portfolio.
- August 2022: Tyrolit acquired a majority stake in the Egeli Egesan Group, strengthening its presence in the Middle East.
Future Outlook for Abrasives Market
The Abrasives Market is poised for continued growth, driven by factors such as technological advancements, increasing industrialization, and rising infrastructure spending globally. Strategic partnerships, investments in R&D, and expansion into emerging markets will be crucial for companies to capitalize on future opportunities. The market is expected to witness further consolidation as companies seek to enhance their market share and expand their product offerings.
Abrasives Market Segmentation
- 1. Production Analysis
- 2. Consumption Analysis
- 3. Import Market Analysis (Value & Volume)
- 4. Export Market Analysis (Value & Volume)
- 5. Price Trend Analysis
Abrasives Market Segmentation By Geography
-
1. Asia Pacific
- 1.1. China
- 1.2. India
- 1.3. Japan
- 1.4. South Korea
- 1.5. Malaysia
- 1.6. Thailand
- 1.7. Indonesia
- 1.8. Vietnam
- 1.9. Rest of Asia Pacific
-
2. North America
- 2.1. United States
- 2.2. Canada
- 2.3. Mexico
-
3. Europe
- 3.1. Germany
- 3.2. United Kingdom
- 3.3. France
- 3.4. Italy
- 3.5. Spain
- 3.6. NORDIC Countries
- 3.7. Turkey
- 3.8. Russia
- 3.9. Rest of Europe
-
4. South America
- 4.1. Brazil
- 4.2. Argentina
- 4.3. Colombia
- 4.4. Rest of South America
-
5. Middle East and Africa
- 5.1. Saudi Arabia
- 5.2. Qatar
- 5.3. United Arab Emirates
- 5.4. Nigeria
- 5.5. Egypt
- 5.6. South Africa
- 5.7. Rest of Middle East and Africa
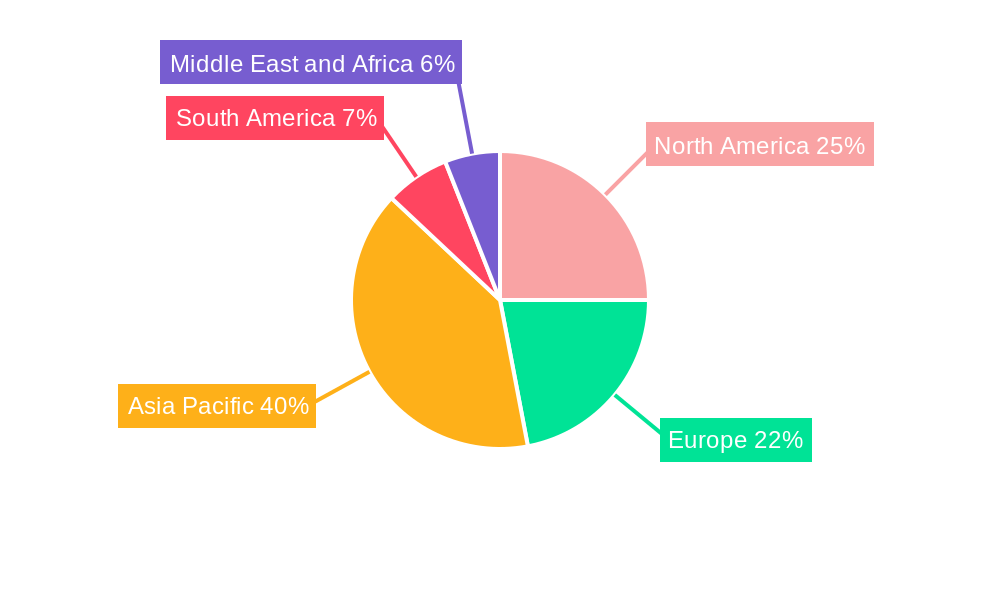
Abrasives Market Regional Market Share
Geographic Coverage of Abrasives Market
Abrasives Market REPORT HIGHLIGHTS
| Aspects | Details |
|---|---|
| Study Period | 2020-2034 |
| Base Year | 2025 |
| Estimated Year | 2026 |
| Forecast Period | 2026-2034 |
| Historical Period | 2020-2025 |
| Growth Rate | CAGR of 4.8% from 2020-2034 |
| Segmentation |
|
Table of Contents
- 1. Introduction
- 1.1. Research Scope
- 1.2. Market Segmentation
- 1.3. Research Objective
- 1.4. Definitions and Assumptions
- 2. Executive Summary
- 2.1. Market Snapshot
- 3. Market Dynamics
- 3.1. Market Drivers
- 3.2. Market Restrains
- 3.3. Market Trends
- 3.4. Market Opportunities
- 4. Market Factor Analysis
- 4.1. Porters Five Forces
- 4.1.1. Bargaining Power of Suppliers
- 4.1.2. Bargaining Power of Buyers
- 4.1.3. Threat of New Entrants
- 4.1.4. Threat of Substitutes
- 4.1.5. Competitive Rivalry
- 4.2. PESTEL analysis
- 4.3. BCG Analysis
- 4.3.1. Stars (High Growth, High Market Share)
- 4.3.2. Cash Cows (Low Growth, High Market Share)
- 4.3.3. Question Mark (High Growth, Low Market Share)
- 4.3.4. Dogs (Low Growth, Low Market Share)
- 4.4. Ansoff Matrix Analysis
- 4.5. Supply Chain Analysis
- 4.6. Regulatory Landscape
- 4.7. Current Market Potential and Opportunity Assessment (TAM–SAM–SOM Framework)
- 4.8. PRI Analyst Note
- 4.1. Porters Five Forces
- 5. Market Analysis, Insights and Forecast 2021-2033
- 5.1. Market Analysis, Insights and Forecast - by Production Analysis
- 5.2. Market Analysis, Insights and Forecast - by Consumption Analysis
- 5.3. Market Analysis, Insights and Forecast - by Import Market Analysis (Value & Volume)
- 5.4. Market Analysis, Insights and Forecast - by Export Market Analysis (Value & Volume)
- 5.5. Market Analysis, Insights and Forecast - by Price Trend Analysis
- 5.6. Market Analysis, Insights and Forecast - by Region
- 5.6.1. Asia Pacific
- 5.6.2. North America
- 5.6.3. Europe
- 5.6.4. South America
- 5.6.5. Middle East and Africa
- 6. Global Abrasives Market Analysis, Insights and Forecast, 2021-2033
- 6.1. Market Analysis, Insights and Forecast - by Production Analysis
- 6.2. Market Analysis, Insights and Forecast - by Consumption Analysis
- 6.3. Market Analysis, Insights and Forecast - by Import Market Analysis (Value & Volume)
- 6.4. Market Analysis, Insights and Forecast - by Export Market Analysis (Value & Volume)
- 6.5. Market Analysis, Insights and Forecast - by Price Trend Analysis
- 7. Asia Pacific Abrasives Market Analysis, Insights and Forecast, 2020-2032
- 7.1. Market Analysis, Insights and Forecast - by Production Analysis
- 7.2. Market Analysis, Insights and Forecast - by Consumption Analysis
- 7.3. Market Analysis, Insights and Forecast - by Import Market Analysis (Value & Volume)
- 7.4. Market Analysis, Insights and Forecast - by Export Market Analysis (Value & Volume)
- 7.5. Market Analysis, Insights and Forecast - by Price Trend Analysis
- 8. North America Abrasives Market Analysis, Insights and Forecast, 2020-2032
- 8.1. Market Analysis, Insights and Forecast - by Production Analysis
- 8.2. Market Analysis, Insights and Forecast - by Consumption Analysis
- 8.3. Market Analysis, Insights and Forecast - by Import Market Analysis (Value & Volume)
- 8.4. Market Analysis, Insights and Forecast - by Export Market Analysis (Value & Volume)
- 8.5. Market Analysis, Insights and Forecast - by Price Trend Analysis
- 9. Europe Abrasives Market Analysis, Insights and Forecast, 2020-2032
- 9.1. Market Analysis, Insights and Forecast - by Production Analysis
- 9.2. Market Analysis, Insights and Forecast - by Consumption Analysis
- 9.3. Market Analysis, Insights and Forecast - by Import Market Analysis (Value & Volume)
- 9.4. Market Analysis, Insights and Forecast - by Export Market Analysis (Value & Volume)
- 9.5. Market Analysis, Insights and Forecast - by Price Trend Analysis
- 10. South America Abrasives Market Analysis, Insights and Forecast, 2020-2032
- 10.1. Market Analysis, Insights and Forecast - by Production Analysis
- 10.2. Market Analysis, Insights and Forecast - by Consumption Analysis
- 10.3. Market Analysis, Insights and Forecast - by Import Market Analysis (Value & Volume)
- 10.4. Market Analysis, Insights and Forecast - by Export Market Analysis (Value & Volume)
- 10.5. Market Analysis, Insights and Forecast - by Price Trend Analysis
- 11. Middle East and Africa Abrasives Market Analysis, Insights and Forecast, 2020-2032
- 11.1. Market Analysis, Insights and Forecast - by Production Analysis
- 11.2. Market Analysis, Insights and Forecast - by Consumption Analysis
- 11.3. Market Analysis, Insights and Forecast - by Import Market Analysis (Value & Volume)
- 11.4. Market Analysis, Insights and Forecast - by Export Market Analysis (Value & Volume)
- 11.5. Market Analysis, Insights and Forecast - by Price Trend Analysis
- 12. Competitive Analysis
- 12.1. Company Profiles
- 12.1.1 CUMI
- 12.1.1.1. Company Overview
- 12.1.1.2. Products
- 12.1.1.3. Company Financials
- 12.1.1.4. SWOT Analysis
- 12.1.2 ARC Abrasives Inc
- 12.1.2.1. Company Overview
- 12.1.2.2. Products
- 12.1.2.3. Company Financials
- 12.1.2.4. SWOT Analysis
- 12.1.3 Saint-Gobain
- 12.1.3.1. Company Overview
- 12.1.3.2. Products
- 12.1.3.3. Company Financials
- 12.1.3.4. SWOT Analysis
- 12.1.4 Robert Bosch Gmbh
- 12.1.4.1. Company Overview
- 12.1.4.2. Products
- 12.1.4.3. Company Financials
- 12.1.4.4. SWOT Analysis
- 12.1.5 3M
- 12.1.5.1. Company Overview
- 12.1.5.2. Products
- 12.1.5.3. Company Financials
- 12.1.5.4. SWOT Analysis
- 12.1.6 Deerfos
- 12.1.6.1. Company Overview
- 12.1.6.2. Products
- 12.1.6.3. Company Financials
- 12.1.6.4. SWOT Analysis
- 12.1.7 Abrasive Technology Inc
- 12.1.7.1. Company Overview
- 12.1.7.2. Products
- 12.1.7.3. Company Financials
- 12.1.7.4. SWOT Analysis
- 12.1.8 SAK Abrasives Limited
- 12.1.8.1. Company Overview
- 12.1.8.2. Products
- 12.1.8.3. Company Financials
- 12.1.8.4. SWOT Analysis
- 12.1.9 Fujimi Incorporated
- 12.1.9.1. Company Overview
- 12.1.9.2. Products
- 12.1.9.3. Company Financials
- 12.1.9.4. SWOT Analysis
- 12.1.10 Sia Abrasives Industries AG
- 12.1.10.1. Company Overview
- 12.1.10.2. Products
- 12.1.10.3. Company Financials
- 12.1.10.4. SWOT Analysis
- 12.1.11 Klingspor AG
- 12.1.11.1. Company Overview
- 12.1.11.2. Products
- 12.1.11.3. Company Financials
- 12.1.11.4. SWOT Analysis
- 12.1.12 Tyrolit - Schleifmittelwerke Swarovski AG & Co K g *List Not Exhaustive
- 12.1.12.1. Company Overview
- 12.1.12.2. Products
- 12.1.12.3. Company Financials
- 12.1.12.4. SWOT Analysis
- 12.1.1 CUMI
- 12.2. Market Entropy
- 12.2.1 Company's Key Areas Served
- 12.2.2 Recent Developments
- 12.3. Company Market Share Analysis 2025
- 12.3.1 Top 5 Companies Market Share Analysis
- 12.3.2 Top 3 Companies Market Share Analysis
- 12.4. List of Potential Customers
- 13. Research Methodology
List of Figures
- Figure 1: Global Abrasives Market Revenue Breakdown (billion, %) by Region 2025 & 2033
- Figure 2: Asia Pacific Abrasives Market Revenue (billion), by Production Analysis 2025 & 2033
- Figure 3: Asia Pacific Abrasives Market Revenue Share (%), by Production Analysis 2025 & 2033
- Figure 4: Asia Pacific Abrasives Market Revenue (billion), by Consumption Analysis 2025 & 2033
- Figure 5: Asia Pacific Abrasives Market Revenue Share (%), by Consumption Analysis 2025 & 2033
- Figure 6: Asia Pacific Abrasives Market Revenue (billion), by Import Market Analysis (Value & Volume) 2025 & 2033
- Figure 7: Asia Pacific Abrasives Market Revenue Share (%), by Import Market Analysis (Value & Volume) 2025 & 2033
- Figure 8: Asia Pacific Abrasives Market Revenue (billion), by Export Market Analysis (Value & Volume) 2025 & 2033
- Figure 9: Asia Pacific Abrasives Market Revenue Share (%), by Export Market Analysis (Value & Volume) 2025 & 2033
- Figure 10: Asia Pacific Abrasives Market Revenue (billion), by Price Trend Analysis 2025 & 2033
- Figure 11: Asia Pacific Abrasives Market Revenue Share (%), by Price Trend Analysis 2025 & 2033
- Figure 12: Asia Pacific Abrasives Market Revenue (billion), by Country 2025 & 2033
- Figure 13: Asia Pacific Abrasives Market Revenue Share (%), by Country 2025 & 2033
- Figure 14: North America Abrasives Market Revenue (billion), by Production Analysis 2025 & 2033
- Figure 15: North America Abrasives Market Revenue Share (%), by Production Analysis 2025 & 2033
- Figure 16: North America Abrasives Market Revenue (billion), by Consumption Analysis 2025 & 2033
- Figure 17: North America Abrasives Market Revenue Share (%), by Consumption Analysis 2025 & 2033
- Figure 18: North America Abrasives Market Revenue (billion), by Import Market Analysis (Value & Volume) 2025 & 2033
- Figure 19: North America Abrasives Market Revenue Share (%), by Import Market Analysis (Value & Volume) 2025 & 2033
- Figure 20: North America Abrasives Market Revenue (billion), by Export Market Analysis (Value & Volume) 2025 & 2033
- Figure 21: North America Abrasives Market Revenue Share (%), by Export Market Analysis (Value & Volume) 2025 & 2033
- Figure 22: North America Abrasives Market Revenue (billion), by Price Trend Analysis 2025 & 2033
- Figure 23: North America Abrasives Market Revenue Share (%), by Price Trend Analysis 2025 & 2033
- Figure 24: North America Abrasives Market Revenue (billion), by Country 2025 & 2033
- Figure 25: North America Abrasives Market Revenue Share (%), by Country 2025 & 2033
- Figure 26: Europe Abrasives Market Revenue (billion), by Production Analysis 2025 & 2033
- Figure 27: Europe Abrasives Market Revenue Share (%), by Production Analysis 2025 & 2033
- Figure 28: Europe Abrasives Market Revenue (billion), by Consumption Analysis 2025 & 2033
- Figure 29: Europe Abrasives Market Revenue Share (%), by Consumption Analysis 2025 & 2033
- Figure 30: Europe Abrasives Market Revenue (billion), by Import Market Analysis (Value & Volume) 2025 & 2033
- Figure 31: Europe Abrasives Market Revenue Share (%), by Import Market Analysis (Value & Volume) 2025 & 2033
- Figure 32: Europe Abrasives Market Revenue (billion), by Export Market Analysis (Value & Volume) 2025 & 2033
- Figure 33: Europe Abrasives Market Revenue Share (%), by Export Market Analysis (Value & Volume) 2025 & 2033
- Figure 34: Europe Abrasives Market Revenue (billion), by Price Trend Analysis 2025 & 2033
- Figure 35: Europe Abrasives Market Revenue Share (%), by Price Trend Analysis 2025 & 2033
- Figure 36: Europe Abrasives Market Revenue (billion), by Country 2025 & 2033
- Figure 37: Europe Abrasives Market Revenue Share (%), by Country 2025 & 2033
- Figure 38: South America Abrasives Market Revenue (billion), by Production Analysis 2025 & 2033
- Figure 39: South America Abrasives Market Revenue Share (%), by Production Analysis 2025 & 2033
- Figure 40: South America Abrasives Market Revenue (billion), by Consumption Analysis 2025 & 2033
- Figure 41: South America Abrasives Market Revenue Share (%), by Consumption Analysis 2025 & 2033
- Figure 42: South America Abrasives Market Revenue (billion), by Import Market Analysis (Value & Volume) 2025 & 2033
- Figure 43: South America Abrasives Market Revenue Share (%), by Import Market Analysis (Value & Volume) 2025 & 2033
- Figure 44: South America Abrasives Market Revenue (billion), by Export Market Analysis (Value & Volume) 2025 & 2033
- Figure 45: South America Abrasives Market Revenue Share (%), by Export Market Analysis (Value & Volume) 2025 & 2033
- Figure 46: South America Abrasives Market Revenue (billion), by Price Trend Analysis 2025 & 2033
- Figure 47: South America Abrasives Market Revenue Share (%), by Price Trend Analysis 2025 & 2033
- Figure 48: South America Abrasives Market Revenue (billion), by Country 2025 & 2033
- Figure 49: South America Abrasives Market Revenue Share (%), by Country 2025 & 2033
- Figure 50: Middle East and Africa Abrasives Market Revenue (billion), by Production Analysis 2025 & 2033
- Figure 51: Middle East and Africa Abrasives Market Revenue Share (%), by Production Analysis 2025 & 2033
- Figure 52: Middle East and Africa Abrasives Market Revenue (billion), by Consumption Analysis 2025 & 2033
- Figure 53: Middle East and Africa Abrasives Market Revenue Share (%), by Consumption Analysis 2025 & 2033
- Figure 54: Middle East and Africa Abrasives Market Revenue (billion), by Import Market Analysis (Value & Volume) 2025 & 2033
- Figure 55: Middle East and Africa Abrasives Market Revenue Share (%), by Import Market Analysis (Value & Volume) 2025 & 2033
- Figure 56: Middle East and Africa Abrasives Market Revenue (billion), by Export Market Analysis (Value & Volume) 2025 & 2033
- Figure 57: Middle East and Africa Abrasives Market Revenue Share (%), by Export Market Analysis (Value & Volume) 2025 & 2033
- Figure 58: Middle East and Africa Abrasives Market Revenue (billion), by Price Trend Analysis 2025 & 2033
- Figure 59: Middle East and Africa Abrasives Market Revenue Share (%), by Price Trend Analysis 2025 & 2033
- Figure 60: Middle East and Africa Abrasives Market Revenue (billion), by Country 2025 & 2033
- Figure 61: Middle East and Africa Abrasives Market Revenue Share (%), by Country 2025 & 2033
List of Tables
- Table 1: Global Abrasives Market Revenue billion Forecast, by Production Analysis 2020 & 2033
- Table 2: Global Abrasives Market Revenue billion Forecast, by Consumption Analysis 2020 & 2033
- Table 3: Global Abrasives Market Revenue billion Forecast, by Import Market Analysis (Value & Volume) 2020 & 2033
- Table 4: Global Abrasives Market Revenue billion Forecast, by Export Market Analysis (Value & Volume) 2020 & 2033
- Table 5: Global Abrasives Market Revenue billion Forecast, by Price Trend Analysis 2020 & 2033
- Table 6: Global Abrasives Market Revenue billion Forecast, by Region 2020 & 2033
- Table 7: Global Abrasives Market Revenue billion Forecast, by Production Analysis 2020 & 2033
- Table 8: Global Abrasives Market Revenue billion Forecast, by Consumption Analysis 2020 & 2033
- Table 9: Global Abrasives Market Revenue billion Forecast, by Import Market Analysis (Value & Volume) 2020 & 2033
- Table 10: Global Abrasives Market Revenue billion Forecast, by Export Market Analysis (Value & Volume) 2020 & 2033
- Table 11: Global Abrasives Market Revenue billion Forecast, by Price Trend Analysis 2020 & 2033
- Table 12: Global Abrasives Market Revenue billion Forecast, by Country 2020 & 2033
- Table 13: China Abrasives Market Revenue (billion) Forecast, by Application 2020 & 2033
- Table 14: India Abrasives Market Revenue (billion) Forecast, by Application 2020 & 2033
- Table 15: Japan Abrasives Market Revenue (billion) Forecast, by Application 2020 & 2033
- Table 16: South Korea Abrasives Market Revenue (billion) Forecast, by Application 2020 & 2033
- Table 17: Malaysia Abrasives Market Revenue (billion) Forecast, by Application 2020 & 2033
- Table 18: Thailand Abrasives Market Revenue (billion) Forecast, by Application 2020 & 2033
- Table 19: Indonesia Abrasives Market Revenue (billion) Forecast, by Application 2020 & 2033
- Table 20: Vietnam Abrasives Market Revenue (billion) Forecast, by Application 2020 & 2033
- Table 21: Rest of Asia Pacific Abrasives Market Revenue (billion) Forecast, by Application 2020 & 2033
- Table 22: Global Abrasives Market Revenue billion Forecast, by Production Analysis 2020 & 2033
- Table 23: Global Abrasives Market Revenue billion Forecast, by Consumption Analysis 2020 & 2033
- Table 24: Global Abrasives Market Revenue billion Forecast, by Import Market Analysis (Value & Volume) 2020 & 2033
- Table 25: Global Abrasives Market Revenue billion Forecast, by Export Market Analysis (Value & Volume) 2020 & 2033
- Table 26: Global Abrasives Market Revenue billion Forecast, by Price Trend Analysis 2020 & 2033
- Table 27: Global Abrasives Market Revenue billion Forecast, by Country 2020 & 2033
- Table 28: United States Abrasives Market Revenue (billion) Forecast, by Application 2020 & 2033
- Table 29: Canada Abrasives Market Revenue (billion) Forecast, by Application 2020 & 2033
- Table 30: Mexico Abrasives Market Revenue (billion) Forecast, by Application 2020 & 2033
- Table 31: Global Abrasives Market Revenue billion Forecast, by Production Analysis 2020 & 2033
- Table 32: Global Abrasives Market Revenue billion Forecast, by Consumption Analysis 2020 & 2033
- Table 33: Global Abrasives Market Revenue billion Forecast, by Import Market Analysis (Value & Volume) 2020 & 2033
- Table 34: Global Abrasives Market Revenue billion Forecast, by Export Market Analysis (Value & Volume) 2020 & 2033
- Table 35: Global Abrasives Market Revenue billion Forecast, by Price Trend Analysis 2020 & 2033
- Table 36: Global Abrasives Market Revenue billion Forecast, by Country 2020 & 2033
- Table 37: Germany Abrasives Market Revenue (billion) Forecast, by Application 2020 & 2033
- Table 38: United Kingdom Abrasives Market Revenue (billion) Forecast, by Application 2020 & 2033
- Table 39: France Abrasives Market Revenue (billion) Forecast, by Application 2020 & 2033
- Table 40: Italy Abrasives Market Revenue (billion) Forecast, by Application 2020 & 2033
- Table 41: Spain Abrasives Market Revenue (billion) Forecast, by Application 2020 & 2033
- Table 42: NORDIC Countries Abrasives Market Revenue (billion) Forecast, by Application 2020 & 2033
- Table 43: Turkey Abrasives Market Revenue (billion) Forecast, by Application 2020 & 2033
- Table 44: Russia Abrasives Market Revenue (billion) Forecast, by Application 2020 & 2033
- Table 45: Rest of Europe Abrasives Market Revenue (billion) Forecast, by Application 2020 & 2033
- Table 46: Global Abrasives Market Revenue billion Forecast, by Production Analysis 2020 & 2033
- Table 47: Global Abrasives Market Revenue billion Forecast, by Consumption Analysis 2020 & 2033
- Table 48: Global Abrasives Market Revenue billion Forecast, by Import Market Analysis (Value & Volume) 2020 & 2033
- Table 49: Global Abrasives Market Revenue billion Forecast, by Export Market Analysis (Value & Volume) 2020 & 2033
- Table 50: Global Abrasives Market Revenue billion Forecast, by Price Trend Analysis 2020 & 2033
- Table 51: Global Abrasives Market Revenue billion Forecast, by Country 2020 & 2033
- Table 52: Brazil Abrasives Market Revenue (billion) Forecast, by Application 2020 & 2033
- Table 53: Argentina Abrasives Market Revenue (billion) Forecast, by Application 2020 & 2033
- Table 54: Colombia Abrasives Market Revenue (billion) Forecast, by Application 2020 & 2033
- Table 55: Rest of South America Abrasives Market Revenue (billion) Forecast, by Application 2020 & 2033
- Table 56: Global Abrasives Market Revenue billion Forecast, by Production Analysis 2020 & 2033
- Table 57: Global Abrasives Market Revenue billion Forecast, by Consumption Analysis 2020 & 2033
- Table 58: Global Abrasives Market Revenue billion Forecast, by Import Market Analysis (Value & Volume) 2020 & 2033
- Table 59: Global Abrasives Market Revenue billion Forecast, by Export Market Analysis (Value & Volume) 2020 & 2033
- Table 60: Global Abrasives Market Revenue billion Forecast, by Price Trend Analysis 2020 & 2033
- Table 61: Global Abrasives Market Revenue billion Forecast, by Country 2020 & 2033
- Table 62: Saudi Arabia Abrasives Market Revenue (billion) Forecast, by Application 2020 & 2033
- Table 63: Qatar Abrasives Market Revenue (billion) Forecast, by Application 2020 & 2033
- Table 64: United Arab Emirates Abrasives Market Revenue (billion) Forecast, by Application 2020 & 2033
- Table 65: Nigeria Abrasives Market Revenue (billion) Forecast, by Application 2020 & 2033
- Table 66: Egypt Abrasives Market Revenue (billion) Forecast, by Application 2020 & 2033
- Table 67: South Africa Abrasives Market Revenue (billion) Forecast, by Application 2020 & 2033
- Table 68: Rest of Middle East and Africa Abrasives Market Revenue (billion) Forecast, by Application 2020 & 2033
Frequently Asked Questions
1. What is the projected Compound Annual Growth Rate (CAGR) of the Abrasives Market?
The projected CAGR is approximately 4.8%.
2. Which companies are prominent players in the Abrasives Market?
Key companies in the market include CUMI, ARC Abrasives Inc, Saint-Gobain, Robert Bosch Gmbh, 3M, Deerfos, Abrasive Technology Inc, SAK Abrasives Limited, Fujimi Incorporated, Sia Abrasives Industries AG, Klingspor AG, Tyrolit - Schleifmittelwerke Swarovski AG & Co K g *List Not Exhaustive.
3. What are the main segments of the Abrasives Market?
The market segments include Production Analysis, Consumption Analysis, Import Market Analysis (Value & Volume), Export Market Analysis (Value & Volume), Price Trend Analysis.
4. Can you provide details about the market size?
The market size is estimated to be USD 40.99 billion as of 2022.
5. What are some drivers contributing to market growth?
Increasing Use In the Aerospace and Automotive Sector; Growing Metal Manufacturing and Fabrication Industry.
6. What are the notable trends driving market growth?
Increasing Use in the Aerospace and Automotive Sectors.
7. Are there any restraints impacting market growth?
Stringent Regulations on Usage of Abrasives; Other Restraints.
8. Can you provide examples of recent developments in the market?
May 2023: Sak Abrasives Limited announced the acquisition of Jowitt & Rodgers Co., located in Philadelphia, Pennsylvania, United States. The company expanded its product portfolio through this acquisition by including Jowitt & Rodgers Co’s resin-bonded grinding wheels, discs, and segments.
9. What pricing options are available for accessing the report?
Pricing options include single-user, multi-user, and enterprise licenses priced at USD 4750, USD 5250, and USD 8750 respectively.
10. Is the market size provided in terms of value or volume?
The market size is provided in terms of value, measured in billion.
11. Are there any specific market keywords associated with the report?
Yes, the market keyword associated with the report is "Abrasives Market," which aids in identifying and referencing the specific market segment covered.
12. How do I determine which pricing option suits my needs best?
The pricing options vary based on user requirements and access needs. Individual users may opt for single-user licenses, while businesses requiring broader access may choose multi-user or enterprise licenses for cost-effective access to the report.
13. Are there any additional resources or data provided in the Abrasives Market report?
While the report offers comprehensive insights, it's advisable to review the specific contents or supplementary materials provided to ascertain if additional resources or data are available.
14. How can I stay updated on further developments or reports in the Abrasives Market?
To stay informed about further developments, trends, and reports in the Abrasives Market, consider subscribing to industry newsletters, following relevant companies and organizations, or regularly checking reputable industry news sources and publications.
Methodology
Step 1 - Identification of Relevant Samples Size from Population Database


Step 2 - Approaches for Defining Global Market Size (Value, Volume* & Price*)

Note*: In applicable scenarios
Step 3 - Data Sources
Primary Research
- Web Analytics
- Survey Reports
- Research Institute
- Latest Research Reports
- Opinion Leaders
Secondary Research
- Annual Reports
- White Paper
- Latest Press Release
- Industry Association
- Paid Database
- Investor Presentations

Step 4 - Data Triangulation
Involves using different sources of information in order to increase the validity of a study
These sources are likely to be stakeholders in a program - participants, other researchers, program staff, other community members, and so on.
Then we put all data in single framework & apply various statistical tools to find out the dynamic on the market.
During the analysis stage, feedback from the stakeholder groups would be compared to determine areas of agreement as well as areas of divergence