

Key Insights
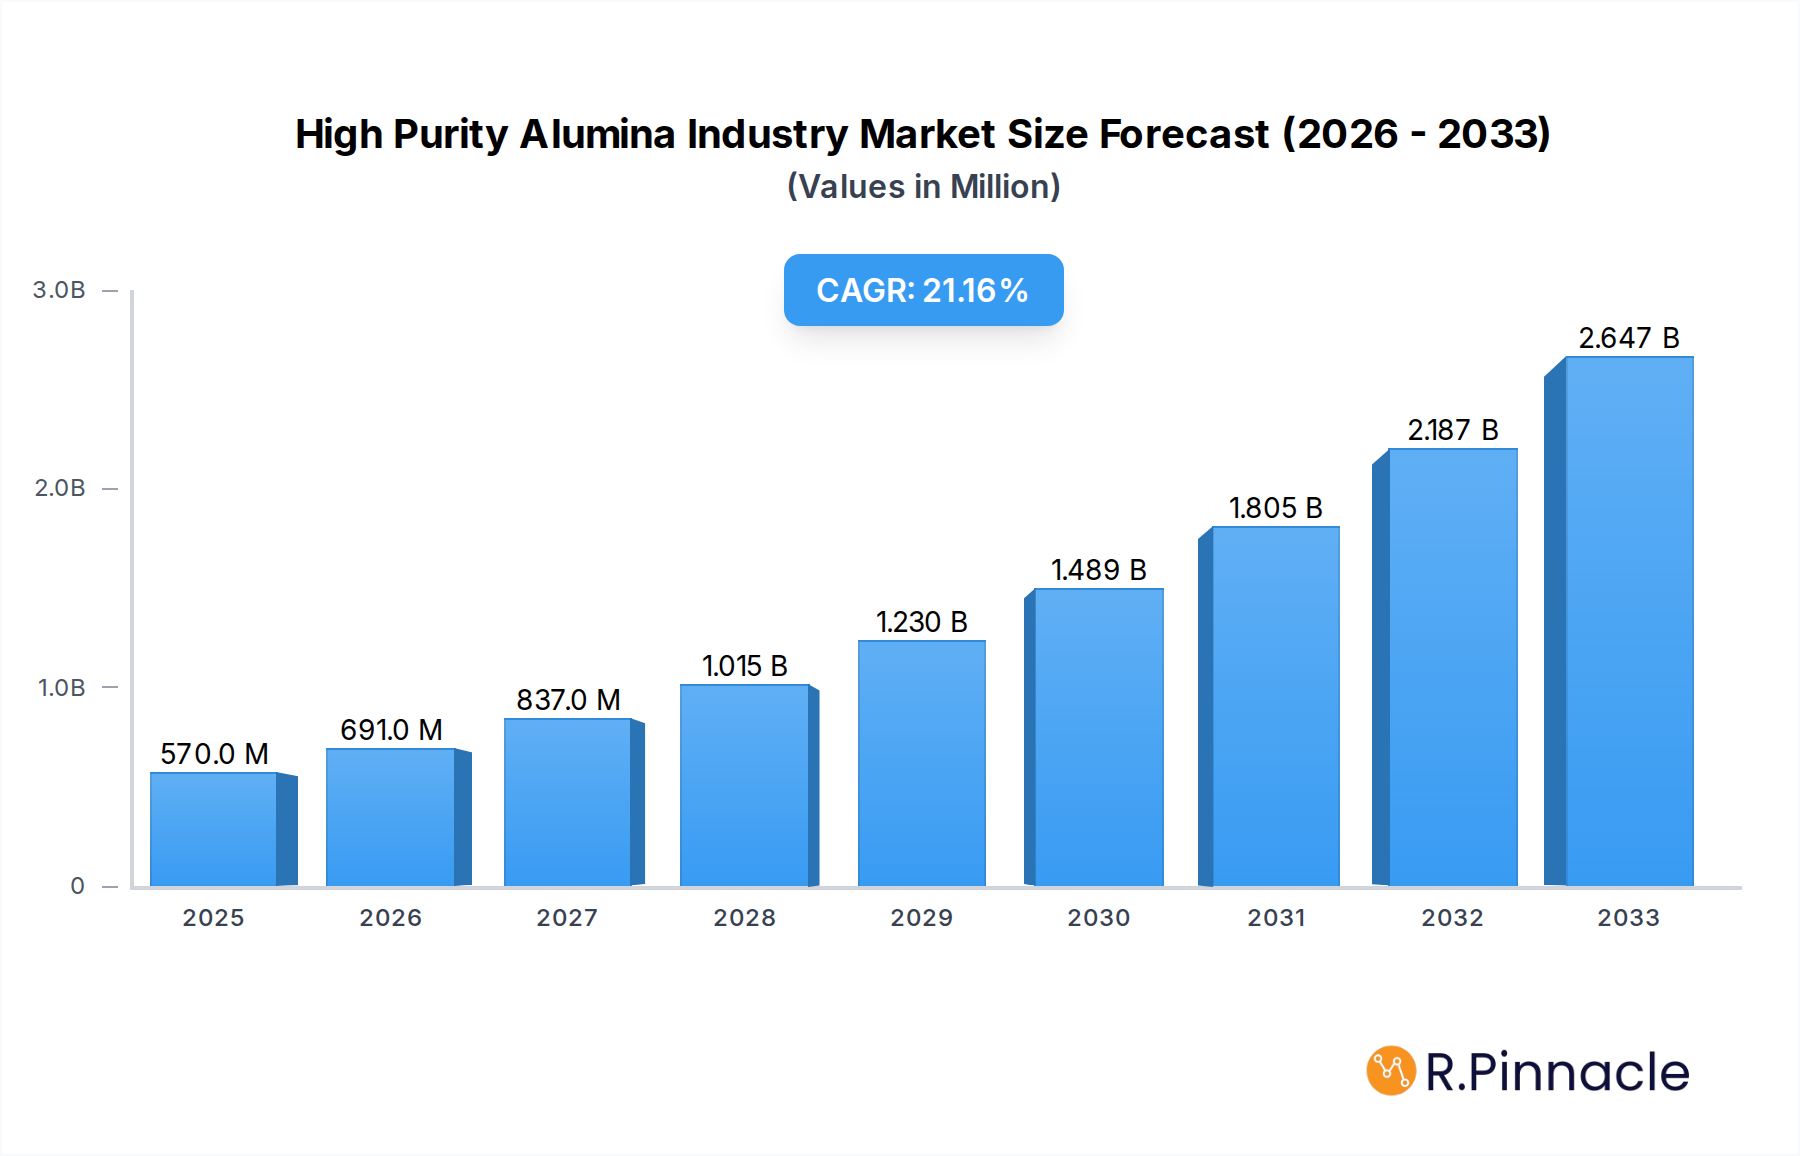
The High Purity Alumina (HPA) market is experiencing robust growth, projected to reach approximately $0.57 billion by 2025, driven by an impressive Compound Annual Growth Rate (CAGR) of 20.62%. This expansion is largely fueled by the escalating demand from critical sectors such as LED lighting, advanced phosphors, semiconductors, and the rapidly growing lithium-ion (Li-ion) battery industry. The intrinsic properties of HPA, including its exceptional purity, thermal stability, and optical clarity, make it indispensable for enhancing the performance and efficiency of these high-tech applications. The increasing global adoption of energy-efficient lighting solutions, the miniaturization of electronic devices, and the surging demand for electric vehicles are creating a significant impetus for HPA market penetration. Furthermore, ongoing advancements in HPA production technologies, particularly innovations in hydrolysis and hydrochloric acid leaching methods, are contributing to improved quality and cost-effectiveness, further stimulating market expansion.

High Purity Alumina Industry Market Size (In Million)
The market landscape is characterized by a dynamic interplay of growth drivers and potential restraints. While technological advancements and increasing application breadth propel the market forward, challenges such as raw material price volatility and stringent environmental regulations could pose limitations. However, the widespread adoption of HPA in next-generation technologies, including advanced ceramics for various industrial applications, is expected to outweigh these restraints. Geographically, the Asia Pacific region, led by China and South Korea, is anticipated to dominate the market due to its strong manufacturing base for electronics and batteries, coupled with significant investments in research and development. Key players like Baikowski, Sumitomo Chemical, and Nippon Light Metal are actively engaged in expanding their production capacities and innovating to meet the evolving demands of this high-growth industry. The continued focus on high-purity materials across multiple industries will solidify HPA's position as a critical component in technological progress.
High Purity Alumina Industry Company Market Share
This in-depth report provides unparalleled insights into the global High Purity Alumina (HPA) industry, meticulously analyzing market dynamics, technological advancements, and future growth trajectories. Covering a study period from 2019 to 2033, with a base and estimated year of 2025 and a forecast period of 2025–2033, this research is essential for stakeholders seeking to navigate the complexities and capitalize on the opportunities within this rapidly evolving sector. Our analysis delves into critical segments including purity levels (4N, 5N, 6N), production technologies (Hydrolysis, Hydrochloric Acid Leaching), and diverse applications such as LED Lighting, Phosphors, Semiconductors, Lithium-ion (Li-Ion) Batteries, Technical Ceramics, and Other Applications. With market valuations projected in billions, this report offers actionable intelligence for investors, manufacturers, and R&D professionals alike.
High Purity Alumina Industry Market Structure & Innovation Trends
The global High Purity Alumina (HPA) market is characterized by a moderate to high concentration, with key players investing significantly in research and development to achieve superior purity levels and cost-effective production methods. Innovation is primarily driven by the escalating demand for advanced materials in high-growth sectors like electronics and renewable energy storage. Regulatory frameworks, particularly concerning environmental sustainability and product safety, are increasingly influencing manufacturing processes and material sourcing. The threat of product substitutes remains low due to the unique properties and performance advantages offered by HPA in demanding applications. End-user demographics are shifting towards technology-intensive industries requiring ultra-high purity materials for enhanced product functionality and longevity. Mergers and acquisitions (M&A) are emerging as strategic tools for market consolidation and access to cutting-edge technologies, with M&A deal values expected to rise as the market matures. Key companies such as Baikowski and Sumitomo Chemical Co Ltd are at the forefront of these market dynamics, leveraging their technological expertise and expanding production capacities to meet growing global demand. The market share of leading entities is influenced by their ability to deliver consistent quality and scale production efficiently.
High Purity Alumina Industry Market Dynamics & Trends
The High Purity Alumina (HPA) market is poised for substantial growth, projected to expand at a Compound Annual Growth Rate (CAGR) exceeding xx% from 2025 to 2033. This robust expansion is fueled by a confluence of powerful market growth drivers, chief among them being the insatiable demand for next-generation electronics, particularly high-efficiency LED lighting and advanced semiconductor components. The burgeoning electric vehicle (EV) sector and the critical need for improved energy storage solutions are further propelling the demand for HPA in lithium-ion (Li-Ion) battery manufacturing, where it serves as a crucial separator coating material to enhance safety and performance. Technological disruptions, including advancements in HPA synthesis and purification techniques, are continuously improving product quality and reducing manufacturing costs, thereby broadening its application spectrum. Consumer preferences are increasingly gravitating towards products with enhanced durability, energy efficiency, and advanced functionalities, all of which are facilitated by the incorporation of HPA. The competitive landscape is dynamic, with established players and emerging innovators vying for market share through product differentiation, strategic partnerships, and vertical integration. Market penetration of HPA in its various applications is steadily increasing as awareness of its benefits grows and production scales up. Companies are actively investing in optimizing Hydrolysis and Hydrochloric Acid Leaching technologies to achieve higher purity levels, such as 5N and 6N, which are essential for cutting-edge applications. The global market size is expected to reach hundreds of billions of dollars by the end of the forecast period, underscoring the significant economic potential of this sector.
Dominant Regions & Segments in High Purity Alumina Industry
The Asia Pacific region stands as the dominant force in the High Purity Alumina (HPA) industry, driven by its robust manufacturing base in electronics, semiconductors, and rapidly growing adoption of electric vehicles. Countries like China, Japan, and South Korea are at the epicenter of this dominance, benefiting from strong government support for high-tech industries, substantial investments in R&D, and a vast domestic market.
Key Drivers of Regional Dominance in Asia Pacific:
- Economic Policies & Government Support: Favorable policies promoting advanced manufacturing and technological innovation, including subsidies and tax incentives, are crucial.
- Infrastructure Development: Extensive industrial infrastructure, including specialized manufacturing facilities and logistics networks, facilitates large-scale HPA production and distribution.
- Technological Hubs: The presence of leading technology companies and research institutions fosters a culture of innovation and rapid adoption of HPA in end-user products.
- Growing Consumer Demand: A large and increasingly affluent population drives demand for consumer electronics, EVs, and other HPA-enabled products.
Analyzing the Application segment, Lithium-ion (Li-Ion) Batteries are emerging as a significant growth driver, projected to exhibit the highest market penetration and CAGR during the forecast period. The exponential growth of the electric vehicle market and the increasing demand for portable electronic devices are directly fueling this trend. High-purity alumina is critical for enhancing the safety, performance, and lifespan of Li-ion batteries by serving as a thermal barrier coating on battery separators, preventing internal short circuits and improving overall stability.
- Lithium-ion (Li-Ion) Batteries: Expected to see the most rapid growth due to EV adoption and portable electronics.
- LED Lighting: Continues to be a major application, driven by energy efficiency mandates and the shift towards solid-state lighting. The demand for higher brightness and longer lifespan in LEDs directly correlates with the purity of alumina used.
- Semiconductor: Essential for the production of advanced microchips and other electronic components, requiring ultra-high purity for optimal performance and to prevent contamination.
- Technical Ceramics: Utilized in high-performance applications requiring extreme hardness, wear resistance, and thermal stability, such as in aerospace and industrial machinery.
- Phosphor: HPA is a key precursor for phosphors used in lighting and display technologies, contributing to color rendering and light output efficiency.
- Other Applications: Includes niche uses in catalysts, abrasives, and advanced coatings.
Within the Type segmentation, 5N and 6N purity levels are witnessing the fastest adoption, driven by the stringent requirements of advanced applications like semiconductors and next-generation batteries. While 4N purity remains significant, the trend is clearly towards higher purity grades to unlock superior performance characteristics. In terms of Technology, both Hydrolysis and Hydrochloric Acid Leaching are crucial. Hydrolysis is often favored for its ability to produce very high purity alumina with controlled particle morphology, while Hydrochloric Acid Leaching can be more cost-effective for certain scales of production. Continuous innovation in both methods is focused on improving efficiency, reducing by-product generation, and achieving even higher purity levels. The global market size for HPA is projected to reach hundreds of billions of dollars, with the Asia Pacific region leading the charge in production and consumption.
High Purity Alumina Industry Product Innovations
Product innovations in the High Purity Alumina (HPA) industry are primarily focused on achieving ultra-high purity levels, such as 5N and 6N, and developing tailored particle morphologies for specific applications. Companies are introducing advanced HPA grades with enhanced thermal stability and dielectric properties, crucial for the next generation of semiconductors and high-performance electronic components. Innovations also include the development of cost-effective production technologies that minimize environmental impact, making HPA more accessible for widespread adoption in applications like lithium-ion batteries and advanced technical ceramics. The competitive advantage lies in a company's ability to consistently deliver high-purity materials with precise particle size distribution and surface chemistry, meeting the stringent specifications demanded by end-users.
Report Scope & Segmentation Analysis
This report provides a comprehensive analysis of the High Purity Alumina (HPA) market, segmenting it across key parameters to offer detailed insights.
Type: The market is segmented into 4N (99.99%), 5N (99.999%), and 6N (99.9999%) purity levels. The demand for 5N and 6N HPA is projected to grow at a significantly higher CAGR due to its critical role in advanced applications like semiconductors and high-end Li-ion batteries. While 4N remains substantial, the trend is towards higher purity grades for improved performance.
Technology: Segmentation includes Hydrolysis and Hydrochloric Acid Leaching. Both technologies are vital, with ongoing innovations aimed at enhancing efficiency, purity, and environmental sustainability. Hydrolysis is often preferred for ultra-high purity applications, while Hydrochloric Acid Leaching offers potential cost advantages.
Application: The market is divided into LED Lighting, Phosphor, Semiconductor, Lithium-ion (Li-Ion) Batteries, Technical Ceramics, and Other Applications. The Lithium-ion (Li-Ion) Batteries segment is expected to exhibit the highest growth rate, driven by the booming electric vehicle market and the increasing demand for advanced energy storage solutions. Semiconductor and LED Lighting applications also represent substantial and growing markets.
Key Drivers of High Purity Alumina Industry Growth
The High Purity Alumina (HPA) industry's growth is propelled by several interconnected factors. Technologically, the relentless demand for higher performance in electronics, particularly in semiconductors and LED lighting, necessitates the use of ultra-high purity materials like HPA to achieve smaller feature sizes, faster speeds, and increased energy efficiency. Economically, the exponential rise of the electric vehicle (EV) market is a monumental growth driver, as HPA is indispensable for the safety and performance of Lithium-ion (Li-Ion) batteries, acting as a critical component in battery separators. Regulatory frameworks, such as stringent energy efficiency standards and environmental regulations, further encourage the adoption of HPA in various applications, including energy-saving lighting solutions. Furthermore, ongoing advancements in HPA production technologies, leading to cost reductions and improved purity, are expanding its accessibility and application potential.
Challenges in the High Purity Alumina Industry Sector
Despite its promising growth, the High Purity Alumina (HPA) industry faces several significant challenges. The production of ultra-high purity alumina is an energy-intensive and complex process, leading to higher manufacturing costs compared to standard alumina. Supply chain disruptions, particularly for critical raw materials and specialized processing chemicals, can impact production volumes and timelines. Stringent quality control requirements and the need for highly specialized equipment add to the operational complexities and capital investment. Furthermore, environmental regulations concerning waste disposal and emissions, while driving innovation, can also increase compliance costs for manufacturers. Intense competitive pressure from established players and new entrants seeking to capture market share necessitates continuous investment in R&D and process optimization, potentially leading to price erosion in certain segments.
Emerging Opportunities in High Purity Alumina Industry
The High Purity Alumina (HPA) industry is ripe with emerging opportunities, driven by technological advancements and evolving market demands. The rapid growth of the electric vehicle (EV) sector presents a significant opportunity for HPA in advanced Lithium-ion (Li-Ion) batteries, particularly for enhancing safety and performance. Innovations in solid-state batteries, which often require HPA-based electrolytes or coatings, represent a future growth avenue. The continued miniaturization and increasing complexity of semiconductor devices offer a consistent demand for ultra-high purity alumina. Emerging applications in advanced technical ceramics for aerospace, medical implants, and high-temperature industrial processes also present substantial growth potential. Furthermore, advancements in green manufacturing technologies for HPA production can open new market segments and attract environmentally conscious customers. The development of new HPA derivatives with tailored properties for niche applications is another promising area.
Leading Players in the High Purity Alumina Industry Market
- Baikowski
- Bestry Performance Materials Co Ltd
- Hebei Pengda New Material Technology Co Ltd
- Honghe Chemical
- Nippon Light Metal Co Ltd
- Polar Sapphire
- Rusal
- Sasol (USA) Corporation
- Shandong Keheng Crystal Material Technology Co Ltd
- Sumitomo Chemical Co Ltd
- Wuxi Tuobada Titanium Dioxide Products Co Ltd
- Xuancheng Jingrui New Materials Co Ltd
(List Not Exhaustive)
Key Developments in High Purity Alumina Industry Industry
- August 2023: Sumitomo Chemical introduced a new technology for the production of ultra-fine α-alumina, which was set to start in September 2023. Alumina materials that are made by calcining aluminum hydroxide at high temperatures have a purity of around 99.99% or more. They are called ultra-high purity alumina. This development is set to enhance the company's portfolio of high-purity materials, catering to the growing demand for advanced applications.
- January 2022: Polar Performance Materials was awarded USD 4.1 million by Sustainable Development Technology Canada (SDTC) for Battery Cleantech. SDTC funding will allow Polar Performance Materials to build a demonstration line for manufacturing high-purity alumina that produces lithium-ion batteries. This award signifies a significant step towards scaling up HPA production for the critical battery market, underscoring the importance of cleantech in the industry.
Future Outlook for High Purity Alumina Industry Market
The future outlook for the High Purity Alumina (HPA) industry is exceptionally bright, driven by the sustained demand from its core application sectors and the emergence of new technological frontiers. The ever-increasing adoption of electric vehicles will continue to be a primary growth accelerator, underpinning the demand for HPA in advanced lithium-ion batteries. Further advancements in semiconductor technology, requiring ever-purer materials for next-generation chips, will ensure consistent market penetration. The development of innovative HPA production processes, focusing on sustainability and cost-efficiency, will unlock new market opportunities and broaden its accessibility. Strategic collaborations and expansions by key players are anticipated to shape the competitive landscape, ensuring a steady supply of high-quality HPA to meet global demands. The industry is poised for significant expansion, reaching market valuations in the hundreds of billions, presenting lucrative strategic opportunities for stakeholders across the value chain.
High Purity Alumina Industry Segmentation
-
1. Type
- 1.1. 4N
- 1.2. 5N
- 1.3. 6N
-
2. Technology
- 2.1. Hydrolysis
- 2.2. Hydrochloric Acid Leaching
-
3. Application
- 3.1. LED Lighting
- 3.2. Phosphor
- 3.3. Semiconductor
- 3.4. Lithium-ion (Li-Ion) Batteries
- 3.5. Technical Ceramics
- 3.6. Other Applications
High Purity Alumina Industry Segmentation By Geography
-
1. Asia Pacific
- 1.1. China
- 1.2. India
- 1.3. Japan
- 1.4. South Korea
- 1.5. Malaysia
- 1.6. Thailand
- 1.7. Indonesia
- 1.8. Vietnam
- 1.9. Rest of Asia Pacific
-
2. North America
- 2.1. United States
- 2.2. Canada
- 2.3. Mexico
-
3. Europe
- 3.1. Germany
- 3.2. United Kingdom
- 3.3. France
- 3.4. Italy
- 3.5. Spain
- 3.6. NORDIC Countries
- 3.7. Turkey
- 3.8. Russia
- 3.9. Rest of Europe
-
4. South America
- 4.1. Brazil
- 4.2. Argentina
- 4.3. Colombia
- 4.4. Rest of South America
-
5. Middle East and Africa
- 5.1. Saudi Arabia
- 5.2. Qatar
- 5.3. United Arab Emirates
- 5.4. Nigeria
- 5.5. Egypt
- 5.6. South Africa
- 5.7. Rest of Middle East and Africa
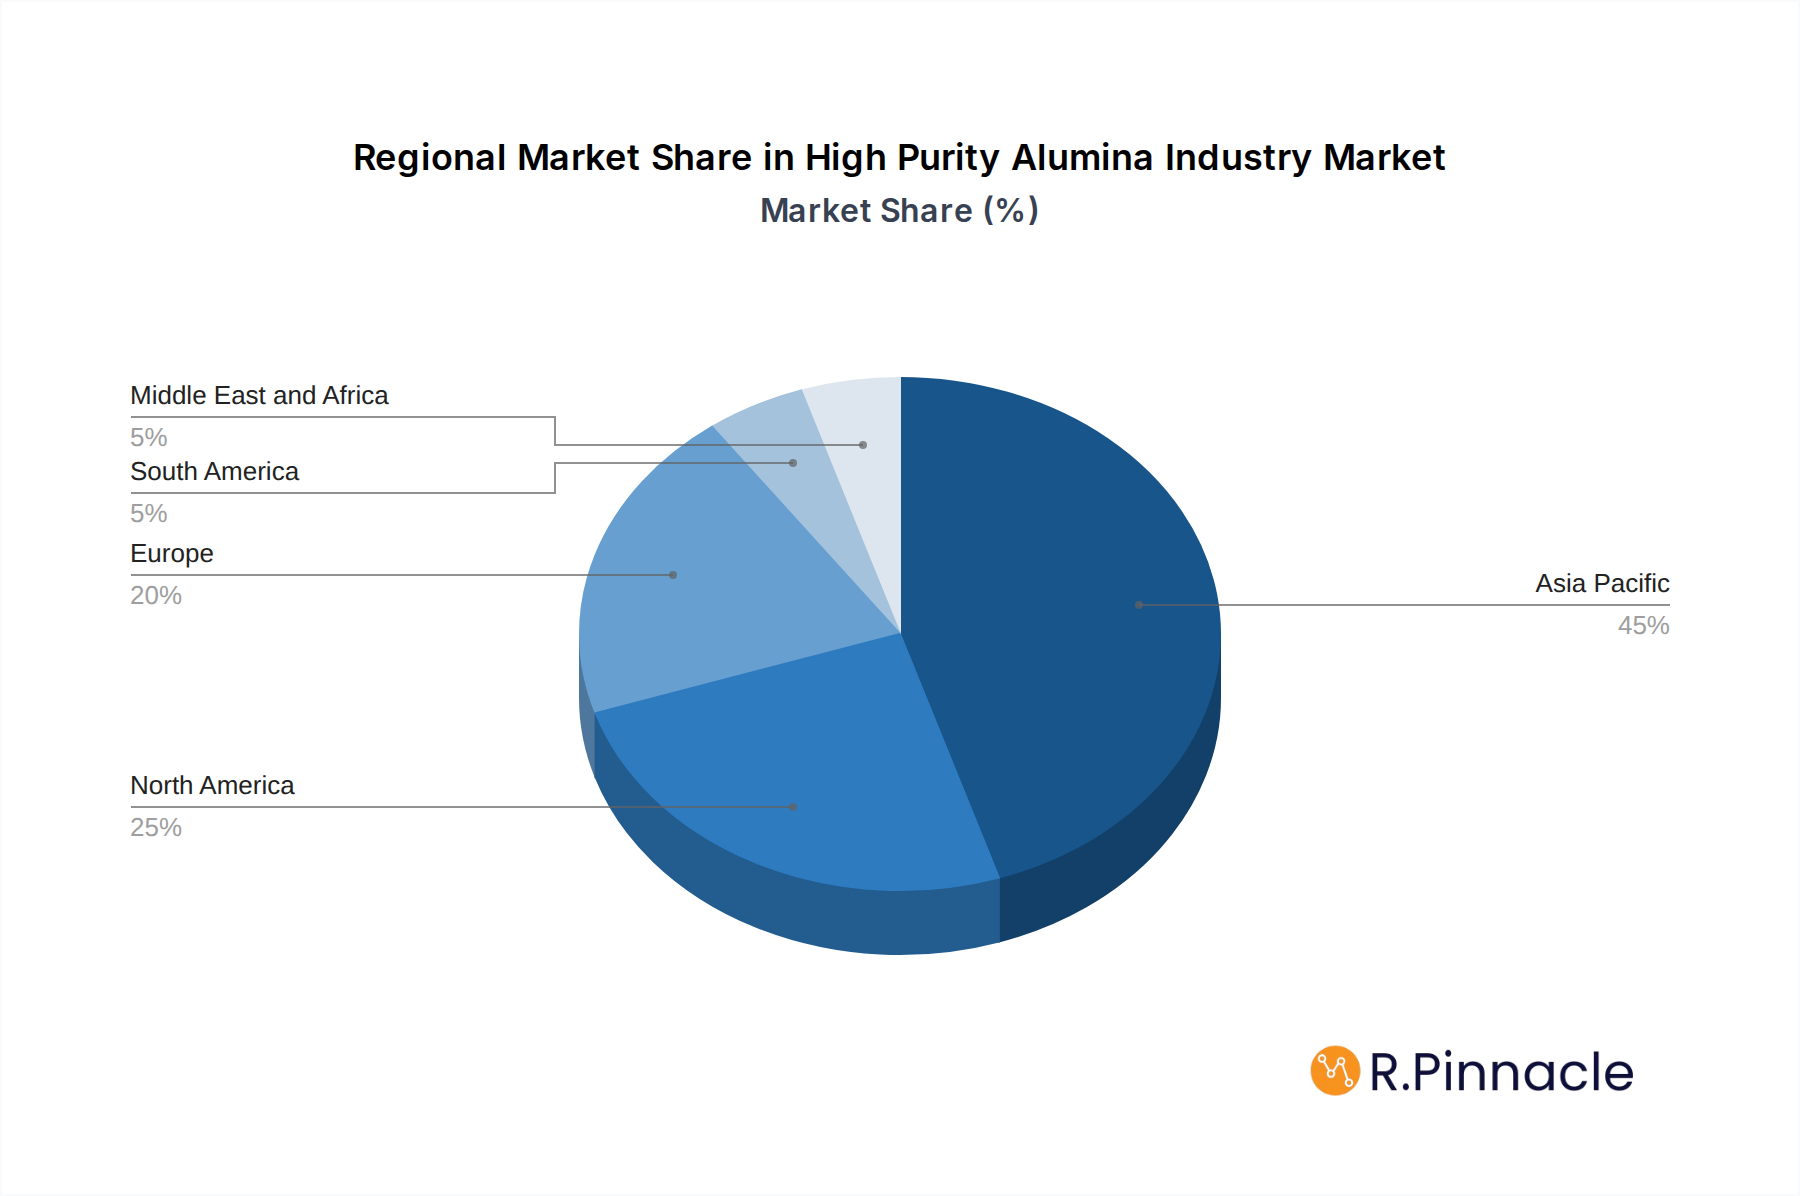
High Purity Alumina Industry Regional Market Share
Geographic Coverage of High Purity Alumina Industry
High Purity Alumina Industry REPORT HIGHLIGHTS
| Aspects | Details |
|---|---|
| Study Period | 2020-2034 |
| Base Year | 2025 |
| Estimated Year | 2026 |
| Forecast Period | 2026-2034 |
| Historical Period | 2020-2025 |
| Growth Rate | CAGR of 20.62% from 2020-2034 |
| Segmentation |
|
Table of Contents
- 1. Introduction
- 1.1. Research Scope
- 1.2. Market Segmentation
- 1.3. Research Objective
- 1.4. Definitions and Assumptions
- 2. Executive Summary
- 2.1. Market Snapshot
- 3. Market Dynamics
- 3.1. Market Drivers
- 3.2. Market Restrains
- 3.3. Market Trends
- 3.4. Market Opportunities
- 4. Market Factor Analysis
- 4.1. Porters Five Forces
- 4.1.1. Bargaining Power of Suppliers
- 4.1.2. Bargaining Power of Buyers
- 4.1.3. Threat of New Entrants
- 4.1.4. Threat of Substitutes
- 4.1.5. Competitive Rivalry
- 4.2. PESTEL analysis
- 4.3. BCG Analysis
- 4.3.1. Stars (High Growth, High Market Share)
- 4.3.2. Cash Cows (Low Growth, High Market Share)
- 4.3.3. Question Mark (High Growth, Low Market Share)
- 4.3.4. Dogs (Low Growth, Low Market Share)
- 4.4. Ansoff Matrix Analysis
- 4.5. Supply Chain Analysis
- 4.6. Regulatory Landscape
- 4.7. Current Market Potential and Opportunity Assessment (TAM–SAM–SOM Framework)
- 4.8. PRI Analyst Note
- 4.1. Porters Five Forces
- 5. Market Analysis, Insights and Forecast 2021-2033
- 5.1. Market Analysis, Insights and Forecast - by Type
- 5.1.1. 4N
- 5.1.2. 5N
- 5.1.3. 6N
- 5.2. Market Analysis, Insights and Forecast - by Technology
- 5.2.1. Hydrolysis
- 5.2.2. Hydrochloric Acid Leaching
- 5.3. Market Analysis, Insights and Forecast - by Application
- 5.3.1. LED Lighting
- 5.3.2. Phosphor
- 5.3.3. Semiconductor
- 5.3.4. Lithium-ion (Li-Ion) Batteries
- 5.3.5. Technical Ceramics
- 5.3.6. Other Applications
- 5.4. Market Analysis, Insights and Forecast - by Region
- 5.4.1. Asia Pacific
- 5.4.2. North America
- 5.4.3. Europe
- 5.4.4. South America
- 5.4.5. Middle East and Africa
- 5.1. Market Analysis, Insights and Forecast - by Type
- 6. Global High Purity Alumina Industry Analysis, Insights and Forecast, 2021-2033
- 6.1. Market Analysis, Insights and Forecast - by Type
- 6.1.1. 4N
- 6.1.2. 5N
- 6.1.3. 6N
- 6.2. Market Analysis, Insights and Forecast - by Technology
- 6.2.1. Hydrolysis
- 6.2.2. Hydrochloric Acid Leaching
- 6.3. Market Analysis, Insights and Forecast - by Application
- 6.3.1. LED Lighting
- 6.3.2. Phosphor
- 6.3.3. Semiconductor
- 6.3.4. Lithium-ion (Li-Ion) Batteries
- 6.3.5. Technical Ceramics
- 6.3.6. Other Applications
- 6.1. Market Analysis, Insights and Forecast - by Type
- 7. Asia Pacific High Purity Alumina Industry Analysis, Insights and Forecast, 2020-2032
- 7.1. Market Analysis, Insights and Forecast - by Type
- 7.1.1. 4N
- 7.1.2. 5N
- 7.1.3. 6N
- 7.2. Market Analysis, Insights and Forecast - by Technology
- 7.2.1. Hydrolysis
- 7.2.2. Hydrochloric Acid Leaching
- 7.3. Market Analysis, Insights and Forecast - by Application
- 7.3.1. LED Lighting
- 7.3.2. Phosphor
- 7.3.3. Semiconductor
- 7.3.4. Lithium-ion (Li-Ion) Batteries
- 7.3.5. Technical Ceramics
- 7.3.6. Other Applications
- 7.1. Market Analysis, Insights and Forecast - by Type
- 8. North America High Purity Alumina Industry Analysis, Insights and Forecast, 2020-2032
- 8.1. Market Analysis, Insights and Forecast - by Type
- 8.1.1. 4N
- 8.1.2. 5N
- 8.1.3. 6N
- 8.2. Market Analysis, Insights and Forecast - by Technology
- 8.2.1. Hydrolysis
- 8.2.2. Hydrochloric Acid Leaching
- 8.3. Market Analysis, Insights and Forecast - by Application
- 8.3.1. LED Lighting
- 8.3.2. Phosphor
- 8.3.3. Semiconductor
- 8.3.4. Lithium-ion (Li-Ion) Batteries
- 8.3.5. Technical Ceramics
- 8.3.6. Other Applications
- 8.1. Market Analysis, Insights and Forecast - by Type
- 9. Europe High Purity Alumina Industry Analysis, Insights and Forecast, 2020-2032
- 9.1. Market Analysis, Insights and Forecast - by Type
- 9.1.1. 4N
- 9.1.2. 5N
- 9.1.3. 6N
- 9.2. Market Analysis, Insights and Forecast - by Technology
- 9.2.1. Hydrolysis
- 9.2.2. Hydrochloric Acid Leaching
- 9.3. Market Analysis, Insights and Forecast - by Application
- 9.3.1. LED Lighting
- 9.3.2. Phosphor
- 9.3.3. Semiconductor
- 9.3.4. Lithium-ion (Li-Ion) Batteries
- 9.3.5. Technical Ceramics
- 9.3.6. Other Applications
- 9.1. Market Analysis, Insights and Forecast - by Type
- 10. South America High Purity Alumina Industry Analysis, Insights and Forecast, 2020-2032
- 10.1. Market Analysis, Insights and Forecast - by Type
- 10.1.1. 4N
- 10.1.2. 5N
- 10.1.3. 6N
- 10.2. Market Analysis, Insights and Forecast - by Technology
- 10.2.1. Hydrolysis
- 10.2.2. Hydrochloric Acid Leaching
- 10.3. Market Analysis, Insights and Forecast - by Application
- 10.3.1. LED Lighting
- 10.3.2. Phosphor
- 10.3.3. Semiconductor
- 10.3.4. Lithium-ion (Li-Ion) Batteries
- 10.3.5. Technical Ceramics
- 10.3.6. Other Applications
- 10.1. Market Analysis, Insights and Forecast - by Type
- 11. Middle East and Africa High Purity Alumina Industry Analysis, Insights and Forecast, 2020-2032
- 11.1. Market Analysis, Insights and Forecast - by Type
- 11.1.1. 4N
- 11.1.2. 5N
- 11.1.3. 6N
- 11.2. Market Analysis, Insights and Forecast - by Technology
- 11.2.1. Hydrolysis
- 11.2.2. Hydrochloric Acid Leaching
- 11.3. Market Analysis, Insights and Forecast - by Application
- 11.3.1. LED Lighting
- 11.3.2. Phosphor
- 11.3.3. Semiconductor
- 11.3.4. Lithium-ion (Li-Ion) Batteries
- 11.3.5. Technical Ceramics
- 11.3.6. Other Applications
- 11.1. Market Analysis, Insights and Forecast - by Type
- 12. Competitive Analysis
- 12.1. Company Profiles
- 12.1.1 Baikowski
- 12.1.1.1. Company Overview
- 12.1.1.2. Products
- 12.1.1.3. Company Financials
- 12.1.1.4. SWOT Analysis
- 12.1.2 Bestry Performance Materials Co Ltd
- 12.1.2.1. Company Overview
- 12.1.2.2. Products
- 12.1.2.3. Company Financials
- 12.1.2.4. SWOT Analysis
- 12.1.3 Hebei Pengda New Material Technology Co Ltd
- 12.1.3.1. Company Overview
- 12.1.3.2. Products
- 12.1.3.3. Company Financials
- 12.1.3.4. SWOT Analysis
- 12.1.4 Honghe Chemical
- 12.1.4.1. Company Overview
- 12.1.4.2. Products
- 12.1.4.3. Company Financials
- 12.1.4.4. SWOT Analysis
- 12.1.5 Nippon Light Metal Co Ltd
- 12.1.5.1. Company Overview
- 12.1.5.2. Products
- 12.1.5.3. Company Financials
- 12.1.5.4. SWOT Analysis
- 12.1.6 Polar Sapphire
- 12.1.6.1. Company Overview
- 12.1.6.2. Products
- 12.1.6.3. Company Financials
- 12.1.6.4. SWOT Analysis
- 12.1.7 Rusal
- 12.1.7.1. Company Overview
- 12.1.7.2. Products
- 12.1.7.3. Company Financials
- 12.1.7.4. SWOT Analysis
- 12.1.8 Sasol (USA) Corporation
- 12.1.8.1. Company Overview
- 12.1.8.2. Products
- 12.1.8.3. Company Financials
- 12.1.8.4. SWOT Analysis
- 12.1.9 Shandong Keheng Crystal Material Technology Co Ltd
- 12.1.9.1. Company Overview
- 12.1.9.2. Products
- 12.1.9.3. Company Financials
- 12.1.9.4. SWOT Analysis
- 12.1.10 Sumitomo Chemical Co Ltd
- 12.1.10.1. Company Overview
- 12.1.10.2. Products
- 12.1.10.3. Company Financials
- 12.1.10.4. SWOT Analysis
- 12.1.11 Wuxi Tuobada Titanium Dioxide Products Co Ltd
- 12.1.11.1. Company Overview
- 12.1.11.2. Products
- 12.1.11.3. Company Financials
- 12.1.11.4. SWOT Analysis
- 12.1.12 Xuancheng Jingrui New Materials Co Ltd*List Not Exhaustive
- 12.1.12.1. Company Overview
- 12.1.12.2. Products
- 12.1.12.3. Company Financials
- 12.1.12.4. SWOT Analysis
- 12.1.1 Baikowski
- 12.2. Market Entropy
- 12.2.1 Company's Key Areas Served
- 12.2.2 Recent Developments
- 12.3. Company Market Share Analysis 2025
- 12.3.1 Top 5 Companies Market Share Analysis
- 12.3.2 Top 3 Companies Market Share Analysis
- 12.4. List of Potential Customers
- 13. Research Methodology
List of Figures
- Figure 1: Global High Purity Alumina Industry Revenue Breakdown (billion, %) by Region 2025 & 2033
- Figure 2: Asia Pacific High Purity Alumina Industry Revenue (billion), by Type 2025 & 2033
- Figure 3: Asia Pacific High Purity Alumina Industry Revenue Share (%), by Type 2025 & 2033
- Figure 4: Asia Pacific High Purity Alumina Industry Revenue (billion), by Technology 2025 & 2033
- Figure 5: Asia Pacific High Purity Alumina Industry Revenue Share (%), by Technology 2025 & 2033
- Figure 6: Asia Pacific High Purity Alumina Industry Revenue (billion), by Application 2025 & 2033
- Figure 7: Asia Pacific High Purity Alumina Industry Revenue Share (%), by Application 2025 & 2033
- Figure 8: Asia Pacific High Purity Alumina Industry Revenue (billion), by Country 2025 & 2033
- Figure 9: Asia Pacific High Purity Alumina Industry Revenue Share (%), by Country 2025 & 2033
- Figure 10: North America High Purity Alumina Industry Revenue (billion), by Type 2025 & 2033
- Figure 11: North America High Purity Alumina Industry Revenue Share (%), by Type 2025 & 2033
- Figure 12: North America High Purity Alumina Industry Revenue (billion), by Technology 2025 & 2033
- Figure 13: North America High Purity Alumina Industry Revenue Share (%), by Technology 2025 & 2033
- Figure 14: North America High Purity Alumina Industry Revenue (billion), by Application 2025 & 2033
- Figure 15: North America High Purity Alumina Industry Revenue Share (%), by Application 2025 & 2033
- Figure 16: North America High Purity Alumina Industry Revenue (billion), by Country 2025 & 2033
- Figure 17: North America High Purity Alumina Industry Revenue Share (%), by Country 2025 & 2033
- Figure 18: Europe High Purity Alumina Industry Revenue (billion), by Type 2025 & 2033
- Figure 19: Europe High Purity Alumina Industry Revenue Share (%), by Type 2025 & 2033
- Figure 20: Europe High Purity Alumina Industry Revenue (billion), by Technology 2025 & 2033
- Figure 21: Europe High Purity Alumina Industry Revenue Share (%), by Technology 2025 & 2033
- Figure 22: Europe High Purity Alumina Industry Revenue (billion), by Application 2025 & 2033
- Figure 23: Europe High Purity Alumina Industry Revenue Share (%), by Application 2025 & 2033
- Figure 24: Europe High Purity Alumina Industry Revenue (billion), by Country 2025 & 2033
- Figure 25: Europe High Purity Alumina Industry Revenue Share (%), by Country 2025 & 2033
- Figure 26: South America High Purity Alumina Industry Revenue (billion), by Type 2025 & 2033
- Figure 27: South America High Purity Alumina Industry Revenue Share (%), by Type 2025 & 2033
- Figure 28: South America High Purity Alumina Industry Revenue (billion), by Technology 2025 & 2033
- Figure 29: South America High Purity Alumina Industry Revenue Share (%), by Technology 2025 & 2033
- Figure 30: South America High Purity Alumina Industry Revenue (billion), by Application 2025 & 2033
- Figure 31: South America High Purity Alumina Industry Revenue Share (%), by Application 2025 & 2033
- Figure 32: South America High Purity Alumina Industry Revenue (billion), by Country 2025 & 2033
- Figure 33: South America High Purity Alumina Industry Revenue Share (%), by Country 2025 & 2033
- Figure 34: Middle East and Africa High Purity Alumina Industry Revenue (billion), by Type 2025 & 2033
- Figure 35: Middle East and Africa High Purity Alumina Industry Revenue Share (%), by Type 2025 & 2033
- Figure 36: Middle East and Africa High Purity Alumina Industry Revenue (billion), by Technology 2025 & 2033
- Figure 37: Middle East and Africa High Purity Alumina Industry Revenue Share (%), by Technology 2025 & 2033
- Figure 38: Middle East and Africa High Purity Alumina Industry Revenue (billion), by Application 2025 & 2033
- Figure 39: Middle East and Africa High Purity Alumina Industry Revenue Share (%), by Application 2025 & 2033
- Figure 40: Middle East and Africa High Purity Alumina Industry Revenue (billion), by Country 2025 & 2033
- Figure 41: Middle East and Africa High Purity Alumina Industry Revenue Share (%), by Country 2025 & 2033
List of Tables
- Table 1: Global High Purity Alumina Industry Revenue billion Forecast, by Type 2020 & 2033
- Table 2: Global High Purity Alumina Industry Revenue billion Forecast, by Technology 2020 & 2033
- Table 3: Global High Purity Alumina Industry Revenue billion Forecast, by Application 2020 & 2033
- Table 4: Global High Purity Alumina Industry Revenue billion Forecast, by Region 2020 & 2033
- Table 5: Global High Purity Alumina Industry Revenue billion Forecast, by Type 2020 & 2033
- Table 6: Global High Purity Alumina Industry Revenue billion Forecast, by Technology 2020 & 2033
- Table 7: Global High Purity Alumina Industry Revenue billion Forecast, by Application 2020 & 2033
- Table 8: Global High Purity Alumina Industry Revenue billion Forecast, by Country 2020 & 2033
- Table 9: China High Purity Alumina Industry Revenue (billion) Forecast, by Application 2020 & 2033
- Table 10: India High Purity Alumina Industry Revenue (billion) Forecast, by Application 2020 & 2033
- Table 11: Japan High Purity Alumina Industry Revenue (billion) Forecast, by Application 2020 & 2033
- Table 12: South Korea High Purity Alumina Industry Revenue (billion) Forecast, by Application 2020 & 2033
- Table 13: Malaysia High Purity Alumina Industry Revenue (billion) Forecast, by Application 2020 & 2033
- Table 14: Thailand High Purity Alumina Industry Revenue (billion) Forecast, by Application 2020 & 2033
- Table 15: Indonesia High Purity Alumina Industry Revenue (billion) Forecast, by Application 2020 & 2033
- Table 16: Vietnam High Purity Alumina Industry Revenue (billion) Forecast, by Application 2020 & 2033
- Table 17: Rest of Asia Pacific High Purity Alumina Industry Revenue (billion) Forecast, by Application 2020 & 2033
- Table 18: Global High Purity Alumina Industry Revenue billion Forecast, by Type 2020 & 2033
- Table 19: Global High Purity Alumina Industry Revenue billion Forecast, by Technology 2020 & 2033
- Table 20: Global High Purity Alumina Industry Revenue billion Forecast, by Application 2020 & 2033
- Table 21: Global High Purity Alumina Industry Revenue billion Forecast, by Country 2020 & 2033
- Table 22: United States High Purity Alumina Industry Revenue (billion) Forecast, by Application 2020 & 2033
- Table 23: Canada High Purity Alumina Industry Revenue (billion) Forecast, by Application 2020 & 2033
- Table 24: Mexico High Purity Alumina Industry Revenue (billion) Forecast, by Application 2020 & 2033
- Table 25: Global High Purity Alumina Industry Revenue billion Forecast, by Type 2020 & 2033
- Table 26: Global High Purity Alumina Industry Revenue billion Forecast, by Technology 2020 & 2033
- Table 27: Global High Purity Alumina Industry Revenue billion Forecast, by Application 2020 & 2033
- Table 28: Global High Purity Alumina Industry Revenue billion Forecast, by Country 2020 & 2033
- Table 29: Germany High Purity Alumina Industry Revenue (billion) Forecast, by Application 2020 & 2033
- Table 30: United Kingdom High Purity Alumina Industry Revenue (billion) Forecast, by Application 2020 & 2033
- Table 31: France High Purity Alumina Industry Revenue (billion) Forecast, by Application 2020 & 2033
- Table 32: Italy High Purity Alumina Industry Revenue (billion) Forecast, by Application 2020 & 2033
- Table 33: Spain High Purity Alumina Industry Revenue (billion) Forecast, by Application 2020 & 2033
- Table 34: NORDIC Countries High Purity Alumina Industry Revenue (billion) Forecast, by Application 2020 & 2033
- Table 35: Turkey High Purity Alumina Industry Revenue (billion) Forecast, by Application 2020 & 2033
- Table 36: Russia High Purity Alumina Industry Revenue (billion) Forecast, by Application 2020 & 2033
- Table 37: Rest of Europe High Purity Alumina Industry Revenue (billion) Forecast, by Application 2020 & 2033
- Table 38: Global High Purity Alumina Industry Revenue billion Forecast, by Type 2020 & 2033
- Table 39: Global High Purity Alumina Industry Revenue billion Forecast, by Technology 2020 & 2033
- Table 40: Global High Purity Alumina Industry Revenue billion Forecast, by Application 2020 & 2033
- Table 41: Global High Purity Alumina Industry Revenue billion Forecast, by Country 2020 & 2033
- Table 42: Brazil High Purity Alumina Industry Revenue (billion) Forecast, by Application 2020 & 2033
- Table 43: Argentina High Purity Alumina Industry Revenue (billion) Forecast, by Application 2020 & 2033
- Table 44: Colombia High Purity Alumina Industry Revenue (billion) Forecast, by Application 2020 & 2033
- Table 45: Rest of South America High Purity Alumina Industry Revenue (billion) Forecast, by Application 2020 & 2033
- Table 46: Global High Purity Alumina Industry Revenue billion Forecast, by Type 2020 & 2033
- Table 47: Global High Purity Alumina Industry Revenue billion Forecast, by Technology 2020 & 2033
- Table 48: Global High Purity Alumina Industry Revenue billion Forecast, by Application 2020 & 2033
- Table 49: Global High Purity Alumina Industry Revenue billion Forecast, by Country 2020 & 2033
- Table 50: Saudi Arabia High Purity Alumina Industry Revenue (billion) Forecast, by Application 2020 & 2033
- Table 51: Qatar High Purity Alumina Industry Revenue (billion) Forecast, by Application 2020 & 2033
- Table 52: United Arab Emirates High Purity Alumina Industry Revenue (billion) Forecast, by Application 2020 & 2033
- Table 53: Nigeria High Purity Alumina Industry Revenue (billion) Forecast, by Application 2020 & 2033
- Table 54: Egypt High Purity Alumina Industry Revenue (billion) Forecast, by Application 2020 & 2033
- Table 55: South Africa High Purity Alumina Industry Revenue (billion) Forecast, by Application 2020 & 2033
- Table 56: Rest of Middle East and Africa High Purity Alumina Industry Revenue (billion) Forecast, by Application 2020 & 2033
Frequently Asked Questions
1. What is the projected Compound Annual Growth Rate (CAGR) of the High Purity Alumina Industry?
The projected CAGR is approximately 20.62%.
2. Which companies are prominent players in the High Purity Alumina Industry?
Key companies in the market include Baikowski, Bestry Performance Materials Co Ltd, Hebei Pengda New Material Technology Co Ltd, Honghe Chemical, Nippon Light Metal Co Ltd, Polar Sapphire, Rusal, Sasol (USA) Corporation, Shandong Keheng Crystal Material Technology Co Ltd, Sumitomo Chemical Co Ltd, Wuxi Tuobada Titanium Dioxide Products Co Ltd, Xuancheng Jingrui New Materials Co Ltd*List Not Exhaustive.
3. What are the main segments of the High Purity Alumina Industry?
The market segments include Type, Technology, Application.
4. Can you provide details about the market size?
The market size is estimated to be USD 0.57 billion as of 2022.
5. What are some drivers contributing to market growth?
Increasing Demand for LED-based Lighting; Demand from Lithium-ion Battery Markets.
6. What are the notable trends driving market growth?
The LED Lighting Segment is Expected to Dominate the Market.
7. Are there any restraints impacting market growth?
Increasing Demand for LED-based Lighting; Demand from Lithium-ion Battery Markets.
8. Can you provide examples of recent developments in the market?
August 2023: Sumitomo Chemical introduced a new technology for the production of ultra-fine α-alumina, which was set to start in September 2023. Alumina materials that are made by calcining aluminum hydroxide at high temperatures have a purity of around 99.99% or more. They are called ultra-high purity alumina.
9. What pricing options are available for accessing the report?
Pricing options include single-user, multi-user, and enterprise licenses priced at USD 4750, USD 5250, and USD 8750 respectively.
10. Is the market size provided in terms of value or volume?
The market size is provided in terms of value, measured in billion.
11. Are there any specific market keywords associated with the report?
Yes, the market keyword associated with the report is "High Purity Alumina Industry," which aids in identifying and referencing the specific market segment covered.
12. How do I determine which pricing option suits my needs best?
The pricing options vary based on user requirements and access needs. Individual users may opt for single-user licenses, while businesses requiring broader access may choose multi-user or enterprise licenses for cost-effective access to the report.
13. Are there any additional resources or data provided in the High Purity Alumina Industry report?
While the report offers comprehensive insights, it's advisable to review the specific contents or supplementary materials provided to ascertain if additional resources or data are available.
14. How can I stay updated on further developments or reports in the High Purity Alumina Industry?
To stay informed about further developments, trends, and reports in the High Purity Alumina Industry, consider subscribing to industry newsletters, following relevant companies and organizations, or regularly checking reputable industry news sources and publications.
Methodology
Step 1 - Identification of Relevant Samples Size from Population Database


Step 2 - Approaches for Defining Global Market Size (Value, Volume* & Price*)

Note*: In applicable scenarios
Step 3 - Data Sources
Primary Research
- Web Analytics
- Survey Reports
- Research Institute
- Latest Research Reports
- Opinion Leaders
Secondary Research
- Annual Reports
- White Paper
- Latest Press Release
- Industry Association
- Paid Database
- Investor Presentations

Step 4 - Data Triangulation
Involves using different sources of information in order to increase the validity of a study
These sources are likely to be stakeholders in a program - participants, other researchers, program staff, other community members, and so on.
Then we put all data in single framework & apply various statistical tools to find out the dynamic on the market.
During the analysis stage, feedback from the stakeholder groups would be compared to determine areas of agreement as well as areas of divergence