

Key Insights
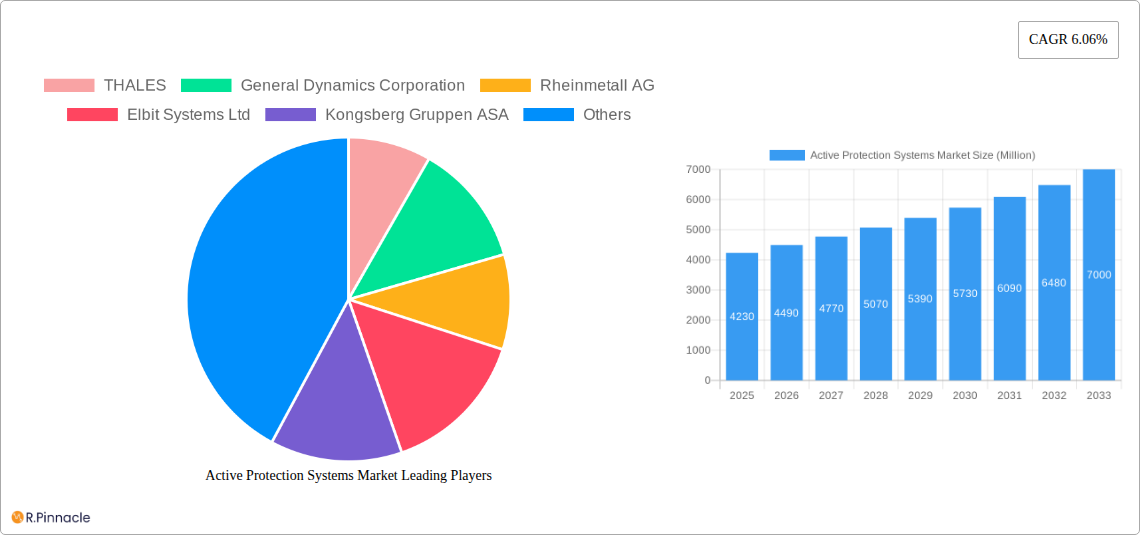
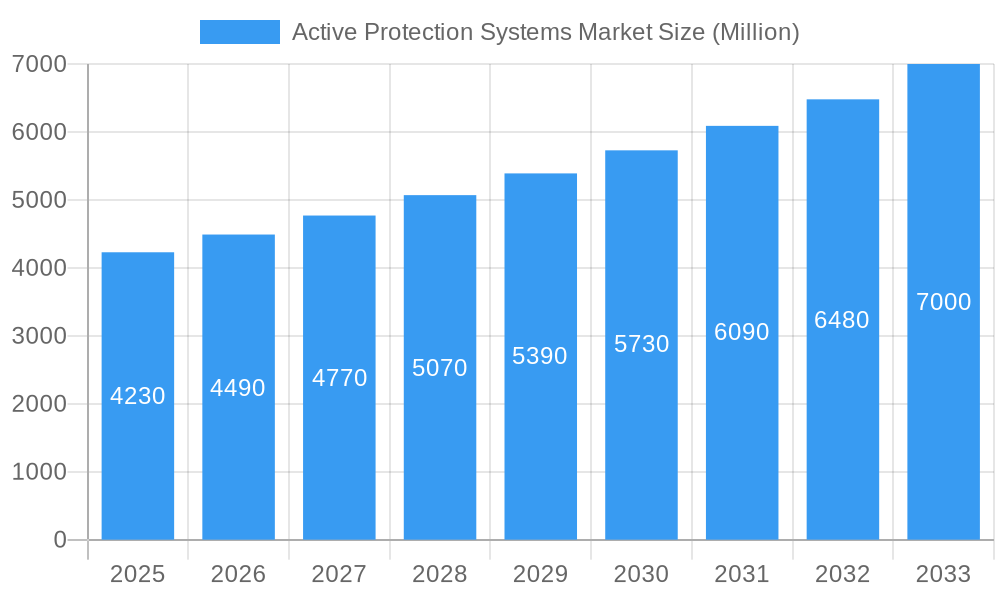
The Active Protection Systems (APS) market, valued at $4.23 billion in 2025, is projected to experience robust growth, driven by escalating geopolitical tensions and the increasing need for enhanced military vehicle protection. A Compound Annual Growth Rate (CAGR) of 6.06% from 2025 to 2033 indicates a significant expansion, reaching an estimated $7.0 billion by 2033. This growth is fueled by several key factors. Firstly, the rising adoption of hard-kill systems, which actively neutralize incoming threats, is a major market driver. Secondly, advancements in soft-kill systems, employing countermeasures like jamming and smoke screens, are also contributing significantly. Finally, the increasing integration of APS across various platforms, including terrestrial, naval, and potentially aerial applications, further broadens market potential. Technological innovations focusing on improved sensor accuracy, faster reaction times, and lighter weight systems are shaping the competitive landscape. The market faces some restraints, including high initial investment costs and the ongoing development of advanced anti-APS technologies. However, the strategic importance of protecting military assets is expected to outweigh these challenges, ensuring continued market expansion.
Active Protection Systems Market Market Size (In Billion)
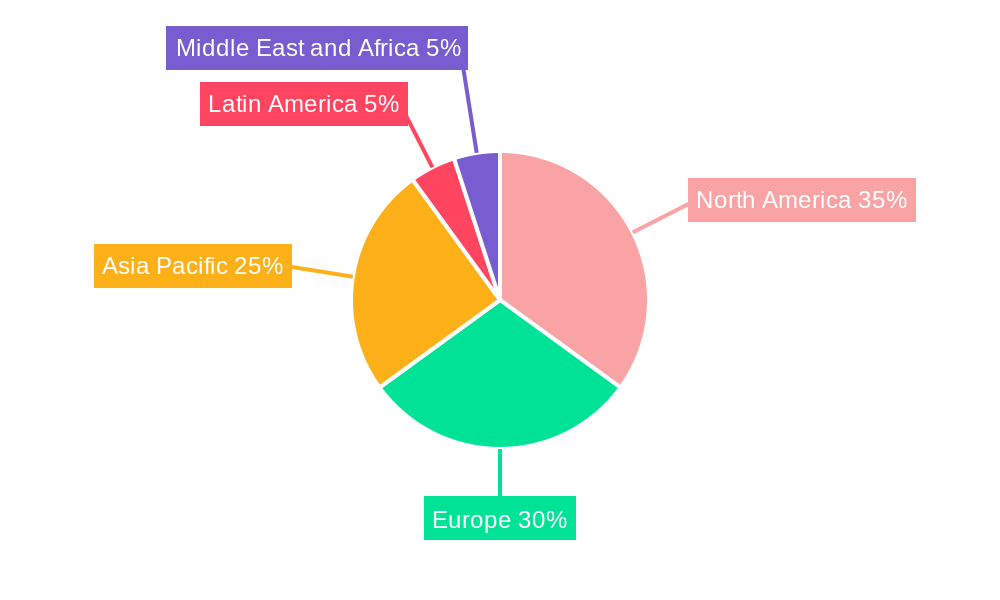
Regional analysis reveals a strong presence of North America and Europe, with these regions likely holding the largest market share, fueled by substantial defense budgets and technological advancements. The Asia-Pacific region is expected to show significant growth, driven by increasing defense modernization efforts in countries like China and India. The competitive landscape is characterized by a mix of established defense contractors, such as Thales, General Dynamics, and Rheinmetall, alongside emerging players focused on technological innovation. Future market trends suggest a growing emphasis on networked APS, AI-driven threat detection, and the integration of APS with broader battlefield management systems. These advancements will contribute to the long-term growth trajectory of the APS market, further solidifying its importance in modern warfare and national security strategies.
Active Protection Systems Market Company Market Share
Active Protection Systems Market: A Comprehensive Report (2019-2033)
This in-depth report provides a comprehensive analysis of the Active Protection Systems market, offering invaluable insights for industry professionals, investors, and strategic decision-makers. With a detailed study period spanning from 2019 to 2033 (Base Year: 2025, Estimated Year: 2025, Forecast Period: 2025-2033, Historical Period: 2019-2024), this report unravels the market's structure, dynamics, and future trajectory. The market is projected to reach xx Million by 2033, exhibiting a CAGR of xx% during the forecast period.
Active Protection Systems Market Market Structure & Innovation Trends
The Active Protection Systems market exhibits a moderately concentrated structure, with key players like THALES, General Dynamics Corporation, Rheinmetall AG, Elbit Systems Ltd, Kongsberg Gruppen ASA, Rostec State Corporation, Rafael Advanced Defense Systems Ltd, RTX Corporation, Artis, Leonardo S.p.A, BAE Systems plc, Saab AB, and ASELSAN A.Ş. holding significant market share. The combined market share of the top five players is estimated at xx%. Innovation is driven by advancements in sensor technology, AI-powered threat detection, and the development of more effective countermeasures. Stringent regulatory frameworks governing the export and use of defense technologies significantly influence market dynamics. The market also witnesses continuous M&A activity, with several deals exceeding xx Million in value over the past five years. These activities often involve smaller companies being acquired by larger players to expand their product portfolios and geographic reach. Product substitutes are limited, primarily relying on passive armor solutions, which are less effective than active protection systems. The end-user demographics primarily consist of military and defense forces globally.
- Market Concentration: Moderately concentrated, with top 5 players holding xx% market share.
- Innovation Drivers: Sensor technology advancements, AI, improved countermeasures.
- Regulatory Framework: Stringent export controls and usage regulations.
- M&A Activity: Several deals exceeding xx Million in value within the last 5 years.
- Product Substitutes: Primarily passive armor solutions.
- End-User Demographics: Military and defense forces worldwide.
Active Protection Systems Market Market Dynamics & Trends
The Active Protection Systems market is experiencing robust growth, propelled by escalating geopolitical instability, rising defense budgets globally, and the increasing demand for enhanced vehicle protection. Technological disruptions, such as the integration of AI and machine learning for improved threat identification and response, are revolutionizing the sector. Consumer preferences are shifting towards more sophisticated and adaptable systems capable of neutralizing multiple threats simultaneously. The competitive landscape is characterized by intense rivalry among established players, each striving to differentiate their offerings through technological advancements and strategic partnerships. This intense competition has led to continuous product innovation and price optimization. The market penetration of Active Protection Systems is expected to increase significantly in the coming years due to the rising adoption rate in armored vehicles. The global market size is expected to reach xx Million in 2025 and xx Million by 2033.
Dominant Regions & Segments in Active Protection Systems Market
The North American region currently dominates the Active Protection Systems market, driven by substantial defense expenditure and technological advancements. Within this region, the United States holds the largest market share. Key drivers contributing to this dominance include robust economic growth, advanced technological infrastructure, and the presence of major market players.
- Leading Region: North America (specifically the United States).
- Dominant Type Segment: Hard-Kill Systems (due to their superior effectiveness in neutralizing incoming threats).
- Dominant Platform Segment: Terrestrial (due to the larger number of terrestrial vehicles requiring protection).
Key Drivers for North American Dominance:
- High defense budgets.
- Strong technological infrastructure.
- Presence of major industry players.
- Robust economic growth.
The European and Asia-Pacific regions are also demonstrating significant growth potential, fuelled by increasing defense modernization efforts and the adoption of technologically advanced active protection systems.
Active Protection Systems Market Product Innovations
Recent product developments focus on miniaturization, improved accuracy, and enhanced countermeasure effectiveness. The integration of AI and machine learning allows for faster threat detection and response times, while modular designs enhance adaptability across different platforms. This evolution toward lighter, more adaptable, and highly efficient systems addresses the key market need for enhanced vehicle protection across diverse operational environments. Technological trends emphasize the seamless integration of various systems for improved situational awareness and a comprehensive defense capability.
Report Scope & Segmentation Analysis
This report segments the Active Protection Systems market based on Type (Hard-Kill Systems, Soft-Kill Systems) and Platform (Terrestrial, Naval).
Type:
- Hard-Kill Systems: This segment is expected to witness robust growth due to its effectiveness in neutralizing incoming threats. The market size is projected to reach xx Million by 2033.
- Soft-Kill Systems: This segment offers a less destructive approach and shows promising growth potential with applications requiring less lethal defense strategies. The market size is projected to reach xx Million by 2033.
Platform:
- Terrestrial: This segment holds the largest market share due to the vast number of ground vehicles needing protection. The market size is projected to reach xx Million by 2033.
- Naval: This segment is expected to experience significant growth driven by increasing naval modernization efforts. The market size is projected to reach xx Million by 2033.
Key Drivers of Active Protection Systems Market Growth
The growth of the Active Protection Systems market is primarily driven by several key factors: increasing defense budgets worldwide, escalating geopolitical tensions demanding enhanced protection, advancements in sensor and countermeasure technologies, and the rising demand for improved survivability of military vehicles. Furthermore, technological innovations leading to more effective, reliable, and affordable systems are pushing market expansion.
Challenges in the Active Protection Systems Market Sector
Key challenges include the high cost of development and implementation, potential for unintended consequences or collateral damage, stringent regulatory hurdles for export and use, and supply chain disruptions affecting component availability and production timelines. These factors can collectively impact market growth and adoption rates, particularly in emerging economies with limited resources.
Emerging Opportunities in Active Protection Systems Market
Emerging opportunities include the integration of active protection systems into unmanned ground vehicles (UGVs) and unmanned aerial vehicles (UAVs), expansion into civilian applications like armored personnel carriers used in law enforcement or humanitarian aid, and development of systems capable of countering increasingly sophisticated threats, such as directed energy weapons. The market presents a significant opportunity for companies that can innovate to meet these evolving needs.
Leading Players in the Active Protection Systems Market Market
- THALES
- General Dynamics Corporation
- Rheinmetall AG
- Elbit Systems Ltd
- Kongsberg Gruppen ASA
- Rostec State Corporation
- Rafael Advanced Defense Systems Ltd
- RTX Corporation
- Artis
- Leonardo S.p.A
- BAE Systems plc
- Saab AB
- ASELSAN A.Ş
Key Developments in Active Protection Systems Market Industry
- October 2023: Rheinmetall announced a significant contract for the supply of active protection systems to an undisclosed customer.
- July 2023: Thales unveiled a new generation of its active protection system, boasting improved performance and reduced weight.
- April 2023: Elbit Systems secured a contract to integrate its active protection system onto a new type of armored vehicle. (Note: Further specific developments need to be added here for the final report)
Future Outlook for Active Protection Systems Market Market
The future of the Active Protection Systems market appears exceptionally promising, driven by continuous technological advancements, sustained global defense spending, and the growing demand for enhanced vehicle protection across diverse platforms. Strategic opportunities exist for companies focusing on the development of more efficient, cost-effective, and adaptable systems, catering to the evolving needs of military and potentially civilian applications. The market is poised for significant growth, presenting substantial returns for early adopters and innovative players.
Active Protection Systems Market Segmentation
- 1. Production Analysis
- 2. Consumption Analysis
- 3. Import Market Analysis (Value & Volume)
- 4. Export Market Analysis (Value & Volume)
- 5. Price Trend Analysis
Active Protection Systems Market Segmentation By Geography
-
1. North America
- 1.1. United States
- 1.2. Canada
- 1.3. Mexico
-
2. South America
- 2.1. Brazil
- 2.2. Argentina
- 2.3. Rest of South America
-
3. Europe
- 3.1. United Kingdom
- 3.2. Germany
- 3.3. France
- 3.4. Italy
- 3.5. Spain
- 3.6. Russia
- 3.7. Benelux
- 3.8. Nordics
- 3.9. Rest of Europe
-
4. Middle East & Africa
- 4.1. Turkey
- 4.2. Israel
- 4.3. GCC
- 4.4. North Africa
- 4.5. South Africa
- 4.6. Rest of Middle East & Africa
-
5. Asia Pacific
- 5.1. China
- 5.2. India
- 5.3. Japan
- 5.4. South Korea
- 5.5. ASEAN
- 5.6. Oceania
- 5.7. Rest of Asia Pacific
Active Protection Systems Market Regional Market Share
Geographic Coverage of Active Protection Systems Market
Active Protection Systems Market REPORT HIGHLIGHTS
| Aspects | Details |
|---|---|
| Study Period | 2020-2034 |
| Base Year | 2025 |
| Estimated Year | 2026 |
| Forecast Period | 2026-2034 |
| Historical Period | 2020-2025 |
| Growth Rate | CAGR of 6.06% from 2020-2034 |
| Segmentation |
|
Table of Contents
- 1. Introduction
- 1.1. Research Scope
- 1.2. Market Segmentation
- 1.3. Research Objective
- 1.4. Definitions and Assumptions
- 2. Executive Summary
- 2.1. Market Snapshot
- 3. Market Dynamics
- 3.1. Market Drivers
- 3.2. Market Restrains
- 3.3. Market Trends
- 3.4. Market Opportunities
- 4. Market Factor Analysis
- 4.1. Porters Five Forces
- 4.1.1. Bargaining Power of Suppliers
- 4.1.2. Bargaining Power of Buyers
- 4.1.3. Threat of New Entrants
- 4.1.4. Threat of Substitutes
- 4.1.5. Competitive Rivalry
- 4.2. PESTEL analysis
- 4.3. BCG Analysis
- 4.3.1. Stars (High Growth, High Market Share)
- 4.3.2. Cash Cows (Low Growth, High Market Share)
- 4.3.3. Question Mark (High Growth, Low Market Share)
- 4.3.4. Dogs (Low Growth, Low Market Share)
- 4.4. Ansoff Matrix Analysis
- 4.5. Supply Chain Analysis
- 4.6. Regulatory Landscape
- 4.7. Current Market Potential and Opportunity Assessment (TAM–SAM–SOM Framework)
- 4.8. PRI Analyst Note
- 4.1. Porters Five Forces
- 5. Market Analysis, Insights and Forecast 2021-2033
- 5.1. Market Analysis, Insights and Forecast - by Production Analysis
- 5.2. Market Analysis, Insights and Forecast - by Consumption Analysis
- 5.3. Market Analysis, Insights and Forecast - by Import Market Analysis (Value & Volume)
- 5.4. Market Analysis, Insights and Forecast - by Export Market Analysis (Value & Volume)
- 5.5. Market Analysis, Insights and Forecast - by Price Trend Analysis
- 5.6. Market Analysis, Insights and Forecast - by Region
- 5.6.1. North America
- 5.6.2. South America
- 5.6.3. Europe
- 5.6.4. Middle East & Africa
- 5.6.5. Asia Pacific
- 6. Global Active Protection Systems Market Analysis, Insights and Forecast, 2021-2033
- 6.1. Market Analysis, Insights and Forecast - by Production Analysis
- 6.2. Market Analysis, Insights and Forecast - by Consumption Analysis
- 6.3. Market Analysis, Insights and Forecast - by Import Market Analysis (Value & Volume)
- 6.4. Market Analysis, Insights and Forecast - by Export Market Analysis (Value & Volume)
- 6.5. Market Analysis, Insights and Forecast - by Price Trend Analysis
- 7. North America Active Protection Systems Market Analysis, Insights and Forecast, 2020-2032
- 7.1. Market Analysis, Insights and Forecast - by Production Analysis
- 7.2. Market Analysis, Insights and Forecast - by Consumption Analysis
- 7.3. Market Analysis, Insights and Forecast - by Import Market Analysis (Value & Volume)
- 7.4. Market Analysis, Insights and Forecast - by Export Market Analysis (Value & Volume)
- 7.5. Market Analysis, Insights and Forecast - by Price Trend Analysis
- 8. South America Active Protection Systems Market Analysis, Insights and Forecast, 2020-2032
- 8.1. Market Analysis, Insights and Forecast - by Production Analysis
- 8.2. Market Analysis, Insights and Forecast - by Consumption Analysis
- 8.3. Market Analysis, Insights and Forecast - by Import Market Analysis (Value & Volume)
- 8.4. Market Analysis, Insights and Forecast - by Export Market Analysis (Value & Volume)
- 8.5. Market Analysis, Insights and Forecast - by Price Trend Analysis
- 9. Europe Active Protection Systems Market Analysis, Insights and Forecast, 2020-2032
- 9.1. Market Analysis, Insights and Forecast - by Production Analysis
- 9.2. Market Analysis, Insights and Forecast - by Consumption Analysis
- 9.3. Market Analysis, Insights and Forecast - by Import Market Analysis (Value & Volume)
- 9.4. Market Analysis, Insights and Forecast - by Export Market Analysis (Value & Volume)
- 9.5. Market Analysis, Insights and Forecast - by Price Trend Analysis
- 10. Middle East & Africa Active Protection Systems Market Analysis, Insights and Forecast, 2020-2032
- 10.1. Market Analysis, Insights and Forecast - by Production Analysis
- 10.2. Market Analysis, Insights and Forecast - by Consumption Analysis
- 10.3. Market Analysis, Insights and Forecast - by Import Market Analysis (Value & Volume)
- 10.4. Market Analysis, Insights and Forecast - by Export Market Analysis (Value & Volume)
- 10.5. Market Analysis, Insights and Forecast - by Price Trend Analysis
- 11. Asia Pacific Active Protection Systems Market Analysis, Insights and Forecast, 2020-2032
- 11.1. Market Analysis, Insights and Forecast - by Production Analysis
- 11.2. Market Analysis, Insights and Forecast - by Consumption Analysis
- 11.3. Market Analysis, Insights and Forecast - by Import Market Analysis (Value & Volume)
- 11.4. Market Analysis, Insights and Forecast - by Export Market Analysis (Value & Volume)
- 11.5. Market Analysis, Insights and Forecast - by Price Trend Analysis
- 12. Competitive Analysis
- 12.1. Company Profiles
- 12.1.1 THALES
- 12.1.1.1. Company Overview
- 12.1.1.2. Products
- 12.1.1.3. Company Financials
- 12.1.1.4. SWOT Analysis
- 12.1.2 General Dynamics Corporation
- 12.1.2.1. Company Overview
- 12.1.2.2. Products
- 12.1.2.3. Company Financials
- 12.1.2.4. SWOT Analysis
- 12.1.3 Rheinmetall AG
- 12.1.3.1. Company Overview
- 12.1.3.2. Products
- 12.1.3.3. Company Financials
- 12.1.3.4. SWOT Analysis
- 12.1.4 Elbit Systems Ltd
- 12.1.4.1. Company Overview
- 12.1.4.2. Products
- 12.1.4.3. Company Financials
- 12.1.4.4. SWOT Analysis
- 12.1.5 Kongsberg Gruppen ASA
- 12.1.5.1. Company Overview
- 12.1.5.2. Products
- 12.1.5.3. Company Financials
- 12.1.5.4. SWOT Analysis
- 12.1.6 Rostec State Corporatio
- 12.1.6.1. Company Overview
- 12.1.6.2. Products
- 12.1.6.3. Company Financials
- 12.1.6.4. SWOT Analysis
- 12.1.7 Rafael Advanced Defense Systems Ltd
- 12.1.7.1. Company Overview
- 12.1.7.2. Products
- 12.1.7.3. Company Financials
- 12.1.7.4. SWOT Analysis
- 12.1.8 RTX Corporation
- 12.1.8.1. Company Overview
- 12.1.8.2. Products
- 12.1.8.3. Company Financials
- 12.1.8.4. SWOT Analysis
- 12.1.9 Artis
- 12.1.9.1. Company Overview
- 12.1.9.2. Products
- 12.1.9.3. Company Financials
- 12.1.9.4. SWOT Analysis
- 12.1.10 Leonardo S p A
- 12.1.10.1. Company Overview
- 12.1.10.2. Products
- 12.1.10.3. Company Financials
- 12.1.10.4. SWOT Analysis
- 12.1.11 BAE Systems plc
- 12.1.11.1. Company Overview
- 12.1.11.2. Products
- 12.1.11.3. Company Financials
- 12.1.11.4. SWOT Analysis
- 12.1.12 Saab AB
- 12.1.12.1. Company Overview
- 12.1.12.2. Products
- 12.1.12.3. Company Financials
- 12.1.12.4. SWOT Analysis
- 12.1.13 ASELSAN A Ş
- 12.1.13.1. Company Overview
- 12.1.13.2. Products
- 12.1.13.3. Company Financials
- 12.1.13.4. SWOT Analysis
- 12.1.1 THALES
- 12.2. Market Entropy
- 12.2.1 Company's Key Areas Served
- 12.2.2 Recent Developments
- 12.3. Company Market Share Analysis 2025
- 12.3.1 Top 5 Companies Market Share Analysis
- 12.3.2 Top 3 Companies Market Share Analysis
- 12.4. List of Potential Customers
- 13. Research Methodology
List of Figures
- Figure 1: Global Active Protection Systems Market Revenue Breakdown (Million, %) by Region 2025 & 2033
- Figure 2: North America Active Protection Systems Market Revenue (Million), by Production Analysis 2025 & 2033
- Figure 3: North America Active Protection Systems Market Revenue Share (%), by Production Analysis 2025 & 2033
- Figure 4: North America Active Protection Systems Market Revenue (Million), by Consumption Analysis 2025 & 2033
- Figure 5: North America Active Protection Systems Market Revenue Share (%), by Consumption Analysis 2025 & 2033
- Figure 6: North America Active Protection Systems Market Revenue (Million), by Import Market Analysis (Value & Volume) 2025 & 2033
- Figure 7: North America Active Protection Systems Market Revenue Share (%), by Import Market Analysis (Value & Volume) 2025 & 2033
- Figure 8: North America Active Protection Systems Market Revenue (Million), by Export Market Analysis (Value & Volume) 2025 & 2033
- Figure 9: North America Active Protection Systems Market Revenue Share (%), by Export Market Analysis (Value & Volume) 2025 & 2033
- Figure 10: North America Active Protection Systems Market Revenue (Million), by Price Trend Analysis 2025 & 2033
- Figure 11: North America Active Protection Systems Market Revenue Share (%), by Price Trend Analysis 2025 & 2033
- Figure 12: North America Active Protection Systems Market Revenue (Million), by Country 2025 & 2033
- Figure 13: North America Active Protection Systems Market Revenue Share (%), by Country 2025 & 2033
- Figure 14: South America Active Protection Systems Market Revenue (Million), by Production Analysis 2025 & 2033
- Figure 15: South America Active Protection Systems Market Revenue Share (%), by Production Analysis 2025 & 2033
- Figure 16: South America Active Protection Systems Market Revenue (Million), by Consumption Analysis 2025 & 2033
- Figure 17: South America Active Protection Systems Market Revenue Share (%), by Consumption Analysis 2025 & 2033
- Figure 18: South America Active Protection Systems Market Revenue (Million), by Import Market Analysis (Value & Volume) 2025 & 2033
- Figure 19: South America Active Protection Systems Market Revenue Share (%), by Import Market Analysis (Value & Volume) 2025 & 2033
- Figure 20: South America Active Protection Systems Market Revenue (Million), by Export Market Analysis (Value & Volume) 2025 & 2033
- Figure 21: South America Active Protection Systems Market Revenue Share (%), by Export Market Analysis (Value & Volume) 2025 & 2033
- Figure 22: South America Active Protection Systems Market Revenue (Million), by Price Trend Analysis 2025 & 2033
- Figure 23: South America Active Protection Systems Market Revenue Share (%), by Price Trend Analysis 2025 & 2033
- Figure 24: South America Active Protection Systems Market Revenue (Million), by Country 2025 & 2033
- Figure 25: South America Active Protection Systems Market Revenue Share (%), by Country 2025 & 2033
- Figure 26: Europe Active Protection Systems Market Revenue (Million), by Production Analysis 2025 & 2033
- Figure 27: Europe Active Protection Systems Market Revenue Share (%), by Production Analysis 2025 & 2033
- Figure 28: Europe Active Protection Systems Market Revenue (Million), by Consumption Analysis 2025 & 2033
- Figure 29: Europe Active Protection Systems Market Revenue Share (%), by Consumption Analysis 2025 & 2033
- Figure 30: Europe Active Protection Systems Market Revenue (Million), by Import Market Analysis (Value & Volume) 2025 & 2033
- Figure 31: Europe Active Protection Systems Market Revenue Share (%), by Import Market Analysis (Value & Volume) 2025 & 2033
- Figure 32: Europe Active Protection Systems Market Revenue (Million), by Export Market Analysis (Value & Volume) 2025 & 2033
- Figure 33: Europe Active Protection Systems Market Revenue Share (%), by Export Market Analysis (Value & Volume) 2025 & 2033
- Figure 34: Europe Active Protection Systems Market Revenue (Million), by Price Trend Analysis 2025 & 2033
- Figure 35: Europe Active Protection Systems Market Revenue Share (%), by Price Trend Analysis 2025 & 2033
- Figure 36: Europe Active Protection Systems Market Revenue (Million), by Country 2025 & 2033
- Figure 37: Europe Active Protection Systems Market Revenue Share (%), by Country 2025 & 2033
- Figure 38: Middle East & Africa Active Protection Systems Market Revenue (Million), by Production Analysis 2025 & 2033
- Figure 39: Middle East & Africa Active Protection Systems Market Revenue Share (%), by Production Analysis 2025 & 2033
- Figure 40: Middle East & Africa Active Protection Systems Market Revenue (Million), by Consumption Analysis 2025 & 2033
- Figure 41: Middle East & Africa Active Protection Systems Market Revenue Share (%), by Consumption Analysis 2025 & 2033
- Figure 42: Middle East & Africa Active Protection Systems Market Revenue (Million), by Import Market Analysis (Value & Volume) 2025 & 2033
- Figure 43: Middle East & Africa Active Protection Systems Market Revenue Share (%), by Import Market Analysis (Value & Volume) 2025 & 2033
- Figure 44: Middle East & Africa Active Protection Systems Market Revenue (Million), by Export Market Analysis (Value & Volume) 2025 & 2033
- Figure 45: Middle East & Africa Active Protection Systems Market Revenue Share (%), by Export Market Analysis (Value & Volume) 2025 & 2033
- Figure 46: Middle East & Africa Active Protection Systems Market Revenue (Million), by Price Trend Analysis 2025 & 2033
- Figure 47: Middle East & Africa Active Protection Systems Market Revenue Share (%), by Price Trend Analysis 2025 & 2033
- Figure 48: Middle East & Africa Active Protection Systems Market Revenue (Million), by Country 2025 & 2033
- Figure 49: Middle East & Africa Active Protection Systems Market Revenue Share (%), by Country 2025 & 2033
- Figure 50: Asia Pacific Active Protection Systems Market Revenue (Million), by Production Analysis 2025 & 2033
- Figure 51: Asia Pacific Active Protection Systems Market Revenue Share (%), by Production Analysis 2025 & 2033
- Figure 52: Asia Pacific Active Protection Systems Market Revenue (Million), by Consumption Analysis 2025 & 2033
- Figure 53: Asia Pacific Active Protection Systems Market Revenue Share (%), by Consumption Analysis 2025 & 2033
- Figure 54: Asia Pacific Active Protection Systems Market Revenue (Million), by Import Market Analysis (Value & Volume) 2025 & 2033
- Figure 55: Asia Pacific Active Protection Systems Market Revenue Share (%), by Import Market Analysis (Value & Volume) 2025 & 2033
- Figure 56: Asia Pacific Active Protection Systems Market Revenue (Million), by Export Market Analysis (Value & Volume) 2025 & 2033
- Figure 57: Asia Pacific Active Protection Systems Market Revenue Share (%), by Export Market Analysis (Value & Volume) 2025 & 2033
- Figure 58: Asia Pacific Active Protection Systems Market Revenue (Million), by Price Trend Analysis 2025 & 2033
- Figure 59: Asia Pacific Active Protection Systems Market Revenue Share (%), by Price Trend Analysis 2025 & 2033
- Figure 60: Asia Pacific Active Protection Systems Market Revenue (Million), by Country 2025 & 2033
- Figure 61: Asia Pacific Active Protection Systems Market Revenue Share (%), by Country 2025 & 2033
List of Tables
- Table 1: Global Active Protection Systems Market Revenue Million Forecast, by Production Analysis 2020 & 2033
- Table 2: Global Active Protection Systems Market Revenue Million Forecast, by Consumption Analysis 2020 & 2033
- Table 3: Global Active Protection Systems Market Revenue Million Forecast, by Import Market Analysis (Value & Volume) 2020 & 2033
- Table 4: Global Active Protection Systems Market Revenue Million Forecast, by Export Market Analysis (Value & Volume) 2020 & 2033
- Table 5: Global Active Protection Systems Market Revenue Million Forecast, by Price Trend Analysis 2020 & 2033
- Table 6: Global Active Protection Systems Market Revenue Million Forecast, by Region 2020 & 2033
- Table 7: Global Active Protection Systems Market Revenue Million Forecast, by Production Analysis 2020 & 2033
- Table 8: Global Active Protection Systems Market Revenue Million Forecast, by Consumption Analysis 2020 & 2033
- Table 9: Global Active Protection Systems Market Revenue Million Forecast, by Import Market Analysis (Value & Volume) 2020 & 2033
- Table 10: Global Active Protection Systems Market Revenue Million Forecast, by Export Market Analysis (Value & Volume) 2020 & 2033
- Table 11: Global Active Protection Systems Market Revenue Million Forecast, by Price Trend Analysis 2020 & 2033
- Table 12: Global Active Protection Systems Market Revenue Million Forecast, by Country 2020 & 2033
- Table 13: United States Active Protection Systems Market Revenue (Million) Forecast, by Application 2020 & 2033
- Table 14: Canada Active Protection Systems Market Revenue (Million) Forecast, by Application 2020 & 2033
- Table 15: Mexico Active Protection Systems Market Revenue (Million) Forecast, by Application 2020 & 2033
- Table 16: Global Active Protection Systems Market Revenue Million Forecast, by Production Analysis 2020 & 2033
- Table 17: Global Active Protection Systems Market Revenue Million Forecast, by Consumption Analysis 2020 & 2033
- Table 18: Global Active Protection Systems Market Revenue Million Forecast, by Import Market Analysis (Value & Volume) 2020 & 2033
- Table 19: Global Active Protection Systems Market Revenue Million Forecast, by Export Market Analysis (Value & Volume) 2020 & 2033
- Table 20: Global Active Protection Systems Market Revenue Million Forecast, by Price Trend Analysis 2020 & 2033
- Table 21: Global Active Protection Systems Market Revenue Million Forecast, by Country 2020 & 2033
- Table 22: Brazil Active Protection Systems Market Revenue (Million) Forecast, by Application 2020 & 2033
- Table 23: Argentina Active Protection Systems Market Revenue (Million) Forecast, by Application 2020 & 2033
- Table 24: Rest of South America Active Protection Systems Market Revenue (Million) Forecast, by Application 2020 & 2033
- Table 25: Global Active Protection Systems Market Revenue Million Forecast, by Production Analysis 2020 & 2033
- Table 26: Global Active Protection Systems Market Revenue Million Forecast, by Consumption Analysis 2020 & 2033
- Table 27: Global Active Protection Systems Market Revenue Million Forecast, by Import Market Analysis (Value & Volume) 2020 & 2033
- Table 28: Global Active Protection Systems Market Revenue Million Forecast, by Export Market Analysis (Value & Volume) 2020 & 2033
- Table 29: Global Active Protection Systems Market Revenue Million Forecast, by Price Trend Analysis 2020 & 2033
- Table 30: Global Active Protection Systems Market Revenue Million Forecast, by Country 2020 & 2033
- Table 31: United Kingdom Active Protection Systems Market Revenue (Million) Forecast, by Application 2020 & 2033
- Table 32: Germany Active Protection Systems Market Revenue (Million) Forecast, by Application 2020 & 2033
- Table 33: France Active Protection Systems Market Revenue (Million) Forecast, by Application 2020 & 2033
- Table 34: Italy Active Protection Systems Market Revenue (Million) Forecast, by Application 2020 & 2033
- Table 35: Spain Active Protection Systems Market Revenue (Million) Forecast, by Application 2020 & 2033
- Table 36: Russia Active Protection Systems Market Revenue (Million) Forecast, by Application 2020 & 2033
- Table 37: Benelux Active Protection Systems Market Revenue (Million) Forecast, by Application 2020 & 2033
- Table 38: Nordics Active Protection Systems Market Revenue (Million) Forecast, by Application 2020 & 2033
- Table 39: Rest of Europe Active Protection Systems Market Revenue (Million) Forecast, by Application 2020 & 2033
- Table 40: Global Active Protection Systems Market Revenue Million Forecast, by Production Analysis 2020 & 2033
- Table 41: Global Active Protection Systems Market Revenue Million Forecast, by Consumption Analysis 2020 & 2033
- Table 42: Global Active Protection Systems Market Revenue Million Forecast, by Import Market Analysis (Value & Volume) 2020 & 2033
- Table 43: Global Active Protection Systems Market Revenue Million Forecast, by Export Market Analysis (Value & Volume) 2020 & 2033
- Table 44: Global Active Protection Systems Market Revenue Million Forecast, by Price Trend Analysis 2020 & 2033
- Table 45: Global Active Protection Systems Market Revenue Million Forecast, by Country 2020 & 2033
- Table 46: Turkey Active Protection Systems Market Revenue (Million) Forecast, by Application 2020 & 2033
- Table 47: Israel Active Protection Systems Market Revenue (Million) Forecast, by Application 2020 & 2033
- Table 48: GCC Active Protection Systems Market Revenue (Million) Forecast, by Application 2020 & 2033
- Table 49: North Africa Active Protection Systems Market Revenue (Million) Forecast, by Application 2020 & 2033
- Table 50: South Africa Active Protection Systems Market Revenue (Million) Forecast, by Application 2020 & 2033
- Table 51: Rest of Middle East & Africa Active Protection Systems Market Revenue (Million) Forecast, by Application 2020 & 2033
- Table 52: Global Active Protection Systems Market Revenue Million Forecast, by Production Analysis 2020 & 2033
- Table 53: Global Active Protection Systems Market Revenue Million Forecast, by Consumption Analysis 2020 & 2033
- Table 54: Global Active Protection Systems Market Revenue Million Forecast, by Import Market Analysis (Value & Volume) 2020 & 2033
- Table 55: Global Active Protection Systems Market Revenue Million Forecast, by Export Market Analysis (Value & Volume) 2020 & 2033
- Table 56: Global Active Protection Systems Market Revenue Million Forecast, by Price Trend Analysis 2020 & 2033
- Table 57: Global Active Protection Systems Market Revenue Million Forecast, by Country 2020 & 2033
- Table 58: China Active Protection Systems Market Revenue (Million) Forecast, by Application 2020 & 2033
- Table 59: India Active Protection Systems Market Revenue (Million) Forecast, by Application 2020 & 2033
- Table 60: Japan Active Protection Systems Market Revenue (Million) Forecast, by Application 2020 & 2033
- Table 61: South Korea Active Protection Systems Market Revenue (Million) Forecast, by Application 2020 & 2033
- Table 62: ASEAN Active Protection Systems Market Revenue (Million) Forecast, by Application 2020 & 2033
- Table 63: Oceania Active Protection Systems Market Revenue (Million) Forecast, by Application 2020 & 2033
- Table 64: Rest of Asia Pacific Active Protection Systems Market Revenue (Million) Forecast, by Application 2020 & 2033
Frequently Asked Questions
1. What is the projected Compound Annual Growth Rate (CAGR) of the Active Protection Systems Market?
The projected CAGR is approximately 6.06%.
2. Which companies are prominent players in the Active Protection Systems Market?
Key companies in the market include THALES, General Dynamics Corporation, Rheinmetall AG, Elbit Systems Ltd, Kongsberg Gruppen ASA, Rostec State Corporatio, Rafael Advanced Defense Systems Ltd, RTX Corporation, Artis, Leonardo S p A, BAE Systems plc, Saab AB, ASELSAN A Ş.
3. What are the main segments of the Active Protection Systems Market?
The market segments include Production Analysis, Consumption Analysis, Import Market Analysis (Value & Volume), Export Market Analysis (Value & Volume), Price Trend Analysis.
4. Can you provide details about the market size?
The market size is estimated to be USD 4.23 Million as of 2022.
5. What are some drivers contributing to market growth?
; Increasing Number Of Air Passengers; Use Of Portable Electronic Devices.
6. What are the notable trends driving market growth?
The Terrestrial Segment Holds Highest Shares in the Market.
7. Are there any restraints impacting market growth?
; High Cost Of Connectivity Equipments.
8. Can you provide examples of recent developments in the market?
N/A
9. What pricing options are available for accessing the report?
Pricing options include single-user, multi-user, and enterprise licenses priced at USD 4750, USD 5250, and USD 8750 respectively.
10. Is the market size provided in terms of value or volume?
The market size is provided in terms of value, measured in Million.
11. Are there any specific market keywords associated with the report?
Yes, the market keyword associated with the report is "Active Protection Systems Market," which aids in identifying and referencing the specific market segment covered.
12. How do I determine which pricing option suits my needs best?
The pricing options vary based on user requirements and access needs. Individual users may opt for single-user licenses, while businesses requiring broader access may choose multi-user or enterprise licenses for cost-effective access to the report.
13. Are there any additional resources or data provided in the Active Protection Systems Market report?
While the report offers comprehensive insights, it's advisable to review the specific contents or supplementary materials provided to ascertain if additional resources or data are available.
14. How can I stay updated on further developments or reports in the Active Protection Systems Market?
To stay informed about further developments, trends, and reports in the Active Protection Systems Market, consider subscribing to industry newsletters, following relevant companies and organizations, or regularly checking reputable industry news sources and publications.
Methodology
Step 1 - Identification of Relevant Samples Size from Population Database


Step 2 - Approaches for Defining Global Market Size (Value, Volume* & Price*)

Note*: In applicable scenarios
Step 3 - Data Sources
Primary Research
- Web Analytics
- Survey Reports
- Research Institute
- Latest Research Reports
- Opinion Leaders
Secondary Research
- Annual Reports
- White Paper
- Latest Press Release
- Industry Association
- Paid Database
- Investor Presentations

Step 4 - Data Triangulation
Involves using different sources of information in order to increase the validity of a study
These sources are likely to be stakeholders in a program - participants, other researchers, program staff, other community members, and so on.
Then we put all data in single framework & apply various statistical tools to find out the dynamic on the market.
During the analysis stage, feedback from the stakeholder groups would be compared to determine areas of agreement as well as areas of divergence