

Key Insights
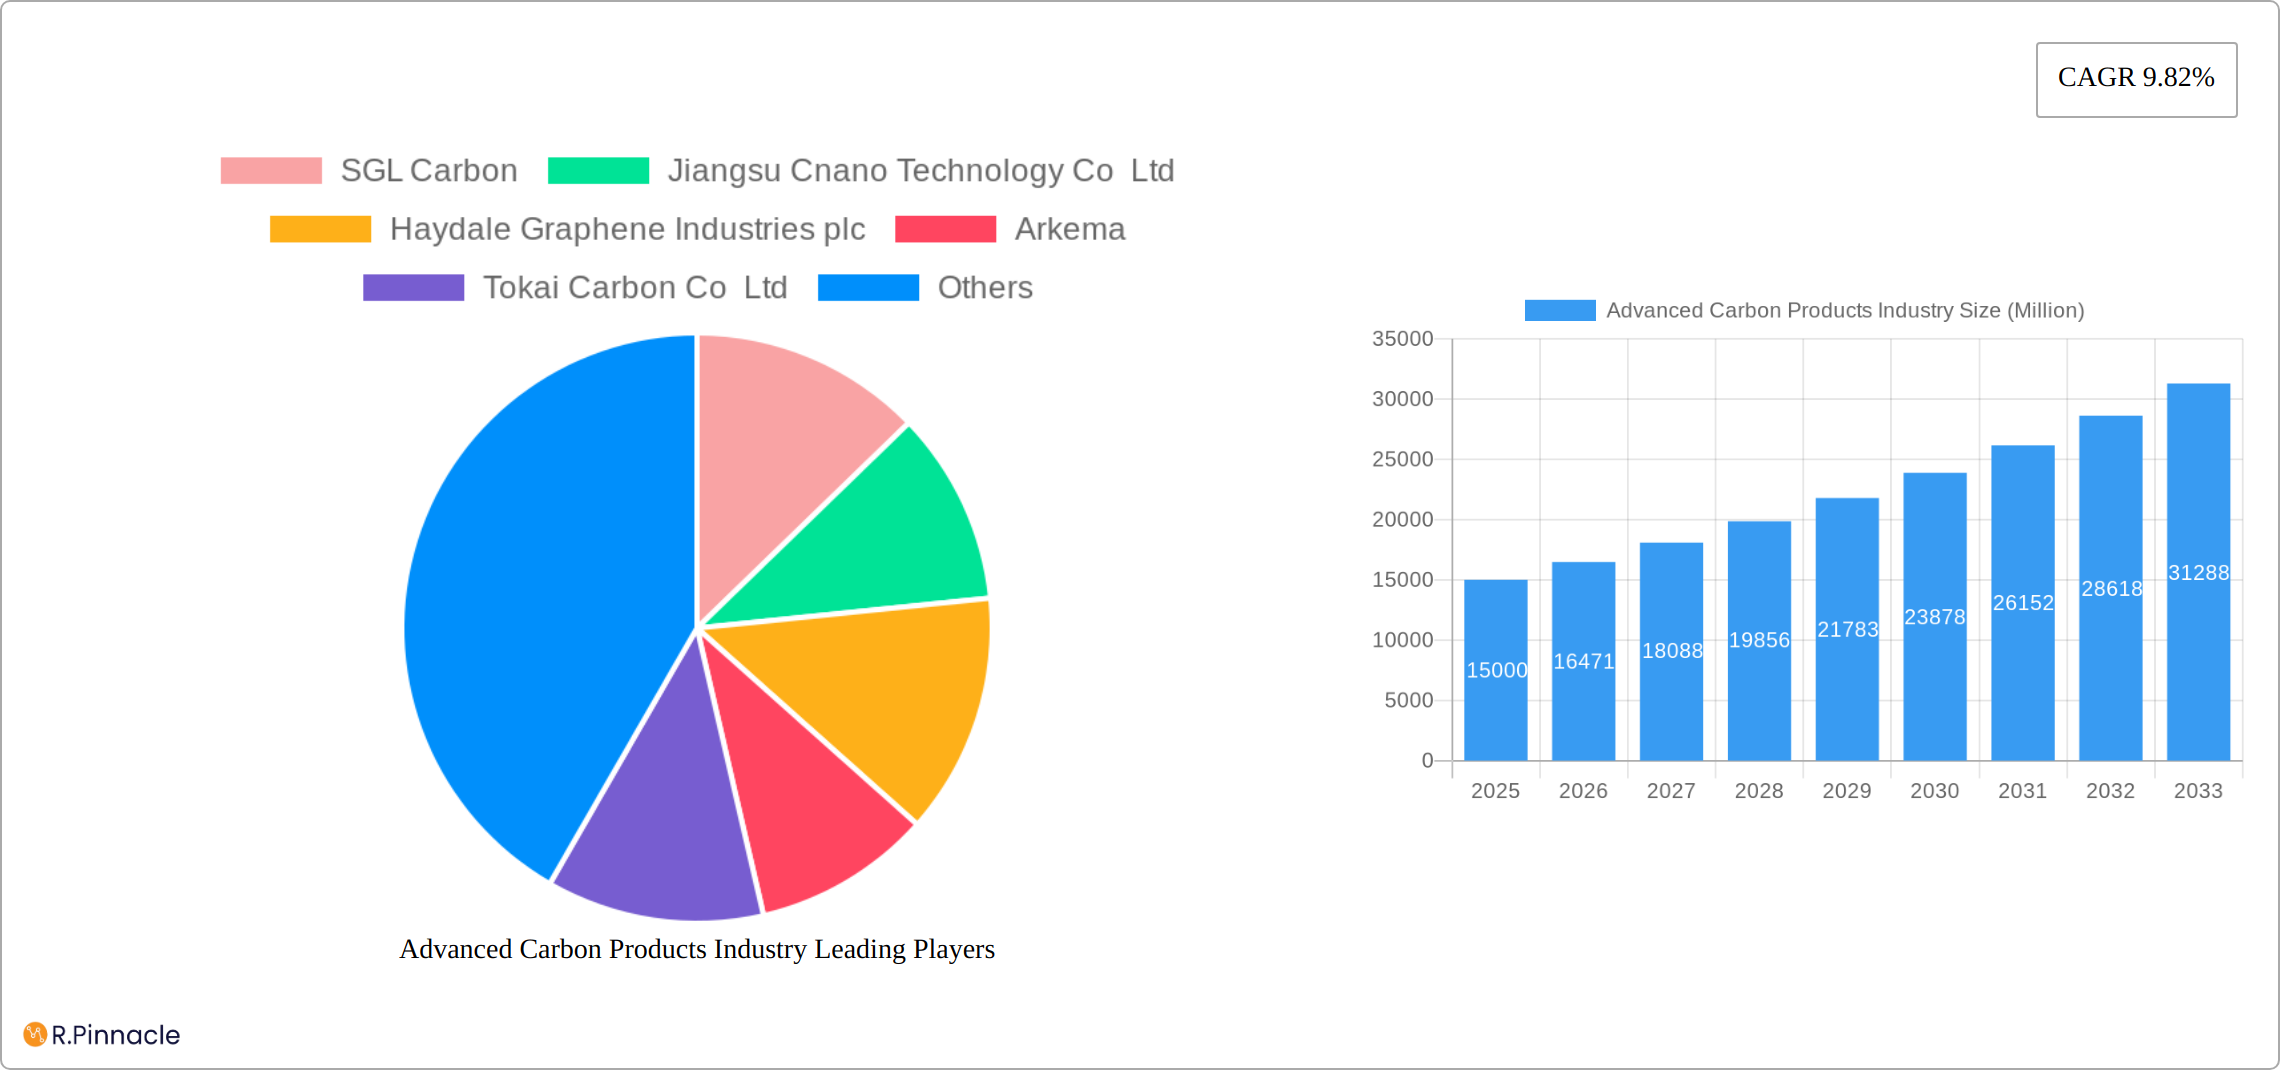
The advanced carbon products market, encompassing materials like carbon fibers, graphene, and carbon nanotubes, is experiencing robust growth, projected to maintain a Compound Annual Growth Rate (CAGR) of 9.82% from 2025 to 2033. This expansion is driven by several key factors. The increasing demand for lightweight yet high-strength materials in the aerospace and defense sectors fuels significant market adoption. Furthermore, the burgeoning electronics industry, with its need for advanced materials in semiconductors and energy storage, significantly contributes to market growth. The automotive industry's push for fuel efficiency and electric vehicle development further stimulates demand for carbon-based components. Innovation in construction materials, leveraging the unique properties of carbon products for durability and strength, also contributes to market expansion. Finally, the growing renewable energy sector, requiring efficient and durable energy storage solutions, presents a substantial opportunity for advanced carbon materials.
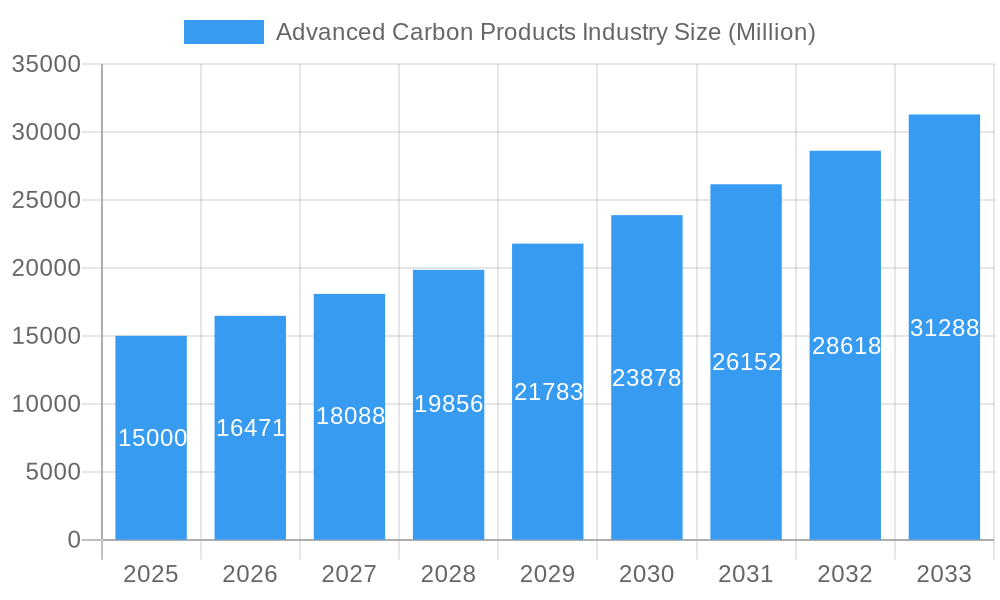
Advanced Carbon Products Industry Market Size (In Billion)
However, the market faces certain restraints. High production costs associated with some advanced carbon materials, such as graphene and carbon nanotubes, remain a barrier to wider adoption. Furthermore, the complexities involved in processing and handling these materials, particularly at scale, pose challenges for manufacturers. Nevertheless, ongoing research and development efforts are focused on reducing production costs and improving processing techniques, paving the way for broader market penetration. The market segmentation reveals a diverse landscape, with carbon fibers currently dominating the product type segment due to established applications, while graphene and carbon nanotubes are expected to witness substantial growth driven by their unique electrical and mechanical properties. Geographically, North America and Asia-Pacific are expected to lead the market, driven by strong industrial bases and substantial government investments in research and development of advanced materials.
Advanced Carbon Products Industry Company Market Share
Advanced Carbon Products Industry: A Comprehensive Market Report (2019-2033)
This in-depth report provides a comprehensive analysis of the Advanced Carbon Products industry, offering crucial insights for industry professionals, investors, and strategic planners. The report covers the period 2019-2033, with a focus on the estimated year 2025 and a forecast period of 2025-2033. The market is valued at XX Million in 2025 and is projected to reach XX Million by 2033, exhibiting a robust CAGR of XX%. This report delves into market structure, dynamics, leading players, and future growth potential, offering actionable intelligence for informed decision-making.
Advanced Carbon Products Industry Market Structure & Innovation Trends
The advanced carbon products industry is experiencing dynamic growth, driven by a confluence of factors shaping its competitive landscape and innovation trajectory. The market exhibits a moderately concentrated structure, with a few key players holding significant market share, particularly in specific segments like carbon fiber. While precise figures fluctuate, industry analysts estimate that leading companies such as SGL Carbon and Tokai Carbon collectively held a substantial portion of the carbon fiber market share in 2025. However, the competitive landscape is evolving with the emergence of new players and strategic partnerships. This concentration is further influenced by ongoing mergers and acquisitions activity. Innovation is spurred by the relentless demand for lightweight, high-strength, and high-performance materials across diverse sectors, most notably aerospace, automotive, and renewable energy. Stringent government regulations promoting sustainable materials and aggressive targets for carbon emission reductions are powerful catalysts for innovation and technological advancements.
- Market Concentration: Moderately concentrated, with leading players holding a substantial portion of the global market share, although this varies across specific product segments. The market structure is dynamic, impacted by ongoing consolidation.
- Innovation Drivers: Lightweighting imperatives, the need for enhanced material properties (strength, conductivity, thermal management), sustainability mandates, and the drive for improved energy efficiency are key drivers of innovation.
- Regulatory Frameworks: Government incentives for green technologies, regulations targeting carbon emissions, and policies promoting the adoption of sustainable materials are significantly influencing industry development.
- Product Substitutes: Advanced carbon products are increasingly competing with and replacing traditional materials such as steel and aluminum, particularly in applications demanding superior performance characteristics.
- End-User Demographics: Key end-use sectors include automotive (including the rapidly growing electric vehicle market), aerospace & defense, electronics, and renewable energy technologies.
- M&A Activities: Significant mergers and acquisitions activity reflects the strategic efforts of industry players to consolidate market share, expand product portfolios, and accelerate technological development.
Advanced Carbon Products Industry Market Dynamics & Trends
The Advanced Carbon Products market is experiencing significant growth propelled by several key factors. The rising adoption of electric vehicles (EVs) is significantly boosting demand for carbon fibers in lightweight automotive components. The increasing focus on renewable energy sources is driving the demand for special graphite in battery applications. Technological advancements in materials science, such as the development of stronger and more efficient carbon nanotubes and graphene, are expanding market applications. Consumer preference for eco-friendly and high-performance products further fuels market expansion. Competitive dynamics are intense, with companies focusing on product differentiation, technological advancements, and strategic partnerships to gain a competitive edge.
Dominant Regions & Segments in Advanced Carbon Products Industry
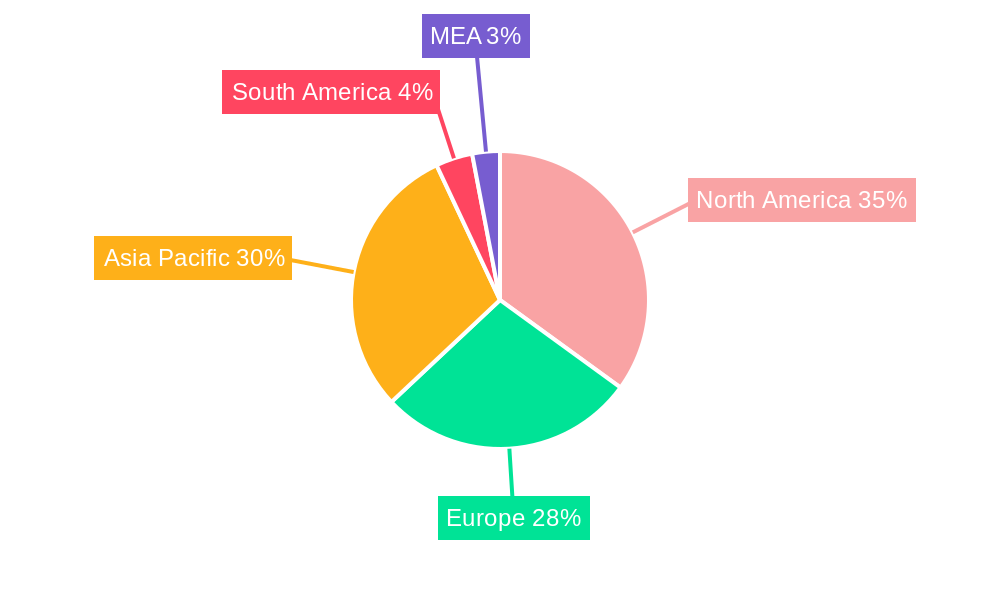
The Advanced Carbon Products market shows strong regional variations. North America and Asia-Pacific are the leading regions, driven by strong demand from automotive, aerospace, and electronics industries. Within product types, Carbon Fibers dominate the market due to their wide applications across various sectors. In terms of application, the Aerospace and Defence sector exhibits the highest growth rate owing to the stringent requirements for lightweight, high-strength materials in aircrafts and defense equipment.
- Leading Region: North America and Asia-Pacific
- Dominant Product Type: Carbon Fibers
- Fastest-Growing Application: Aerospace and Defence
Key Drivers:
- North America: Strong aerospace and automotive industries, supportive government policies, robust R&D infrastructure.
- Asia-Pacific: Rapid industrialization, rising disposable income, and government initiatives promoting renewable energy.
- Europe: Established automotive and aerospace industries, but facing competition from Asia.
Advanced Carbon Products Industry Product Innovations
Recent innovations include advancements in carbon fiber production techniques resulting in enhanced strength-to-weight ratios and cost reductions. Graphene-enhanced composites are gaining traction due to their superior electrical and thermal conductivity. The development of novel carbon foams with tailored properties for specific applications is expanding market opportunities. These innovations improve performance, reduce weight, and open up new markets in sectors like electronics, aerospace, and construction.
Report Scope & Segmentation Analysis
This report comprehensively segments the Advanced Carbon Products market based on product type (Carbon Fibers, Special Graphite, Carbon Nanotubes, Graphene, Carbon Foams, Others) and application (Aerospace and Defence, Electronics, Sports, Automotive, Construction, Energy, Others). Each segment’s market size, growth projections, and competitive dynamics are meticulously analyzed. For example, the Carbon Fiber segment is projected to witness a CAGR of XX% during the forecast period, driven by increased demand from the automotive and aerospace industries. Similarly, the Graphene segment is expected to show high growth due to its unique properties and diverse applications.
Key Drivers of Advanced Carbon Products Industry Growth
The robust growth trajectory of the advanced carbon products industry is underpinned by several compelling factors. The escalating demand for lightweight materials in the automotive and aerospace sectors is a primary driver, particularly with the rapid expansion of the electric vehicle (EV) market. The rise of renewable energy technologies, such as wind turbines and solar panels, creates significant demand for high-performance carbon-based materials. Moreover, continuous advancements in materials science are enabling the development of novel carbon-based materials with superior properties, opening up new application areas. Government initiatives promoting the adoption of sustainable materials and stringent emission regulations further accelerate market expansion.
Challenges in the Advanced Carbon Products Industry Sector
Despite the substantial growth potential, the advanced carbon products industry faces significant challenges. High production costs, particularly for advanced materials such as graphene and carbon nanotubes, remain a considerable hurdle. Supply chain disruptions impacting the availability of raw materials and specialized equipment pose further risks. Intense competition from established material manufacturers and the need for substantial investments in research and development to overcome technological barriers are also significant constraints. Regulatory hurdles and the complexities of scaling up production to meet growing demand impact market penetration and overall profitability.
Emerging Opportunities in Advanced Carbon Products Industry
Emerging opportunities include the expanding use of carbon-based materials in 3D printing, the development of novel applications in energy storage and biomedical devices, and increasing demand for sustainable and environmentally friendly materials in various sectors. The development of innovative composites using carbon nanotubes and graphene for advanced applications in aerospace and defense holds tremendous future potential.
Leading Players in the Advanced Carbon Products Industry Market
- SGL Carbon
- Jiangsu Cnano Technology Co Ltd
- Haydale Graphene Industries plc
- Arkema
- Tokai Carbon Co Ltd
- Solvay
- Antolin
- POCO
- Perpetuus Advanced Materials PLC
- FutureCarbon GmbH
- Shenzhen Sanshun Nano New Materials Co Ltd
- GrafTech International
- Nanocyl SA
- Grupo Graphenano
- Graphenea Inc
- Arry International Group Limited
- Ningbo Morsh Technology
- Hyperion Catalysis International
- XG Sciences Inc
- The Sixth Element (Changzhou) Materials Technology Co Ltd
- Nano-C
- Nippon Graphite Fiber Co Ltd
- Global Graphene Group
- Toyo Tanso Co Ltd
- CFOAM LLC
- TORAY INDUSTRIES INC
- Mitsubishi Chemical Carbon Fiber and Composites Inc
- Thomas Swan & Co Ltd
- Hexcel Corporation
- Formosa Plastics Corporation
- TEIJIN LIMITED
- Graphite India Limited
- SHOWA DENKO K K
Key Developments in Advanced Carbon Products Industry
- 2022 Q4: Arkema launched a new high-performance carbon fiber composite specifically designed for automotive applications, showcasing advancements in material science and manufacturing.
- 2023 Q1: SGL Carbon announced a strategic partnership aimed at significantly expanding its graphene production capacity, highlighting the growing demand for this advanced material.
- 2023 Q2: A merger between two leading carbon nanotube producers resulted in a substantial expansion of market share, illustrating the ongoing consolidation within the industry. (Specific companies remain undisclosed due to ongoing confidentiality agreements.)
- 2024 Q1: A significant investment in research and development for advanced carbon foams was announced, indicating a focus on innovation and the exploration of new product applications. (Specific company details are not yet publicly available.)
Future Outlook for Advanced Carbon Products Market
The Advanced Carbon Products market is poised for significant growth, driven by technological advancements, increasing demand from various sectors, and favorable government policies. Strategic investments in research and development, innovative product development, and expansion into new applications will shape the industry's future trajectory. The market is expected to witness robust growth over the next decade, offering substantial opportunities for established players and new entrants alike.
Advanced Carbon Products Industry Segmentation
-
1. Product Type
- 1.1. Carbon Fibers
- 1.2. Special Graphite
- 1.3. Carbon Nanotubes
- 1.4. Graphene
- 1.5. Carbon Foams (Includes Carbon Nanofoams)
- 1.6. Others (
-
2. Application
- 2.1. Aerospace and Defence
- 2.2. Electronics
- 2.3. Sports
- 2.4. Automotive
- 2.5. Construction
- 2.6. Energy
- 2.7. Others
Advanced Carbon Products Industry Segmentation By Geography
-
1. Asia Pacific
- 1.1. China
- 1.2. India
- 1.3. Japan
- 1.4. South Korea
- 1.5. Rest of Asia Pacific
-
2. North America
- 2.1. United States
- 2.2. Canada
- 2.3. Mexico
-
3. Europe
- 3.1. Germany
- 3.2. United Kingdom
- 3.3. France
- 3.4. Italy
- 3.5. Spain
- 3.6. Russia
- 3.7. Rest of Europe
-
4. South America
- 4.1. Brazil
- 4.2. Argentina
- 4.3. Rest of South America
-
5. Middle East and Africa
- 5.1. Saudi Arabia
- 5.2. United Arab Emirates
- 5.3. South Africa
- 5.4. Rest of Middle East and Africa
Advanced Carbon Products Industry Regional Market Share
Geographic Coverage of Advanced Carbon Products Industry
Advanced Carbon Products Industry REPORT HIGHLIGHTS
| Aspects | Details |
|---|---|
| Study Period | 2020-2034 |
| Base Year | 2025 |
| Estimated Year | 2026 |
| Forecast Period | 2026-2034 |
| Historical Period | 2020-2025 |
| Growth Rate | CAGR of 9.82% from 2020-2034 |
| Segmentation |
|
Table of Contents
- 1. Introduction
- 1.1. Research Scope
- 1.2. Market Segmentation
- 1.3. Research Objective
- 1.4. Definitions and Assumptions
- 2. Executive Summary
- 2.1. Market Snapshot
- 3. Market Dynamics
- 3.1. Market Drivers
- 3.2. Market Restrains
- 3.3. Market Trends
- 3.4. Market Opportunities
- 4. Market Factor Analysis
- 4.1. Porters Five Forces
- 4.1.1. Bargaining Power of Suppliers
- 4.1.2. Bargaining Power of Buyers
- 4.1.3. Threat of New Entrants
- 4.1.4. Threat of Substitutes
- 4.1.5. Competitive Rivalry
- 4.2. PESTEL analysis
- 4.3. BCG Analysis
- 4.3.1. Stars (High Growth, High Market Share)
- 4.3.2. Cash Cows (Low Growth, High Market Share)
- 4.3.3. Question Mark (High Growth, Low Market Share)
- 4.3.4. Dogs (Low Growth, Low Market Share)
- 4.4. Ansoff Matrix Analysis
- 4.5. Supply Chain Analysis
- 4.6. Regulatory Landscape
- 4.7. Current Market Potential and Opportunity Assessment (TAM–SAM–SOM Framework)
- 4.8. PRI Analyst Note
- 4.1. Porters Five Forces
- 5. Market Analysis, Insights and Forecast 2021-2033
- 5.1. Market Analysis, Insights and Forecast - by Product Type
- 5.1.1. Carbon Fibers
- 5.1.2. Special Graphite
- 5.1.3. Carbon Nanotubes
- 5.1.4. Graphene
- 5.1.5. Carbon Foams (Includes Carbon Nanofoams)
- 5.1.6. Others (
- 5.2. Market Analysis, Insights and Forecast - by Application
- 5.2.1. Aerospace and Defence
- 5.2.2. Electronics
- 5.2.3. Sports
- 5.2.4. Automotive
- 5.2.5. Construction
- 5.2.6. Energy
- 5.2.7. Others
- 5.3. Market Analysis, Insights and Forecast - by Region
- 5.3.1. Asia Pacific
- 5.3.2. North America
- 5.3.3. Europe
- 5.3.4. South America
- 5.3.5. Middle East and Africa
- 5.1. Market Analysis, Insights and Forecast - by Product Type
- 6. Global Advanced Carbon Products Industry Analysis, Insights and Forecast, 2021-2033
- 6.1. Market Analysis, Insights and Forecast - by Product Type
- 6.1.1. Carbon Fibers
- 6.1.2. Special Graphite
- 6.1.3. Carbon Nanotubes
- 6.1.4. Graphene
- 6.1.5. Carbon Foams (Includes Carbon Nanofoams)
- 6.1.6. Others (
- 6.2. Market Analysis, Insights and Forecast - by Application
- 6.2.1. Aerospace and Defence
- 6.2.2. Electronics
- 6.2.3. Sports
- 6.2.4. Automotive
- 6.2.5. Construction
- 6.2.6. Energy
- 6.2.7. Others
- 6.1. Market Analysis, Insights and Forecast - by Product Type
- 7. Asia Pacific Advanced Carbon Products Industry Analysis, Insights and Forecast, 2020-2032
- 7.1. Market Analysis, Insights and Forecast - by Product Type
- 7.1.1. Carbon Fibers
- 7.1.2. Special Graphite
- 7.1.3. Carbon Nanotubes
- 7.1.4. Graphene
- 7.1.5. Carbon Foams (Includes Carbon Nanofoams)
- 7.1.6. Others (
- 7.2. Market Analysis, Insights and Forecast - by Application
- 7.2.1. Aerospace and Defence
- 7.2.2. Electronics
- 7.2.3. Sports
- 7.2.4. Automotive
- 7.2.5. Construction
- 7.2.6. Energy
- 7.2.7. Others
- 7.1. Market Analysis, Insights and Forecast - by Product Type
- 8. North America Advanced Carbon Products Industry Analysis, Insights and Forecast, 2020-2032
- 8.1. Market Analysis, Insights and Forecast - by Product Type
- 8.1.1. Carbon Fibers
- 8.1.2. Special Graphite
- 8.1.3. Carbon Nanotubes
- 8.1.4. Graphene
- 8.1.5. Carbon Foams (Includes Carbon Nanofoams)
- 8.1.6. Others (
- 8.2. Market Analysis, Insights and Forecast - by Application
- 8.2.1. Aerospace and Defence
- 8.2.2. Electronics
- 8.2.3. Sports
- 8.2.4. Automotive
- 8.2.5. Construction
- 8.2.6. Energy
- 8.2.7. Others
- 8.1. Market Analysis, Insights and Forecast - by Product Type
- 9. Europe Advanced Carbon Products Industry Analysis, Insights and Forecast, 2020-2032
- 9.1. Market Analysis, Insights and Forecast - by Product Type
- 9.1.1. Carbon Fibers
- 9.1.2. Special Graphite
- 9.1.3. Carbon Nanotubes
- 9.1.4. Graphene
- 9.1.5. Carbon Foams (Includes Carbon Nanofoams)
- 9.1.6. Others (
- 9.2. Market Analysis, Insights and Forecast - by Application
- 9.2.1. Aerospace and Defence
- 9.2.2. Electronics
- 9.2.3. Sports
- 9.2.4. Automotive
- 9.2.5. Construction
- 9.2.6. Energy
- 9.2.7. Others
- 9.1. Market Analysis, Insights and Forecast - by Product Type
- 10. South America Advanced Carbon Products Industry Analysis, Insights and Forecast, 2020-2032
- 10.1. Market Analysis, Insights and Forecast - by Product Type
- 10.1.1. Carbon Fibers
- 10.1.2. Special Graphite
- 10.1.3. Carbon Nanotubes
- 10.1.4. Graphene
- 10.1.5. Carbon Foams (Includes Carbon Nanofoams)
- 10.1.6. Others (
- 10.2. Market Analysis, Insights and Forecast - by Application
- 10.2.1. Aerospace and Defence
- 10.2.2. Electronics
- 10.2.3. Sports
- 10.2.4. Automotive
- 10.2.5. Construction
- 10.2.6. Energy
- 10.2.7. Others
- 10.1. Market Analysis, Insights and Forecast - by Product Type
- 11. Middle East and Africa Advanced Carbon Products Industry Analysis, Insights and Forecast, 2020-2032
- 11.1. Market Analysis, Insights and Forecast - by Product Type
- 11.1.1. Carbon Fibers
- 11.1.2. Special Graphite
- 11.1.3. Carbon Nanotubes
- 11.1.4. Graphene
- 11.1.5. Carbon Foams (Includes Carbon Nanofoams)
- 11.1.6. Others (
- 11.2. Market Analysis, Insights and Forecast - by Application
- 11.2.1. Aerospace and Defence
- 11.2.2. Electronics
- 11.2.3. Sports
- 11.2.4. Automotive
- 11.2.5. Construction
- 11.2.6. Energy
- 11.2.7. Others
- 11.1. Market Analysis, Insights and Forecast - by Product Type
- 12. Competitive Analysis
- 12.1. Company Profiles
- 12.1.1 SGL Carbon
- 12.1.1.1. Company Overview
- 12.1.1.2. Products
- 12.1.1.3. Company Financials
- 12.1.1.4. SWOT Analysis
- 12.1.2 Jiangsu Cnano Technology Co Ltd
- 12.1.2.1. Company Overview
- 12.1.2.2. Products
- 12.1.2.3. Company Financials
- 12.1.2.4. SWOT Analysis
- 12.1.3 Haydale Graphene Industries plc
- 12.1.3.1. Company Overview
- 12.1.3.2. Products
- 12.1.3.3. Company Financials
- 12.1.3.4. SWOT Analysis
- 12.1.4 Arkema
- 12.1.4.1. Company Overview
- 12.1.4.2. Products
- 12.1.4.3. Company Financials
- 12.1.4.4. SWOT Analysis
- 12.1.5 Tokai Carbon Co Ltd
- 12.1.5.1. Company Overview
- 12.1.5.2. Products
- 12.1.5.3. Company Financials
- 12.1.5.4. SWOT Analysis
- 12.1.6 Solvay
- 12.1.6.1. Company Overview
- 12.1.6.2. Products
- 12.1.6.3. Company Financials
- 12.1.6.4. SWOT Analysis
- 12.1.7 Antolin
- 12.1.7.1. Company Overview
- 12.1.7.2. Products
- 12.1.7.3. Company Financials
- 12.1.7.4. SWOT Analysis
- 12.1.8 POCO
- 12.1.8.1. Company Overview
- 12.1.8.2. Products
- 12.1.8.3. Company Financials
- 12.1.8.4. SWOT Analysis
- 12.1.9 Perpetuus Advanced Materials PLC
- 12.1.9.1. Company Overview
- 12.1.9.2. Products
- 12.1.9.3. Company Financials
- 12.1.9.4. SWOT Analysis
- 12.1.10 FutureCarbon GmbH
- 12.1.10.1. Company Overview
- 12.1.10.2. Products
- 12.1.10.3. Company Financials
- 12.1.10.4. SWOT Analysis
- 12.1.11 Shenzhen Sanshun Nano New Materials Co Ltd
- 12.1.11.1. Company Overview
- 12.1.11.2. Products
- 12.1.11.3. Company Financials
- 12.1.11.4. SWOT Analysis
- 12.1.12 GrafTech International
- 12.1.12.1. Company Overview
- 12.1.12.2. Products
- 12.1.12.3. Company Financials
- 12.1.12.4. SWOT Analysis
- 12.1.13 Nanocyl SA
- 12.1.13.1. Company Overview
- 12.1.13.2. Products
- 12.1.13.3. Company Financials
- 12.1.13.4. SWOT Analysis
- 12.1.14 Grupo Graphenano
- 12.1.14.1. Company Overview
- 12.1.14.2. Products
- 12.1.14.3. Company Financials
- 12.1.14.4. SWOT Analysis
- 12.1.15 Graphenea Inc
- 12.1.15.1. Company Overview
- 12.1.15.2. Products
- 12.1.15.3. Company Financials
- 12.1.15.4. SWOT Analysis
- 12.1.16 Arry International Group Limited
- 12.1.16.1. Company Overview
- 12.1.16.2. Products
- 12.1.16.3. Company Financials
- 12.1.16.4. SWOT Analysis
- 12.1.17 Ningbo Morsh Technology
- 12.1.17.1. Company Overview
- 12.1.17.2. Products
- 12.1.17.3. Company Financials
- 12.1.17.4. SWOT Analysis
- 12.1.18 Hyperion Catalysis International
- 12.1.18.1. Company Overview
- 12.1.18.2. Products
- 12.1.18.3. Company Financials
- 12.1.18.4. SWOT Analysis
- 12.1.19 XG Sciences Inc
- 12.1.19.1. Company Overview
- 12.1.19.2. Products
- 12.1.19.3. Company Financials
- 12.1.19.4. SWOT Analysis
- 12.1.20 The Sixth Element (Changzhou) Materials Technology Co Ltd
- 12.1.20.1. Company Overview
- 12.1.20.2. Products
- 12.1.20.3. Company Financials
- 12.1.20.4. SWOT Analysis
- 12.1.21 Nano-C
- 12.1.21.1. Company Overview
- 12.1.21.2. Products
- 12.1.21.3. Company Financials
- 12.1.21.4. SWOT Analysis
- 12.1.22 Nippon Graphite Fiber Co Ltd
- 12.1.22.1. Company Overview
- 12.1.22.2. Products
- 12.1.22.3. Company Financials
- 12.1.22.4. SWOT Analysis
- 12.1.23 Global Graphene Group
- 12.1.23.1. Company Overview
- 12.1.23.2. Products
- 12.1.23.3. Company Financials
- 12.1.23.4. SWOT Analysis
- 12.1.24 Toyo Tanso Co Ltd
- 12.1.24.1. Company Overview
- 12.1.24.2. Products
- 12.1.24.3. Company Financials
- 12.1.24.4. SWOT Analysis
- 12.1.25 CFOAM LLC
- 12.1.25.1. Company Overview
- 12.1.25.2. Products
- 12.1.25.3. Company Financials
- 12.1.25.4. SWOT Analysis
- 12.1.26 TORAY INDUSTRIES INC
- 12.1.26.1. Company Overview
- 12.1.26.2. Products
- 12.1.26.3. Company Financials
- 12.1.26.4. SWOT Analysis
- 12.1.27 Mitsubishi Chemical Carbon Fiber and Composites Inc
- 12.1.27.1. Company Overview
- 12.1.27.2. Products
- 12.1.27.3. Company Financials
- 12.1.27.4. SWOT Analysis
- 12.1.28 Thomas Swan & Co Ltd
- 12.1.28.1. Company Overview
- 12.1.28.2. Products
- 12.1.28.3. Company Financials
- 12.1.28.4. SWOT Analysis
- 12.1.29 Hexcel Corporation
- 12.1.29.1. Company Overview
- 12.1.29.2. Products
- 12.1.29.3. Company Financials
- 12.1.29.4. SWOT Analysis
- 12.1.30 Formosa Plastics Corporation
- 12.1.30.1. Company Overview
- 12.1.30.2. Products
- 12.1.30.3. Company Financials
- 12.1.30.4. SWOT Analysis
- 12.1.31 TEIJIN LIMITED
- 12.1.31.1. Company Overview
- 12.1.31.2. Products
- 12.1.31.3. Company Financials
- 12.1.31.4. SWOT Analysis
- 12.1.32 Graphite India Limited
- 12.1.32.1. Company Overview
- 12.1.32.2. Products
- 12.1.32.3. Company Financials
- 12.1.32.4. SWOT Analysis
- 12.1.33 SHOWA DENKO K K
- 12.1.33.1. Company Overview
- 12.1.33.2. Products
- 12.1.33.3. Company Financials
- 12.1.33.4. SWOT Analysis
- 12.1.1 SGL Carbon
- 12.2. Market Entropy
- 12.2.1 Company's Key Areas Served
- 12.2.2 Recent Developments
- 12.3. Company Market Share Analysis 2025
- 12.3.1 Top 5 Companies Market Share Analysis
- 12.3.2 Top 3 Companies Market Share Analysis
- 12.4. List of Potential Customers
- 13. Research Methodology
List of Figures
- Figure 1: Global Advanced Carbon Products Industry Revenue Breakdown (Million, %) by Region 2025 & 2033
- Figure 2: Global Advanced Carbon Products Industry Volume Breakdown (K Tons, %) by Region 2025 & 2033
- Figure 3: Asia Pacific Advanced Carbon Products Industry Revenue (Million), by Product Type 2025 & 2033
- Figure 4: Asia Pacific Advanced Carbon Products Industry Volume (K Tons), by Product Type 2025 & 2033
- Figure 5: Asia Pacific Advanced Carbon Products Industry Revenue Share (%), by Product Type 2025 & 2033
- Figure 6: Asia Pacific Advanced Carbon Products Industry Volume Share (%), by Product Type 2025 & 2033
- Figure 7: Asia Pacific Advanced Carbon Products Industry Revenue (Million), by Application 2025 & 2033
- Figure 8: Asia Pacific Advanced Carbon Products Industry Volume (K Tons), by Application 2025 & 2033
- Figure 9: Asia Pacific Advanced Carbon Products Industry Revenue Share (%), by Application 2025 & 2033
- Figure 10: Asia Pacific Advanced Carbon Products Industry Volume Share (%), by Application 2025 & 2033
- Figure 11: Asia Pacific Advanced Carbon Products Industry Revenue (Million), by Country 2025 & 2033
- Figure 12: Asia Pacific Advanced Carbon Products Industry Volume (K Tons), by Country 2025 & 2033
- Figure 13: Asia Pacific Advanced Carbon Products Industry Revenue Share (%), by Country 2025 & 2033
- Figure 14: Asia Pacific Advanced Carbon Products Industry Volume Share (%), by Country 2025 & 2033
- Figure 15: North America Advanced Carbon Products Industry Revenue (Million), by Product Type 2025 & 2033
- Figure 16: North America Advanced Carbon Products Industry Volume (K Tons), by Product Type 2025 & 2033
- Figure 17: North America Advanced Carbon Products Industry Revenue Share (%), by Product Type 2025 & 2033
- Figure 18: North America Advanced Carbon Products Industry Volume Share (%), by Product Type 2025 & 2033
- Figure 19: North America Advanced Carbon Products Industry Revenue (Million), by Application 2025 & 2033
- Figure 20: North America Advanced Carbon Products Industry Volume (K Tons), by Application 2025 & 2033
- Figure 21: North America Advanced Carbon Products Industry Revenue Share (%), by Application 2025 & 2033
- Figure 22: North America Advanced Carbon Products Industry Volume Share (%), by Application 2025 & 2033
- Figure 23: North America Advanced Carbon Products Industry Revenue (Million), by Country 2025 & 2033
- Figure 24: North America Advanced Carbon Products Industry Volume (K Tons), by Country 2025 & 2033
- Figure 25: North America Advanced Carbon Products Industry Revenue Share (%), by Country 2025 & 2033
- Figure 26: North America Advanced Carbon Products Industry Volume Share (%), by Country 2025 & 2033
- Figure 27: Europe Advanced Carbon Products Industry Revenue (Million), by Product Type 2025 & 2033
- Figure 28: Europe Advanced Carbon Products Industry Volume (K Tons), by Product Type 2025 & 2033
- Figure 29: Europe Advanced Carbon Products Industry Revenue Share (%), by Product Type 2025 & 2033
- Figure 30: Europe Advanced Carbon Products Industry Volume Share (%), by Product Type 2025 & 2033
- Figure 31: Europe Advanced Carbon Products Industry Revenue (Million), by Application 2025 & 2033
- Figure 32: Europe Advanced Carbon Products Industry Volume (K Tons), by Application 2025 & 2033
- Figure 33: Europe Advanced Carbon Products Industry Revenue Share (%), by Application 2025 & 2033
- Figure 34: Europe Advanced Carbon Products Industry Volume Share (%), by Application 2025 & 2033
- Figure 35: Europe Advanced Carbon Products Industry Revenue (Million), by Country 2025 & 2033
- Figure 36: Europe Advanced Carbon Products Industry Volume (K Tons), by Country 2025 & 2033
- Figure 37: Europe Advanced Carbon Products Industry Revenue Share (%), by Country 2025 & 2033
- Figure 38: Europe Advanced Carbon Products Industry Volume Share (%), by Country 2025 & 2033
- Figure 39: South America Advanced Carbon Products Industry Revenue (Million), by Product Type 2025 & 2033
- Figure 40: South America Advanced Carbon Products Industry Volume (K Tons), by Product Type 2025 & 2033
- Figure 41: South America Advanced Carbon Products Industry Revenue Share (%), by Product Type 2025 & 2033
- Figure 42: South America Advanced Carbon Products Industry Volume Share (%), by Product Type 2025 & 2033
- Figure 43: South America Advanced Carbon Products Industry Revenue (Million), by Application 2025 & 2033
- Figure 44: South America Advanced Carbon Products Industry Volume (K Tons), by Application 2025 & 2033
- Figure 45: South America Advanced Carbon Products Industry Revenue Share (%), by Application 2025 & 2033
- Figure 46: South America Advanced Carbon Products Industry Volume Share (%), by Application 2025 & 2033
- Figure 47: South America Advanced Carbon Products Industry Revenue (Million), by Country 2025 & 2033
- Figure 48: South America Advanced Carbon Products Industry Volume (K Tons), by Country 2025 & 2033
- Figure 49: South America Advanced Carbon Products Industry Revenue Share (%), by Country 2025 & 2033
- Figure 50: South America Advanced Carbon Products Industry Volume Share (%), by Country 2025 & 2033
- Figure 51: Middle East and Africa Advanced Carbon Products Industry Revenue (Million), by Product Type 2025 & 2033
- Figure 52: Middle East and Africa Advanced Carbon Products Industry Volume (K Tons), by Product Type 2025 & 2033
- Figure 53: Middle East and Africa Advanced Carbon Products Industry Revenue Share (%), by Product Type 2025 & 2033
- Figure 54: Middle East and Africa Advanced Carbon Products Industry Volume Share (%), by Product Type 2025 & 2033
- Figure 55: Middle East and Africa Advanced Carbon Products Industry Revenue (Million), by Application 2025 & 2033
- Figure 56: Middle East and Africa Advanced Carbon Products Industry Volume (K Tons), by Application 2025 & 2033
- Figure 57: Middle East and Africa Advanced Carbon Products Industry Revenue Share (%), by Application 2025 & 2033
- Figure 58: Middle East and Africa Advanced Carbon Products Industry Volume Share (%), by Application 2025 & 2033
- Figure 59: Middle East and Africa Advanced Carbon Products Industry Revenue (Million), by Country 2025 & 2033
- Figure 60: Middle East and Africa Advanced Carbon Products Industry Volume (K Tons), by Country 2025 & 2033
- Figure 61: Middle East and Africa Advanced Carbon Products Industry Revenue Share (%), by Country 2025 & 2033
- Figure 62: Middle East and Africa Advanced Carbon Products Industry Volume Share (%), by Country 2025 & 2033
List of Tables
- Table 1: Global Advanced Carbon Products Industry Revenue Million Forecast, by Product Type 2020 & 2033
- Table 2: Global Advanced Carbon Products Industry Volume K Tons Forecast, by Product Type 2020 & 2033
- Table 3: Global Advanced Carbon Products Industry Revenue Million Forecast, by Application 2020 & 2033
- Table 4: Global Advanced Carbon Products Industry Volume K Tons Forecast, by Application 2020 & 2033
- Table 5: Global Advanced Carbon Products Industry Revenue Million Forecast, by Region 2020 & 2033
- Table 6: Global Advanced Carbon Products Industry Volume K Tons Forecast, by Region 2020 & 2033
- Table 7: Global Advanced Carbon Products Industry Revenue Million Forecast, by Product Type 2020 & 2033
- Table 8: Global Advanced Carbon Products Industry Volume K Tons Forecast, by Product Type 2020 & 2033
- Table 9: Global Advanced Carbon Products Industry Revenue Million Forecast, by Application 2020 & 2033
- Table 10: Global Advanced Carbon Products Industry Volume K Tons Forecast, by Application 2020 & 2033
- Table 11: Global Advanced Carbon Products Industry Revenue Million Forecast, by Country 2020 & 2033
- Table 12: Global Advanced Carbon Products Industry Volume K Tons Forecast, by Country 2020 & 2033
- Table 13: China Advanced Carbon Products Industry Revenue (Million) Forecast, by Application 2020 & 2033
- Table 14: China Advanced Carbon Products Industry Volume (K Tons) Forecast, by Application 2020 & 2033
- Table 15: India Advanced Carbon Products Industry Revenue (Million) Forecast, by Application 2020 & 2033
- Table 16: India Advanced Carbon Products Industry Volume (K Tons) Forecast, by Application 2020 & 2033
- Table 17: Japan Advanced Carbon Products Industry Revenue (Million) Forecast, by Application 2020 & 2033
- Table 18: Japan Advanced Carbon Products Industry Volume (K Tons) Forecast, by Application 2020 & 2033
- Table 19: South Korea Advanced Carbon Products Industry Revenue (Million) Forecast, by Application 2020 & 2033
- Table 20: South Korea Advanced Carbon Products Industry Volume (K Tons) Forecast, by Application 2020 & 2033
- Table 21: Rest of Asia Pacific Advanced Carbon Products Industry Revenue (Million) Forecast, by Application 2020 & 2033
- Table 22: Rest of Asia Pacific Advanced Carbon Products Industry Volume (K Tons) Forecast, by Application 2020 & 2033
- Table 23: Global Advanced Carbon Products Industry Revenue Million Forecast, by Product Type 2020 & 2033
- Table 24: Global Advanced Carbon Products Industry Volume K Tons Forecast, by Product Type 2020 & 2033
- Table 25: Global Advanced Carbon Products Industry Revenue Million Forecast, by Application 2020 & 2033
- Table 26: Global Advanced Carbon Products Industry Volume K Tons Forecast, by Application 2020 & 2033
- Table 27: Global Advanced Carbon Products Industry Revenue Million Forecast, by Country 2020 & 2033
- Table 28: Global Advanced Carbon Products Industry Volume K Tons Forecast, by Country 2020 & 2033
- Table 29: United States Advanced Carbon Products Industry Revenue (Million) Forecast, by Application 2020 & 2033
- Table 30: United States Advanced Carbon Products Industry Volume (K Tons) Forecast, by Application 2020 & 2033
- Table 31: Canada Advanced Carbon Products Industry Revenue (Million) Forecast, by Application 2020 & 2033
- Table 32: Canada Advanced Carbon Products Industry Volume (K Tons) Forecast, by Application 2020 & 2033
- Table 33: Mexico Advanced Carbon Products Industry Revenue (Million) Forecast, by Application 2020 & 2033
- Table 34: Mexico Advanced Carbon Products Industry Volume (K Tons) Forecast, by Application 2020 & 2033
- Table 35: Global Advanced Carbon Products Industry Revenue Million Forecast, by Product Type 2020 & 2033
- Table 36: Global Advanced Carbon Products Industry Volume K Tons Forecast, by Product Type 2020 & 2033
- Table 37: Global Advanced Carbon Products Industry Revenue Million Forecast, by Application 2020 & 2033
- Table 38: Global Advanced Carbon Products Industry Volume K Tons Forecast, by Application 2020 & 2033
- Table 39: Global Advanced Carbon Products Industry Revenue Million Forecast, by Country 2020 & 2033
- Table 40: Global Advanced Carbon Products Industry Volume K Tons Forecast, by Country 2020 & 2033
- Table 41: Germany Advanced Carbon Products Industry Revenue (Million) Forecast, by Application 2020 & 2033
- Table 42: Germany Advanced Carbon Products Industry Volume (K Tons) Forecast, by Application 2020 & 2033
- Table 43: United Kingdom Advanced Carbon Products Industry Revenue (Million) Forecast, by Application 2020 & 2033
- Table 44: United Kingdom Advanced Carbon Products Industry Volume (K Tons) Forecast, by Application 2020 & 2033
- Table 45: France Advanced Carbon Products Industry Revenue (Million) Forecast, by Application 2020 & 2033
- Table 46: France Advanced Carbon Products Industry Volume (K Tons) Forecast, by Application 2020 & 2033
- Table 47: Italy Advanced Carbon Products Industry Revenue (Million) Forecast, by Application 2020 & 2033
- Table 48: Italy Advanced Carbon Products Industry Volume (K Tons) Forecast, by Application 2020 & 2033
- Table 49: Spain Advanced Carbon Products Industry Revenue (Million) Forecast, by Application 2020 & 2033
- Table 50: Spain Advanced Carbon Products Industry Volume (K Tons) Forecast, by Application 2020 & 2033
- Table 51: Russia Advanced Carbon Products Industry Revenue (Million) Forecast, by Application 2020 & 2033
- Table 52: Russia Advanced Carbon Products Industry Volume (K Tons) Forecast, by Application 2020 & 2033
- Table 53: Rest of Europe Advanced Carbon Products Industry Revenue (Million) Forecast, by Application 2020 & 2033
- Table 54: Rest of Europe Advanced Carbon Products Industry Volume (K Tons) Forecast, by Application 2020 & 2033
- Table 55: Global Advanced Carbon Products Industry Revenue Million Forecast, by Product Type 2020 & 2033
- Table 56: Global Advanced Carbon Products Industry Volume K Tons Forecast, by Product Type 2020 & 2033
- Table 57: Global Advanced Carbon Products Industry Revenue Million Forecast, by Application 2020 & 2033
- Table 58: Global Advanced Carbon Products Industry Volume K Tons Forecast, by Application 2020 & 2033
- Table 59: Global Advanced Carbon Products Industry Revenue Million Forecast, by Country 2020 & 2033
- Table 60: Global Advanced Carbon Products Industry Volume K Tons Forecast, by Country 2020 & 2033
- Table 61: Brazil Advanced Carbon Products Industry Revenue (Million) Forecast, by Application 2020 & 2033
- Table 62: Brazil Advanced Carbon Products Industry Volume (K Tons) Forecast, by Application 2020 & 2033
- Table 63: Argentina Advanced Carbon Products Industry Revenue (Million) Forecast, by Application 2020 & 2033
- Table 64: Argentina Advanced Carbon Products Industry Volume (K Tons) Forecast, by Application 2020 & 2033
- Table 65: Rest of South America Advanced Carbon Products Industry Revenue (Million) Forecast, by Application 2020 & 2033
- Table 66: Rest of South America Advanced Carbon Products Industry Volume (K Tons) Forecast, by Application 2020 & 2033
- Table 67: Global Advanced Carbon Products Industry Revenue Million Forecast, by Product Type 2020 & 2033
- Table 68: Global Advanced Carbon Products Industry Volume K Tons Forecast, by Product Type 2020 & 2033
- Table 69: Global Advanced Carbon Products Industry Revenue Million Forecast, by Application 2020 & 2033
- Table 70: Global Advanced Carbon Products Industry Volume K Tons Forecast, by Application 2020 & 2033
- Table 71: Global Advanced Carbon Products Industry Revenue Million Forecast, by Country 2020 & 2033
- Table 72: Global Advanced Carbon Products Industry Volume K Tons Forecast, by Country 2020 & 2033
- Table 73: Saudi Arabia Advanced Carbon Products Industry Revenue (Million) Forecast, by Application 2020 & 2033
- Table 74: Saudi Arabia Advanced Carbon Products Industry Volume (K Tons) Forecast, by Application 2020 & 2033
- Table 75: United Arab Emirates Advanced Carbon Products Industry Revenue (Million) Forecast, by Application 2020 & 2033
- Table 76: United Arab Emirates Advanced Carbon Products Industry Volume (K Tons) Forecast, by Application 2020 & 2033
- Table 77: South Africa Advanced Carbon Products Industry Revenue (Million) Forecast, by Application 2020 & 2033
- Table 78: South Africa Advanced Carbon Products Industry Volume (K Tons) Forecast, by Application 2020 & 2033
- Table 79: Rest of Middle East and Africa Advanced Carbon Products Industry Revenue (Million) Forecast, by Application 2020 & 2033
- Table 80: Rest of Middle East and Africa Advanced Carbon Products Industry Volume (K Tons) Forecast, by Application 2020 & 2033
Frequently Asked Questions
1. What is the projected Compound Annual Growth Rate (CAGR) of the Advanced Carbon Products Industry?
The projected CAGR is approximately 9.82%.
2. Which companies are prominent players in the Advanced Carbon Products Industry?
Key companies in the market include SGL Carbon, Jiangsu Cnano Technology Co Ltd, Haydale Graphene Industries plc, Arkema, Tokai Carbon Co Ltd, Solvay, Antolin, POCO, Perpetuus Advanced Materials PLC, FutureCarbon GmbH, Shenzhen Sanshun Nano New Materials Co Ltd, GrafTech International, Nanocyl SA, Grupo Graphenano, Graphenea Inc, Arry International Group Limited, Ningbo Morsh Technology, Hyperion Catalysis International, XG Sciences Inc , The Sixth Element (Changzhou) Materials Technology Co Ltd, Nano-C, Nippon Graphite Fiber Co Ltd, Global Graphene Group, Toyo Tanso Co Ltd, CFOAM LLC, TORAY INDUSTRIES INC, Mitsubishi Chemical Carbon Fiber and Composites Inc, Thomas Swan & Co Ltd, Hexcel Corporation, Formosa Plastics Corporation, TEIJIN LIMITED, Graphite India Limited, SHOWA DENKO K K.
3. What are the main segments of the Advanced Carbon Products Industry?
The market segments include Product Type, Application.
4. Can you provide details about the market size?
The market size is estimated to be USD XX Million as of 2022.
5. What are some drivers contributing to market growth?
Rising Demand for Carbon Fiber Reinforced Plastic in the Construction Industry; Technological Advancements in Carbon Nanotubes; Other Drivers.
6. What are the notable trends driving market growth?
Aerospace and Defense to Dominate the Market.
7. Are there any restraints impacting market growth?
High-cost of Carbon Fiber Composites; Wastage in the Production of Finished Products; Other Restraints.
8. Can you provide examples of recent developments in the market?
N/A
9. What pricing options are available for accessing the report?
Pricing options include single-user, multi-user, and enterprise licenses priced at USD 4750, USD 5250, and USD 8750 respectively.
10. Is the market size provided in terms of value or volume?
The market size is provided in terms of value, measured in Million and volume, measured in K Tons.
11. Are there any specific market keywords associated with the report?
Yes, the market keyword associated with the report is "Advanced Carbon Products Industry," which aids in identifying and referencing the specific market segment covered.
12. How do I determine which pricing option suits my needs best?
The pricing options vary based on user requirements and access needs. Individual users may opt for single-user licenses, while businesses requiring broader access may choose multi-user or enterprise licenses for cost-effective access to the report.
13. Are there any additional resources or data provided in the Advanced Carbon Products Industry report?
While the report offers comprehensive insights, it's advisable to review the specific contents or supplementary materials provided to ascertain if additional resources or data are available.
14. How can I stay updated on further developments or reports in the Advanced Carbon Products Industry?
To stay informed about further developments, trends, and reports in the Advanced Carbon Products Industry, consider subscribing to industry newsletters, following relevant companies and organizations, or regularly checking reputable industry news sources and publications.
Methodology
Step 1 - Identification of Relevant Samples Size from Population Database


Step 2 - Approaches for Defining Global Market Size (Value, Volume* & Price*)

Note*: In applicable scenarios
Step 3 - Data Sources
Primary Research
- Web Analytics
- Survey Reports
- Research Institute
- Latest Research Reports
- Opinion Leaders
Secondary Research
- Annual Reports
- White Paper
- Latest Press Release
- Industry Association
- Paid Database
- Investor Presentations

Step 4 - Data Triangulation
Involves using different sources of information in order to increase the validity of a study
These sources are likely to be stakeholders in a program - participants, other researchers, program staff, other community members, and so on.
Then we put all data in single framework & apply various statistical tools to find out the dynamic on the market.
During the analysis stage, feedback from the stakeholder groups would be compared to determine areas of agreement as well as areas of divergence