

Key Insights
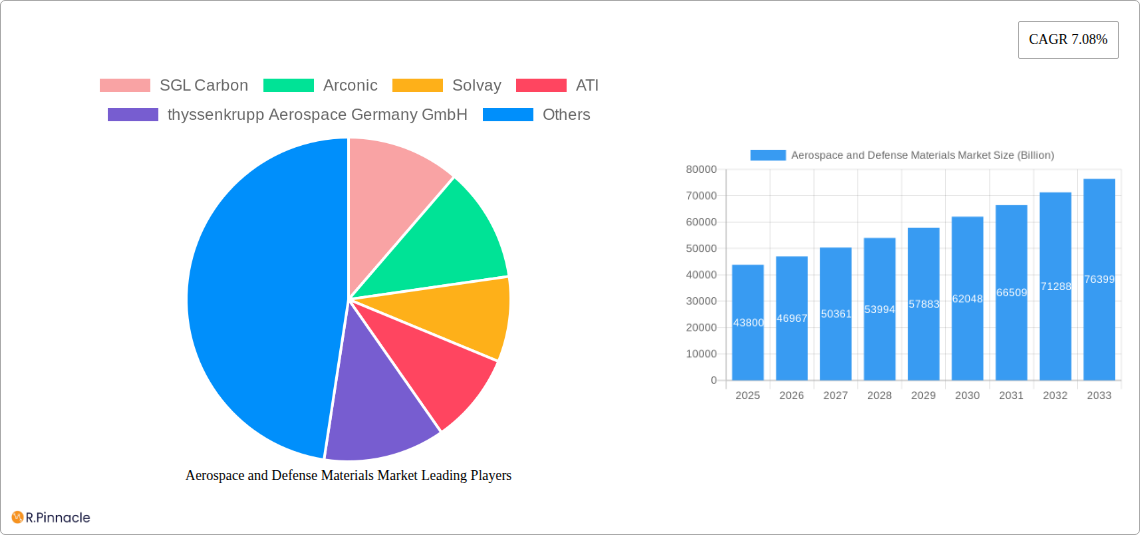
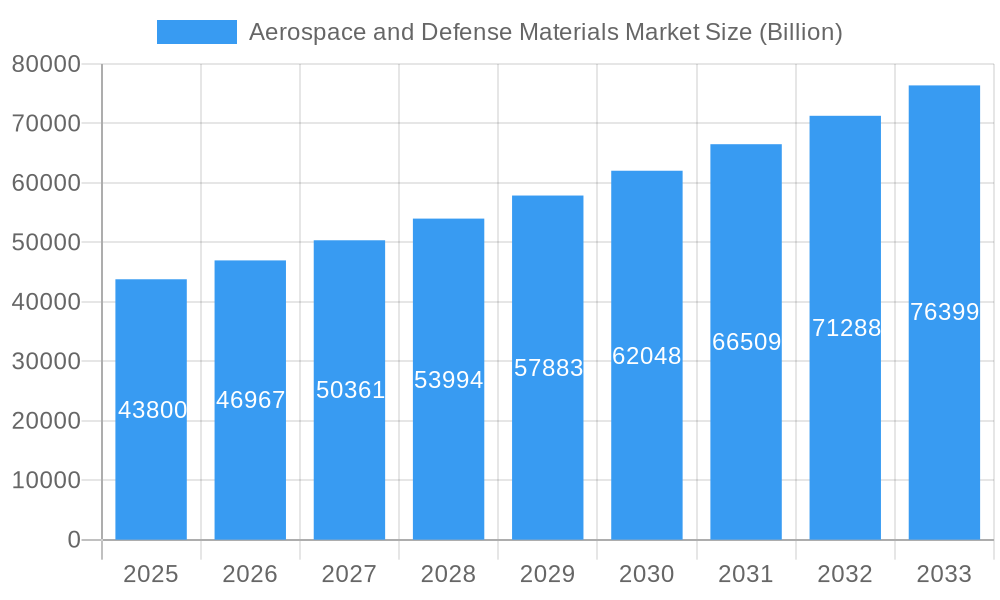
The Aerospace and Defense Materials market is experiencing robust growth, projected to reach a market size of $43.8 billion in 2025 and maintain a Compound Annual Growth Rate (CAGR) of 7.08% from 2025 to 2033. This expansion is fueled by several key factors. Firstly, the increasing demand for advanced aircraft, particularly in the commercial aviation sector, is driving the need for lightweight, high-strength materials such as aluminum alloys, titanium alloys, and composite materials. Secondly, the global rise in defense spending, particularly in regions like Asia-Pacific, is stimulating demand for specialized materials used in military aircraft and defense systems. Technological advancements in material science, leading to improved performance characteristics like enhanced durability, heat resistance, and fatigue strength, further contribute to market growth. The adoption of sustainable manufacturing practices and the increasing focus on reducing aircraft weight for fuel efficiency also contribute to the market's positive trajectory.
Aerospace and Defense Materials Market Market Size (In Billion)
However, certain challenges restrain market growth. High material costs, especially for advanced materials like titanium and superalloys, pose a significant barrier. Furthermore, stringent regulatory compliance and safety standards within the aerospace and defense industries necessitate rigorous testing and certification processes, adding to production costs and timelines. Supply chain disruptions and geopolitical instability can also impact material availability and pricing, presenting a further challenge to market expansion. The segment analysis reveals that aluminum alloys currently hold the largest market share due to their wide application in aircraft construction, while the composite materials segment is anticipated to exhibit the fastest growth owing to increasing demand for lightweight yet robust components. North America and Europe are currently major market players, but the Asia-Pacific region is predicted to showcase the most significant growth potential over the forecast period driven by increased domestic manufacturing and military modernization efforts.
Aerospace and Defense Materials Market Company Market Share
Aerospace and Defense Materials Market Report: 2019-2033
This comprehensive report provides a detailed analysis of the Aerospace and Defense Materials Market, offering actionable insights for industry professionals and strategic decision-makers. With a study period spanning 2019-2033, a base year of 2025, and a forecast period of 2025-2033, this report offers a thorough understanding of past performance, current market dynamics, and future growth projections. The market is expected to reach xx Billion by 2033, exhibiting a CAGR of xx% during the forecast period.
Aerospace and Defense Materials Market Market Structure & Innovation Trends
The Aerospace and Defense Materials market is characterized by a moderately concentrated structure, with several key players holding significant market share. The top ten companies—including SGL Carbon, Arconic, Solvay, ATI, thyssenkrupp Aerospace Germany GmbH, Teijin Carbon Europe GmbH, TORAY INDUSTRIES INC, Novelis Inc, Hexcel Corporation, Constellium, and Alcoa Corporation—collectively account for approximately xx% of the global market in 2025. Innovation is driven by the increasing demand for lightweight, high-strength materials, advancements in materials science, and stringent regulatory requirements for safety and sustainability. The market is witnessing significant M&A activity, with notable transactions such as Novelis Inc.'s acquisition of Aleris Corporation in April 2020 (valued at xx Billion) and Teijin Limited's acquisition of Renegade Materials Corporation in August 2019 (valued at xx Billion). These mergers and acquisitions are reshaping the competitive landscape, creating larger entities with enhanced capabilities and broader product portfolios. Regulatory frameworks, such as those related to environmental compliance and material safety, significantly impact market dynamics. Product substitutes, like advanced polymers and bio-based materials, are emerging but are still limited in their applications within the aerospace and defense sector. End-user demographics include both original equipment manufacturers (OEMs) and Tier 1 suppliers, with a geographic distribution heavily influenced by global defense spending and aerospace manufacturing hubs.
Aerospace and Defense Materials Market Market Dynamics & Trends
The Aerospace and Defense Materials market is experiencing robust growth, fueled by several key factors. The increasing demand for commercial aircraft, driven by rising air travel and global economic growth, is a primary driver. Furthermore, the continuous modernization and expansion of military fleets across various nations are stimulating significant demand. Technological disruptions, particularly in the field of additive manufacturing (3D printing) and advanced composites, are opening new avenues for material innovation and production efficiency. Consumer preferences, particularly amongst OEMs, are shifting toward lighter, stronger, and more fuel-efficient materials to improve aircraft performance and reduce operational costs. The competitive dynamics are characterized by intense rivalry among established players, along with the emergence of innovative start-ups. This competition is driving innovation, improving product quality, and creating opportunities for market consolidation through mergers and acquisitions. Market penetration of advanced materials such as carbon fiber composites continues to grow, driven by their superior strength-to-weight ratio compared to traditional aluminum alloys. The market is projected to reach xx Billion by 2033, representing a significant increase from the xx Billion estimated in 2025. This growth reflects the expanding use of advanced materials in both commercial and military aircraft, as well as ongoing advancements in material science and manufacturing technologies.
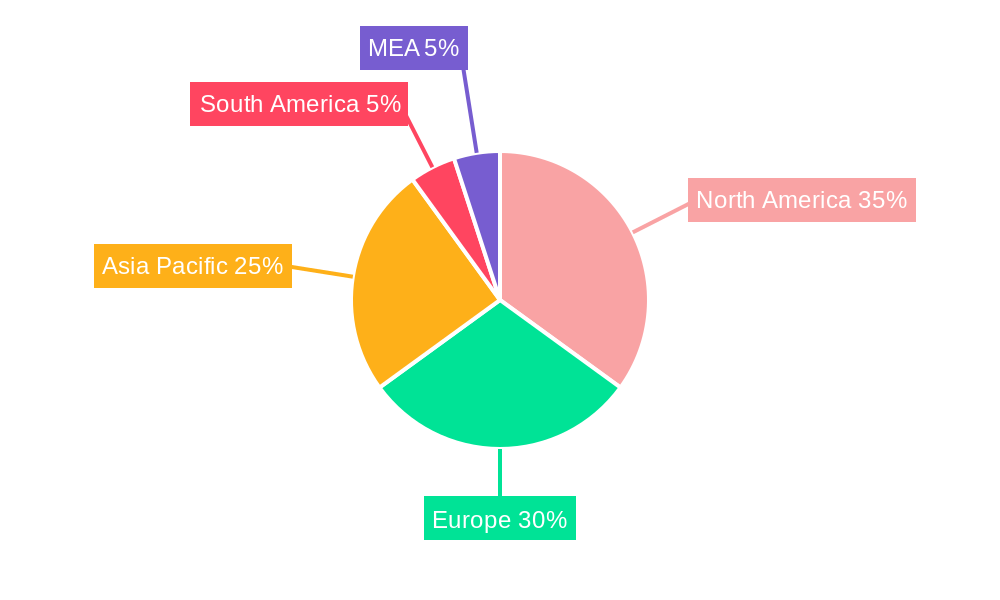
Dominant Regions & Segments in Aerospace and Defense Materials Market
Leading Region: North America currently holds the largest market share, driven by robust aerospace manufacturing and a strong defense sector.
Leading Country: The United States holds a significant share within North America, owing to the presence of major aerospace companies and high government spending on defense.
Dominant Material Type: Aluminum alloys remain the dominant material type, due to their cost-effectiveness, established manufacturing processes, and adequate performance characteristics. However, the market share of composite materials is experiencing rapid growth, owing to their superior strength-to-weight ratio and potential for improved fuel efficiency.
Dominant Aircraft Type: The commercial aircraft segment accounts for the largest share, reflecting the high volume of aircraft production and ongoing demand for air travel. However, the military segment exhibits strong growth due to the increasing investments in defense modernization programs globally.
Drivers for Dominance:
- North America: Strong aerospace manufacturing base, substantial defense budgets, technological advancements.
- United States: High R&D spending, presence of major OEMs, advanced manufacturing capabilities.
- Aluminum Alloys: Cost-effectiveness, mature manufacturing infrastructure, established supply chain.
- Commercial Aircraft: Growth in passenger air travel, increasing fleet modernization.
Aerospace and Defense Materials Market Product Innovations
Recent years have witnessed significant advancements in aerospace materials, including the development of high-strength, lightweight alloys, advanced composites with enhanced thermal stability, and innovative manufacturing processes such as additive manufacturing (3D printing). These innovations provide superior performance characteristics such as improved fatigue resistance, enhanced corrosion protection, and reduced weight, leading to increased fuel efficiency and lower operating costs. The market fit for these innovations is strong, driven by the increasing demand for high-performance materials in next-generation aircraft and defense systems. Companies are investing heavily in R&D to develop even more advanced materials that can meet the stringent requirements of the aerospace and defense industry.
Report Scope & Segmentation Analysis
The report comprehensively segments the Aerospace and Defense Materials market by material type (Aluminum Alloys, Steel Alloys, Titanium Alloys, Super Alloys, Composite Materials, Other Material Types) and aircraft type (Commercial, Military, Business and General Aviation, Other Aircraft Types). Each segment is analyzed individually, providing detailed insights into market size, growth projections, and competitive dynamics. For instance, the composite materials segment is expected to show the highest growth rate during the forecast period, while the aluminum alloys segment maintains the largest market share due to its established presence. Similarly, the commercial aircraft segment dominates by volume, while the military segment shows strong growth driven by increased defense budgets. The report also provides a detailed analysis of regional market dynamics, offering a comprehensive understanding of the global Aerospace and Defense Materials market.
Key Drivers of Aerospace and Defense Materials Market Growth
Several factors are driving the growth of the Aerospace and Defense Materials market. The increasing demand for air travel is a major catalyst for growth in the commercial aviation segment. Simultaneously, global defense spending, particularly in the modernization and expansion of military aircraft fleets, boosts the military segment's expansion. Technological advancements, such as the development of lightweight and high-strength materials, are also key drivers, enabling enhanced aircraft performance and fuel efficiency. Stricter environmental regulations also push the need for sustainable and eco-friendly materials, stimulating further innovation.
Challenges in the Aerospace and Defense Materials Market Sector
The Aerospace and Defense Materials market faces several challenges. Supply chain disruptions can significantly impact production timelines and increase material costs. Stringent regulatory compliance requirements necessitate significant investments in testing and certification, while intense competition among established and emerging players puts pressure on margins. Fluctuations in raw material prices and geopolitical uncertainties also add to the challenges faced by the market participants. These challenges collectively affect market stability and profitability.
Emerging Opportunities in Aerospace and Defense Materials Market
Several opportunities are emerging in the Aerospace and Defense Materials market. The adoption of additive manufacturing (3D printing) offers potential cost savings and improved design flexibility. The growing demand for sustainable and bio-based materials presents opportunities for environmentally conscious companies. Furthermore, expanding into new markets, particularly in developing economies with rapidly growing aviation sectors, presents substantial growth potential. These emerging trends offer significant potential for market expansion and diversification.
Leading Players in the Aerospace and Defense Materials Market Market
- SGL Carbon
- Arconic
- Solvay
- ATI
- thyssenkrupp Aerospace Germany GmbH
- Teijin Carbon Europe GmbH
- TORAY INDUSTRIES INC
- Novelis Inc
- Hexcel Corporation
- Constellium
- Alcoa Corporation
Key Developments in Aerospace and Defense Materials Market Industry
- April 2020: Novelis Inc. acquires Aleris Corporation.
- August 2019: Teijin Limited acquires Renegade Materials Corporation.
Future Outlook for Aerospace and Defense Materials Market Market
The Aerospace and Defense Materials market is poised for continued growth, driven by sustained demand for air travel, increasing defense budgets, and ongoing technological advancements. Strategic investments in R&D, partnerships to expand into new markets, and mergers and acquisitions will shape the competitive landscape. The focus on sustainability and the adoption of innovative materials will play a significant role in shaping the future trajectory of the market. The market is expected to show robust expansion throughout the forecast period, driven by several growth accelerators.
Aerospace and Defense Materials Market Segmentation
-
1. Material Type
- 1.1. Aluminum Alloys
- 1.2. Steel Alloys
- 1.3. Titanium Alloys
- 1.4. Super Alloys
- 1.5. Composite Materials
- 1.6. Other Material Types
-
2. Aircraft Type
- 2.1. Commercial
- 2.2. Military
- 2.3. Business and General Aviation
- 2.4. Other Aircraft Types
Aerospace and Defense Materials Market Segmentation By Geography
-
1. Asia Pacific
- 1.1. China
- 1.2. India
- 1.3. Japan
- 1.4. South Korea
- 1.5. Rest of Asia Pacific
-
2. North America
- 2.1. United States
- 2.2. Canada
- 2.3. Mexico
-
3. Europe
- 3.1. Germany
- 3.2. United Kingdom
- 3.3. Italy
- 3.4. France
- 3.5. Rest of Europe
-
4. South America
- 4.1. Brazil
- 4.2. Argentina
- 4.3. Rest of South America
-
5. Middle East and Africa
- 5.1. Saudi Arabia
- 5.2. South Africa
- 5.3. Rest of Middle East and Africa
Aerospace and Defense Materials Market Regional Market Share
Geographic Coverage of Aerospace and Defense Materials Market
Aerospace and Defense Materials Market REPORT HIGHLIGHTS
| Aspects | Details |
|---|---|
| Study Period | 2020-2034 |
| Base Year | 2025 |
| Estimated Year | 2026 |
| Forecast Period | 2026-2034 |
| Historical Period | 2020-2025 |
| Growth Rate | CAGR of 7.08% from 2020-2034 |
| Segmentation |
|
Table of Contents
- 1. Introduction
- 1.1. Research Scope
- 1.2. Market Segmentation
- 1.3. Research Objective
- 1.4. Definitions and Assumptions
- 2. Executive Summary
- 2.1. Market Snapshot
- 3. Market Dynamics
- 3.1. Market Drivers
- 3.2. Market Restrains
- 3.3. Market Trends
- 3.4. Market Opportunities
- 4. Market Factor Analysis
- 4.1. Porters Five Forces
- 4.1.1. Bargaining Power of Suppliers
- 4.1.2. Bargaining Power of Buyers
- 4.1.3. Threat of New Entrants
- 4.1.4. Threat of Substitutes
- 4.1.5. Competitive Rivalry
- 4.2. PESTEL analysis
- 4.3. BCG Analysis
- 4.3.1. Stars (High Growth, High Market Share)
- 4.3.2. Cash Cows (Low Growth, High Market Share)
- 4.3.3. Question Mark (High Growth, Low Market Share)
- 4.3.4. Dogs (Low Growth, Low Market Share)
- 4.4. Ansoff Matrix Analysis
- 4.5. Supply Chain Analysis
- 4.6. Regulatory Landscape
- 4.7. Current Market Potential and Opportunity Assessment (TAM–SAM–SOM Framework)
- 4.8. PRI Analyst Note
- 4.1. Porters Five Forces
- 5. Market Analysis, Insights and Forecast 2021-2033
- 5.1. Market Analysis, Insights and Forecast - by Material Type
- 5.1.1. Aluminum Alloys
- 5.1.2. Steel Alloys
- 5.1.3. Titanium Alloys
- 5.1.4. Super Alloys
- 5.1.5. Composite Materials
- 5.1.6. Other Material Types
- 5.2. Market Analysis, Insights and Forecast - by Aircraft Type
- 5.2.1. Commercial
- 5.2.2. Military
- 5.2.3. Business and General Aviation
- 5.2.4. Other Aircraft Types
- 5.3. Market Analysis, Insights and Forecast - by Region
- 5.3.1. Asia Pacific
- 5.3.2. North America
- 5.3.3. Europe
- 5.3.4. South America
- 5.3.5. Middle East and Africa
- 5.1. Market Analysis, Insights and Forecast - by Material Type
- 6. Global Aerospace and Defense Materials Market Analysis, Insights and Forecast, 2021-2033
- 6.1. Market Analysis, Insights and Forecast - by Material Type
- 6.1.1. Aluminum Alloys
- 6.1.2. Steel Alloys
- 6.1.3. Titanium Alloys
- 6.1.4. Super Alloys
- 6.1.5. Composite Materials
- 6.1.6. Other Material Types
- 6.2. Market Analysis, Insights and Forecast - by Aircraft Type
- 6.2.1. Commercial
- 6.2.2. Military
- 6.2.3. Business and General Aviation
- 6.2.4. Other Aircraft Types
- 6.1. Market Analysis, Insights and Forecast - by Material Type
- 7. Asia Pacific Aerospace and Defense Materials Market Analysis, Insights and Forecast, 2020-2032
- 7.1. Market Analysis, Insights and Forecast - by Material Type
- 7.1.1. Aluminum Alloys
- 7.1.2. Steel Alloys
- 7.1.3. Titanium Alloys
- 7.1.4. Super Alloys
- 7.1.5. Composite Materials
- 7.1.6. Other Material Types
- 7.2. Market Analysis, Insights and Forecast - by Aircraft Type
- 7.2.1. Commercial
- 7.2.2. Military
- 7.2.3. Business and General Aviation
- 7.2.4. Other Aircraft Types
- 7.1. Market Analysis, Insights and Forecast - by Material Type
- 8. North America Aerospace and Defense Materials Market Analysis, Insights and Forecast, 2020-2032
- 8.1. Market Analysis, Insights and Forecast - by Material Type
- 8.1.1. Aluminum Alloys
- 8.1.2. Steel Alloys
- 8.1.3. Titanium Alloys
- 8.1.4. Super Alloys
- 8.1.5. Composite Materials
- 8.1.6. Other Material Types
- 8.2. Market Analysis, Insights and Forecast - by Aircraft Type
- 8.2.1. Commercial
- 8.2.2. Military
- 8.2.3. Business and General Aviation
- 8.2.4. Other Aircraft Types
- 8.1. Market Analysis, Insights and Forecast - by Material Type
- 9. Europe Aerospace and Defense Materials Market Analysis, Insights and Forecast, 2020-2032
- 9.1. Market Analysis, Insights and Forecast - by Material Type
- 9.1.1. Aluminum Alloys
- 9.1.2. Steel Alloys
- 9.1.3. Titanium Alloys
- 9.1.4. Super Alloys
- 9.1.5. Composite Materials
- 9.1.6. Other Material Types
- 9.2. Market Analysis, Insights and Forecast - by Aircraft Type
- 9.2.1. Commercial
- 9.2.2. Military
- 9.2.3. Business and General Aviation
- 9.2.4. Other Aircraft Types
- 9.1. Market Analysis, Insights and Forecast - by Material Type
- 10. South America Aerospace and Defense Materials Market Analysis, Insights and Forecast, 2020-2032
- 10.1. Market Analysis, Insights and Forecast - by Material Type
- 10.1.1. Aluminum Alloys
- 10.1.2. Steel Alloys
- 10.1.3. Titanium Alloys
- 10.1.4. Super Alloys
- 10.1.5. Composite Materials
- 10.1.6. Other Material Types
- 10.2. Market Analysis, Insights and Forecast - by Aircraft Type
- 10.2.1. Commercial
- 10.2.2. Military
- 10.2.3. Business and General Aviation
- 10.2.4. Other Aircraft Types
- 10.1. Market Analysis, Insights and Forecast - by Material Type
- 11. Middle East and Africa Aerospace and Defense Materials Market Analysis, Insights and Forecast, 2020-2032
- 11.1. Market Analysis, Insights and Forecast - by Material Type
- 11.1.1. Aluminum Alloys
- 11.1.2. Steel Alloys
- 11.1.3. Titanium Alloys
- 11.1.4. Super Alloys
- 11.1.5. Composite Materials
- 11.1.6. Other Material Types
- 11.2. Market Analysis, Insights and Forecast - by Aircraft Type
- 11.2.1. Commercial
- 11.2.2. Military
- 11.2.3. Business and General Aviation
- 11.2.4. Other Aircraft Types
- 11.1. Market Analysis, Insights and Forecast - by Material Type
- 12. Competitive Analysis
- 12.1. Company Profiles
- 12.1.1 SGL Carbon
- 12.1.1.1. Company Overview
- 12.1.1.2. Products
- 12.1.1.3. Company Financials
- 12.1.1.4. SWOT Analysis
- 12.1.2 Arconic
- 12.1.2.1. Company Overview
- 12.1.2.2. Products
- 12.1.2.3. Company Financials
- 12.1.2.4. SWOT Analysis
- 12.1.3 Solvay
- 12.1.3.1. Company Overview
- 12.1.3.2. Products
- 12.1.3.3. Company Financials
- 12.1.3.4. SWOT Analysis
- 12.1.4 ATI
- 12.1.4.1. Company Overview
- 12.1.4.2. Products
- 12.1.4.3. Company Financials
- 12.1.4.4. SWOT Analysis
- 12.1.5 thyssenkrupp Aerospace Germany GmbH
- 12.1.5.1. Company Overview
- 12.1.5.2. Products
- 12.1.5.3. Company Financials
- 12.1.5.4. SWOT Analysis
- 12.1.6 Teijin Carbon Europe GmbH
- 12.1.6.1. Company Overview
- 12.1.6.2. Products
- 12.1.6.3. Company Financials
- 12.1.6.4. SWOT Analysis
- 12.1.7 TORAY INDUSTRIES INC
- 12.1.7.1. Company Overview
- 12.1.7.2. Products
- 12.1.7.3. Company Financials
- 12.1.7.4. SWOT Analysis
- 12.1.8 Novelis Inc
- 12.1.8.1. Company Overview
- 12.1.8.2. Products
- 12.1.8.3. Company Financials
- 12.1.8.4. SWOT Analysis
- 12.1.9 Hexcel Corporation
- 12.1.9.1. Company Overview
- 12.1.9.2. Products
- 12.1.9.3. Company Financials
- 12.1.9.4. SWOT Analysis
- 12.1.10 Constellium
- 12.1.10.1. Company Overview
- 12.1.10.2. Products
- 12.1.10.3. Company Financials
- 12.1.10.4. SWOT Analysis
- 12.1.11 Alcoa Corporation
- 12.1.11.1. Company Overview
- 12.1.11.2. Products
- 12.1.11.3. Company Financials
- 12.1.11.4. SWOT Analysis
- 12.1.1 SGL Carbon
- 12.2. Market Entropy
- 12.2.1 Company's Key Areas Served
- 12.2.2 Recent Developments
- 12.3. Company Market Share Analysis 2025
- 12.3.1 Top 5 Companies Market Share Analysis
- 12.3.2 Top 3 Companies Market Share Analysis
- 12.4. List of Potential Customers
- 13. Research Methodology
List of Figures
- Figure 1: Global Aerospace and Defense Materials Market Revenue Breakdown (Billion, %) by Region 2025 & 2033
- Figure 2: Global Aerospace and Defense Materials Market Volume Breakdown (K Tons, %) by Region 2025 & 2033
- Figure 3: Asia Pacific Aerospace and Defense Materials Market Revenue (Billion), by Material Type 2025 & 2033
- Figure 4: Asia Pacific Aerospace and Defense Materials Market Volume (K Tons), by Material Type 2025 & 2033
- Figure 5: Asia Pacific Aerospace and Defense Materials Market Revenue Share (%), by Material Type 2025 & 2033
- Figure 6: Asia Pacific Aerospace and Defense Materials Market Volume Share (%), by Material Type 2025 & 2033
- Figure 7: Asia Pacific Aerospace and Defense Materials Market Revenue (Billion), by Aircraft Type 2025 & 2033
- Figure 8: Asia Pacific Aerospace and Defense Materials Market Volume (K Tons), by Aircraft Type 2025 & 2033
- Figure 9: Asia Pacific Aerospace and Defense Materials Market Revenue Share (%), by Aircraft Type 2025 & 2033
- Figure 10: Asia Pacific Aerospace and Defense Materials Market Volume Share (%), by Aircraft Type 2025 & 2033
- Figure 11: Asia Pacific Aerospace and Defense Materials Market Revenue (Billion), by Country 2025 & 2033
- Figure 12: Asia Pacific Aerospace and Defense Materials Market Volume (K Tons), by Country 2025 & 2033
- Figure 13: Asia Pacific Aerospace and Defense Materials Market Revenue Share (%), by Country 2025 & 2033
- Figure 14: Asia Pacific Aerospace and Defense Materials Market Volume Share (%), by Country 2025 & 2033
- Figure 15: North America Aerospace and Defense Materials Market Revenue (Billion), by Material Type 2025 & 2033
- Figure 16: North America Aerospace and Defense Materials Market Volume (K Tons), by Material Type 2025 & 2033
- Figure 17: North America Aerospace and Defense Materials Market Revenue Share (%), by Material Type 2025 & 2033
- Figure 18: North America Aerospace and Defense Materials Market Volume Share (%), by Material Type 2025 & 2033
- Figure 19: North America Aerospace and Defense Materials Market Revenue (Billion), by Aircraft Type 2025 & 2033
- Figure 20: North America Aerospace and Defense Materials Market Volume (K Tons), by Aircraft Type 2025 & 2033
- Figure 21: North America Aerospace and Defense Materials Market Revenue Share (%), by Aircraft Type 2025 & 2033
- Figure 22: North America Aerospace and Defense Materials Market Volume Share (%), by Aircraft Type 2025 & 2033
- Figure 23: North America Aerospace and Defense Materials Market Revenue (Billion), by Country 2025 & 2033
- Figure 24: North America Aerospace and Defense Materials Market Volume (K Tons), by Country 2025 & 2033
- Figure 25: North America Aerospace and Defense Materials Market Revenue Share (%), by Country 2025 & 2033
- Figure 26: North America Aerospace and Defense Materials Market Volume Share (%), by Country 2025 & 2033
- Figure 27: Europe Aerospace and Defense Materials Market Revenue (Billion), by Material Type 2025 & 2033
- Figure 28: Europe Aerospace and Defense Materials Market Volume (K Tons), by Material Type 2025 & 2033
- Figure 29: Europe Aerospace and Defense Materials Market Revenue Share (%), by Material Type 2025 & 2033
- Figure 30: Europe Aerospace and Defense Materials Market Volume Share (%), by Material Type 2025 & 2033
- Figure 31: Europe Aerospace and Defense Materials Market Revenue (Billion), by Aircraft Type 2025 & 2033
- Figure 32: Europe Aerospace and Defense Materials Market Volume (K Tons), by Aircraft Type 2025 & 2033
- Figure 33: Europe Aerospace and Defense Materials Market Revenue Share (%), by Aircraft Type 2025 & 2033
- Figure 34: Europe Aerospace and Defense Materials Market Volume Share (%), by Aircraft Type 2025 & 2033
- Figure 35: Europe Aerospace and Defense Materials Market Revenue (Billion), by Country 2025 & 2033
- Figure 36: Europe Aerospace and Defense Materials Market Volume (K Tons), by Country 2025 & 2033
- Figure 37: Europe Aerospace and Defense Materials Market Revenue Share (%), by Country 2025 & 2033
- Figure 38: Europe Aerospace and Defense Materials Market Volume Share (%), by Country 2025 & 2033
- Figure 39: South America Aerospace and Defense Materials Market Revenue (Billion), by Material Type 2025 & 2033
- Figure 40: South America Aerospace and Defense Materials Market Volume (K Tons), by Material Type 2025 & 2033
- Figure 41: South America Aerospace and Defense Materials Market Revenue Share (%), by Material Type 2025 & 2033
- Figure 42: South America Aerospace and Defense Materials Market Volume Share (%), by Material Type 2025 & 2033
- Figure 43: South America Aerospace and Defense Materials Market Revenue (Billion), by Aircraft Type 2025 & 2033
- Figure 44: South America Aerospace and Defense Materials Market Volume (K Tons), by Aircraft Type 2025 & 2033
- Figure 45: South America Aerospace and Defense Materials Market Revenue Share (%), by Aircraft Type 2025 & 2033
- Figure 46: South America Aerospace and Defense Materials Market Volume Share (%), by Aircraft Type 2025 & 2033
- Figure 47: South America Aerospace and Defense Materials Market Revenue (Billion), by Country 2025 & 2033
- Figure 48: South America Aerospace and Defense Materials Market Volume (K Tons), by Country 2025 & 2033
- Figure 49: South America Aerospace and Defense Materials Market Revenue Share (%), by Country 2025 & 2033
- Figure 50: South America Aerospace and Defense Materials Market Volume Share (%), by Country 2025 & 2033
- Figure 51: Middle East and Africa Aerospace and Defense Materials Market Revenue (Billion), by Material Type 2025 & 2033
- Figure 52: Middle East and Africa Aerospace and Defense Materials Market Volume (K Tons), by Material Type 2025 & 2033
- Figure 53: Middle East and Africa Aerospace and Defense Materials Market Revenue Share (%), by Material Type 2025 & 2033
- Figure 54: Middle East and Africa Aerospace and Defense Materials Market Volume Share (%), by Material Type 2025 & 2033
- Figure 55: Middle East and Africa Aerospace and Defense Materials Market Revenue (Billion), by Aircraft Type 2025 & 2033
- Figure 56: Middle East and Africa Aerospace and Defense Materials Market Volume (K Tons), by Aircraft Type 2025 & 2033
- Figure 57: Middle East and Africa Aerospace and Defense Materials Market Revenue Share (%), by Aircraft Type 2025 & 2033
- Figure 58: Middle East and Africa Aerospace and Defense Materials Market Volume Share (%), by Aircraft Type 2025 & 2033
- Figure 59: Middle East and Africa Aerospace and Defense Materials Market Revenue (Billion), by Country 2025 & 2033
- Figure 60: Middle East and Africa Aerospace and Defense Materials Market Volume (K Tons), by Country 2025 & 2033
- Figure 61: Middle East and Africa Aerospace and Defense Materials Market Revenue Share (%), by Country 2025 & 2033
- Figure 62: Middle East and Africa Aerospace and Defense Materials Market Volume Share (%), by Country 2025 & 2033
List of Tables
- Table 1: Global Aerospace and Defense Materials Market Revenue Billion Forecast, by Material Type 2020 & 2033
- Table 2: Global Aerospace and Defense Materials Market Volume K Tons Forecast, by Material Type 2020 & 2033
- Table 3: Global Aerospace and Defense Materials Market Revenue Billion Forecast, by Aircraft Type 2020 & 2033
- Table 4: Global Aerospace and Defense Materials Market Volume K Tons Forecast, by Aircraft Type 2020 & 2033
- Table 5: Global Aerospace and Defense Materials Market Revenue Billion Forecast, by Region 2020 & 2033
- Table 6: Global Aerospace and Defense Materials Market Volume K Tons Forecast, by Region 2020 & 2033
- Table 7: Global Aerospace and Defense Materials Market Revenue Billion Forecast, by Material Type 2020 & 2033
- Table 8: Global Aerospace and Defense Materials Market Volume K Tons Forecast, by Material Type 2020 & 2033
- Table 9: Global Aerospace and Defense Materials Market Revenue Billion Forecast, by Aircraft Type 2020 & 2033
- Table 10: Global Aerospace and Defense Materials Market Volume K Tons Forecast, by Aircraft Type 2020 & 2033
- Table 11: Global Aerospace and Defense Materials Market Revenue Billion Forecast, by Country 2020 & 2033
- Table 12: Global Aerospace and Defense Materials Market Volume K Tons Forecast, by Country 2020 & 2033
- Table 13: China Aerospace and Defense Materials Market Revenue (Billion) Forecast, by Application 2020 & 2033
- Table 14: China Aerospace and Defense Materials Market Volume (K Tons) Forecast, by Application 2020 & 2033
- Table 15: India Aerospace and Defense Materials Market Revenue (Billion) Forecast, by Application 2020 & 2033
- Table 16: India Aerospace and Defense Materials Market Volume (K Tons) Forecast, by Application 2020 & 2033
- Table 17: Japan Aerospace and Defense Materials Market Revenue (Billion) Forecast, by Application 2020 & 2033
- Table 18: Japan Aerospace and Defense Materials Market Volume (K Tons) Forecast, by Application 2020 & 2033
- Table 19: South Korea Aerospace and Defense Materials Market Revenue (Billion) Forecast, by Application 2020 & 2033
- Table 20: South Korea Aerospace and Defense Materials Market Volume (K Tons) Forecast, by Application 2020 & 2033
- Table 21: Rest of Asia Pacific Aerospace and Defense Materials Market Revenue (Billion) Forecast, by Application 2020 & 2033
- Table 22: Rest of Asia Pacific Aerospace and Defense Materials Market Volume (K Tons) Forecast, by Application 2020 & 2033
- Table 23: Global Aerospace and Defense Materials Market Revenue Billion Forecast, by Material Type 2020 & 2033
- Table 24: Global Aerospace and Defense Materials Market Volume K Tons Forecast, by Material Type 2020 & 2033
- Table 25: Global Aerospace and Defense Materials Market Revenue Billion Forecast, by Aircraft Type 2020 & 2033
- Table 26: Global Aerospace and Defense Materials Market Volume K Tons Forecast, by Aircraft Type 2020 & 2033
- Table 27: Global Aerospace and Defense Materials Market Revenue Billion Forecast, by Country 2020 & 2033
- Table 28: Global Aerospace and Defense Materials Market Volume K Tons Forecast, by Country 2020 & 2033
- Table 29: United States Aerospace and Defense Materials Market Revenue (Billion) Forecast, by Application 2020 & 2033
- Table 30: United States Aerospace and Defense Materials Market Volume (K Tons) Forecast, by Application 2020 & 2033
- Table 31: Canada Aerospace and Defense Materials Market Revenue (Billion) Forecast, by Application 2020 & 2033
- Table 32: Canada Aerospace and Defense Materials Market Volume (K Tons) Forecast, by Application 2020 & 2033
- Table 33: Mexico Aerospace and Defense Materials Market Revenue (Billion) Forecast, by Application 2020 & 2033
- Table 34: Mexico Aerospace and Defense Materials Market Volume (K Tons) Forecast, by Application 2020 & 2033
- Table 35: Global Aerospace and Defense Materials Market Revenue Billion Forecast, by Material Type 2020 & 2033
- Table 36: Global Aerospace and Defense Materials Market Volume K Tons Forecast, by Material Type 2020 & 2033
- Table 37: Global Aerospace and Defense Materials Market Revenue Billion Forecast, by Aircraft Type 2020 & 2033
- Table 38: Global Aerospace and Defense Materials Market Volume K Tons Forecast, by Aircraft Type 2020 & 2033
- Table 39: Global Aerospace and Defense Materials Market Revenue Billion Forecast, by Country 2020 & 2033
- Table 40: Global Aerospace and Defense Materials Market Volume K Tons Forecast, by Country 2020 & 2033
- Table 41: Germany Aerospace and Defense Materials Market Revenue (Billion) Forecast, by Application 2020 & 2033
- Table 42: Germany Aerospace and Defense Materials Market Volume (K Tons) Forecast, by Application 2020 & 2033
- Table 43: United Kingdom Aerospace and Defense Materials Market Revenue (Billion) Forecast, by Application 2020 & 2033
- Table 44: United Kingdom Aerospace and Defense Materials Market Volume (K Tons) Forecast, by Application 2020 & 2033
- Table 45: Italy Aerospace and Defense Materials Market Revenue (Billion) Forecast, by Application 2020 & 2033
- Table 46: Italy Aerospace and Defense Materials Market Volume (K Tons) Forecast, by Application 2020 & 2033
- Table 47: France Aerospace and Defense Materials Market Revenue (Billion) Forecast, by Application 2020 & 2033
- Table 48: France Aerospace and Defense Materials Market Volume (K Tons) Forecast, by Application 2020 & 2033
- Table 49: Rest of Europe Aerospace and Defense Materials Market Revenue (Billion) Forecast, by Application 2020 & 2033
- Table 50: Rest of Europe Aerospace and Defense Materials Market Volume (K Tons) Forecast, by Application 2020 & 2033
- Table 51: Global Aerospace and Defense Materials Market Revenue Billion Forecast, by Material Type 2020 & 2033
- Table 52: Global Aerospace and Defense Materials Market Volume K Tons Forecast, by Material Type 2020 & 2033
- Table 53: Global Aerospace and Defense Materials Market Revenue Billion Forecast, by Aircraft Type 2020 & 2033
- Table 54: Global Aerospace and Defense Materials Market Volume K Tons Forecast, by Aircraft Type 2020 & 2033
- Table 55: Global Aerospace and Defense Materials Market Revenue Billion Forecast, by Country 2020 & 2033
- Table 56: Global Aerospace and Defense Materials Market Volume K Tons Forecast, by Country 2020 & 2033
- Table 57: Brazil Aerospace and Defense Materials Market Revenue (Billion) Forecast, by Application 2020 & 2033
- Table 58: Brazil Aerospace and Defense Materials Market Volume (K Tons) Forecast, by Application 2020 & 2033
- Table 59: Argentina Aerospace and Defense Materials Market Revenue (Billion) Forecast, by Application 2020 & 2033
- Table 60: Argentina Aerospace and Defense Materials Market Volume (K Tons) Forecast, by Application 2020 & 2033
- Table 61: Rest of South America Aerospace and Defense Materials Market Revenue (Billion) Forecast, by Application 2020 & 2033
- Table 62: Rest of South America Aerospace and Defense Materials Market Volume (K Tons) Forecast, by Application 2020 & 2033
- Table 63: Global Aerospace and Defense Materials Market Revenue Billion Forecast, by Material Type 2020 & 2033
- Table 64: Global Aerospace and Defense Materials Market Volume K Tons Forecast, by Material Type 2020 & 2033
- Table 65: Global Aerospace and Defense Materials Market Revenue Billion Forecast, by Aircraft Type 2020 & 2033
- Table 66: Global Aerospace and Defense Materials Market Volume K Tons Forecast, by Aircraft Type 2020 & 2033
- Table 67: Global Aerospace and Defense Materials Market Revenue Billion Forecast, by Country 2020 & 2033
- Table 68: Global Aerospace and Defense Materials Market Volume K Tons Forecast, by Country 2020 & 2033
- Table 69: Saudi Arabia Aerospace and Defense Materials Market Revenue (Billion) Forecast, by Application 2020 & 2033
- Table 70: Saudi Arabia Aerospace and Defense Materials Market Volume (K Tons) Forecast, by Application 2020 & 2033
- Table 71: South Africa Aerospace and Defense Materials Market Revenue (Billion) Forecast, by Application 2020 & 2033
- Table 72: South Africa Aerospace and Defense Materials Market Volume (K Tons) Forecast, by Application 2020 & 2033
- Table 73: Rest of Middle East and Africa Aerospace and Defense Materials Market Revenue (Billion) Forecast, by Application 2020 & 2033
- Table 74: Rest of Middle East and Africa Aerospace and Defense Materials Market Volume (K Tons) Forecast, by Application 2020 & 2033
Frequently Asked Questions
1. What is the projected Compound Annual Growth Rate (CAGR) of the Aerospace and Defense Materials Market?
The projected CAGR is approximately 7.08%.
2. Which companies are prominent players in the Aerospace and Defense Materials Market?
Key companies in the market include SGL Carbon, Arconic, Solvay, ATI, thyssenkrupp Aerospace Germany GmbH, Teijin Carbon Europe GmbH, TORAY INDUSTRIES INC, Novelis Inc, Hexcel Corporation, Constellium, Alcoa Corporation.
3. What are the main segments of the Aerospace and Defense Materials Market?
The market segments include Material Type, Aircraft Type.
4. Can you provide details about the market size?
The market size is estimated to be USD 43.8 Billion as of 2022.
5. What are some drivers contributing to market growth?
Increasing Demand for Aircraft in Asia-Pacific and the Middle East; Other Drivers.
6. What are the notable trends driving market growth?
Increasing Demand for the Commercial Aircraft Segment.
7. Are there any restraints impacting market growth?
Unfavorable Conditions Arising Due to the COVID-19 Outbreak; Other Restraints.
8. Can you provide examples of recent developments in the market?
In April 2020, Novelis Inc., the world leader in aluminum rolling and recycling, announced the completion of its acquisition of Aleris Corporation, a global supplier of rolled aluminum products.
9. What pricing options are available for accessing the report?
Pricing options include single-user, multi-user, and enterprise licenses priced at USD 4750, USD 5250, and USD 8750 respectively.
10. Is the market size provided in terms of value or volume?
The market size is provided in terms of value, measured in Billion and volume, measured in K Tons.
11. Are there any specific market keywords associated with the report?
Yes, the market keyword associated with the report is "Aerospace and Defense Materials Market," which aids in identifying and referencing the specific market segment covered.
12. How do I determine which pricing option suits my needs best?
The pricing options vary based on user requirements and access needs. Individual users may opt for single-user licenses, while businesses requiring broader access may choose multi-user or enterprise licenses for cost-effective access to the report.
13. Are there any additional resources or data provided in the Aerospace and Defense Materials Market report?
While the report offers comprehensive insights, it's advisable to review the specific contents or supplementary materials provided to ascertain if additional resources or data are available.
14. How can I stay updated on further developments or reports in the Aerospace and Defense Materials Market?
To stay informed about further developments, trends, and reports in the Aerospace and Defense Materials Market, consider subscribing to industry newsletters, following relevant companies and organizations, or regularly checking reputable industry news sources and publications.
Methodology
Step 1 - Identification of Relevant Samples Size from Population Database


Step 2 - Approaches for Defining Global Market Size (Value, Volume* & Price*)

Note*: In applicable scenarios
Step 3 - Data Sources
Primary Research
- Web Analytics
- Survey Reports
- Research Institute
- Latest Research Reports
- Opinion Leaders
Secondary Research
- Annual Reports
- White Paper
- Latest Press Release
- Industry Association
- Paid Database
- Investor Presentations

Step 4 - Data Triangulation
Involves using different sources of information in order to increase the validity of a study
These sources are likely to be stakeholders in a program - participants, other researchers, program staff, other community members, and so on.
Then we put all data in single framework & apply various statistical tools to find out the dynamic on the market.
During the analysis stage, feedback from the stakeholder groups would be compared to determine areas of agreement as well as areas of divergence