

Key Insights
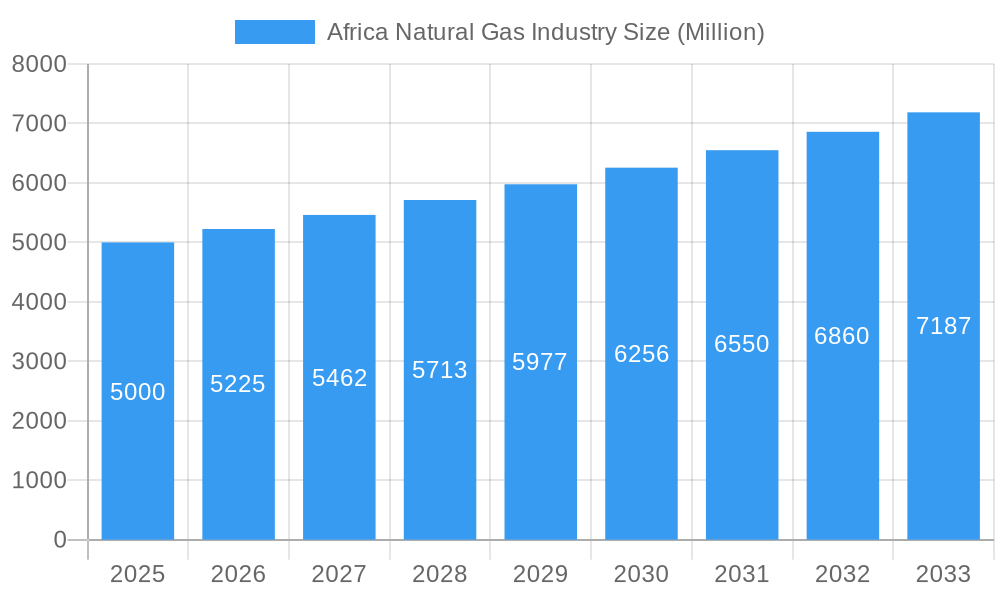
The African natural gas industry is experiencing robust growth, projected to maintain a Compound Annual Growth Rate (CAGR) exceeding 4.5% from 2025 to 2033. This expansion is fueled by several key drivers. Increasing power generation demands across the continent, particularly in rapidly developing nations, are significantly boosting natural gas consumption. Simultaneously, the industrial sector's growing reliance on natural gas for various processes contributes to heightened demand. Furthermore, a shift towards cleaner energy sources and a decline in reliance on traditional fuels like biomass is favoring natural gas adoption in the residential sector, though this segment remains relatively smaller compared to power generation and industrial applications. Significant investments in infrastructure development, including pipelines and processing facilities, are further facilitating market growth. South Africa, Sudan, Uganda, Tanzania, and Kenya represent key regional markets, showing substantial potential for future growth. However, challenges remain. Political instability in certain regions, insufficient investment in some areas, and the ongoing global energy transition (with the potential for increased focus on renewables) pose potential restraints. Competition from alternative energy sources and the need for consistent regulatory frameworks will play a significant role in shaping the market's trajectory. Major players like TotalEnergies SE, Shell PLC, and Eni SpA are strategically positioning themselves to capitalize on this burgeoning market, focusing on exploration, production, and distribution infrastructure. The diverse landscape of company sizes – encompassing large multinationals and smaller, local players – indicates a dynamic and competitive market environment.
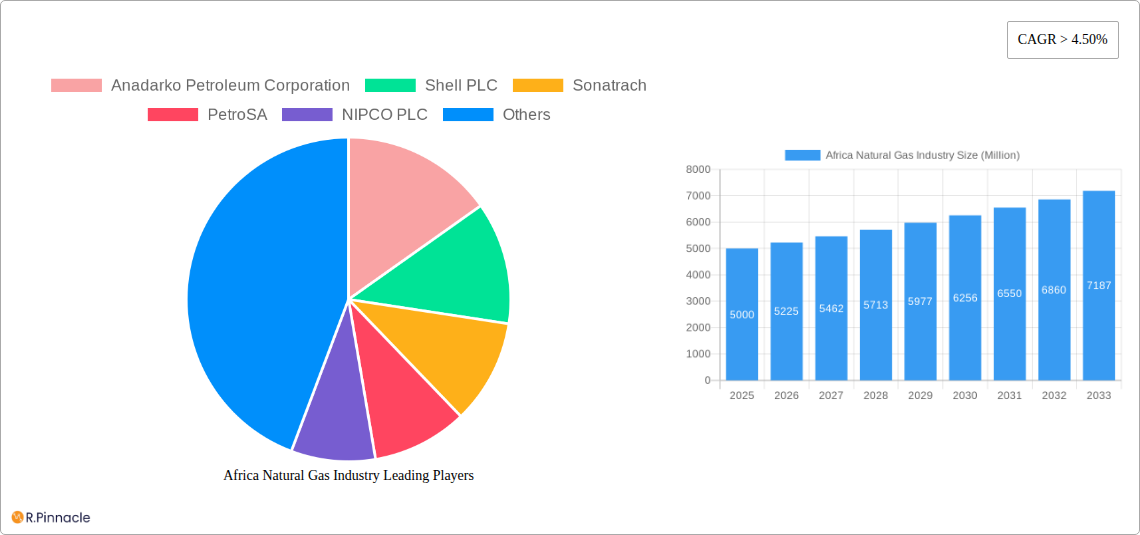
Africa Natural Gas Industry Market Size (In Billion)
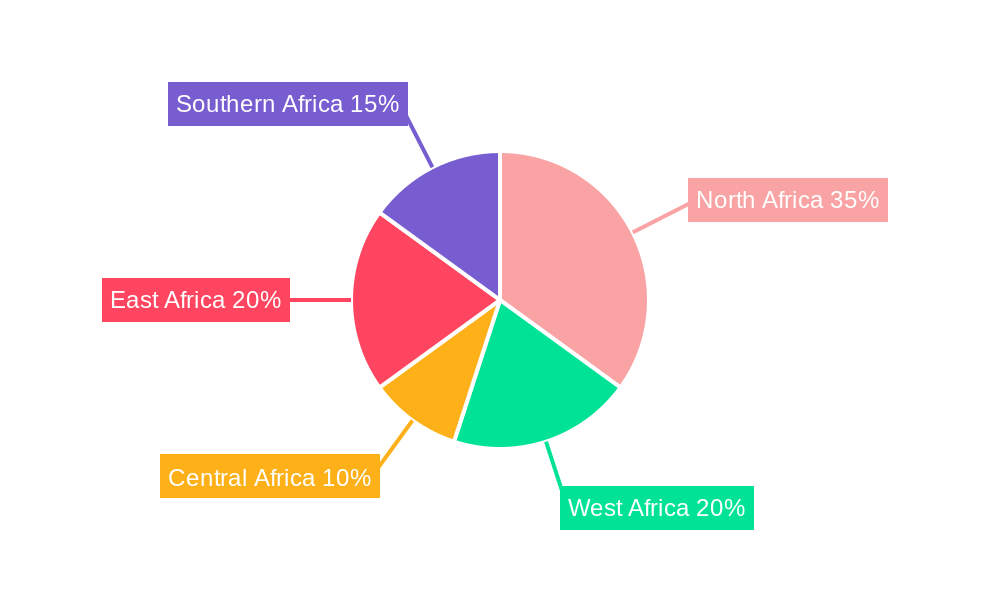
The segmentation of the African natural gas market highlights the importance of geographic diversity. North Africa, with its established infrastructure and proximity to European markets, currently dominates, however, significant growth potential exists in sub-Saharan Africa, particularly East and Southern Africa. This necessitates further investment in exploration, development and distribution within these regions to effectively meet the growing energy demands and contribute to broader economic development. The end-user segmentation clarifies the market's reliance on energy-intensive sectors such as power generation and industry, while growth in the residential sector will depend heavily on infrastructure expansion and affordability. Market size estimations require consideration of these diverse factors, with regional variations likely to persist throughout the forecast period. While precise figures for the market size in 2025 are unavailable from the provided data, a logical estimate based on the CAGR and identified growth drivers points to a substantial market value in the billions of dollars (assuming a 2025 market size in millions and applying the provided CAGR).
Africa Natural Gas Industry Company Market Share
This comprehensive report provides an in-depth analysis of the Africa natural gas industry, covering market structure, dynamics, key players, and future outlook. The study period spans 2019-2033, with a base year of 2025 and a forecast period of 2025-2033. This report is essential for industry professionals, investors, and policymakers seeking to understand the complexities and opportunities within this dynamic market. The report leverages extensive data analysis to provide actionable insights and projections.
Africa Natural Gas Industry Market Structure & Innovation Trends
This section analyzes the competitive landscape of the African natural gas market, encompassing market concentration, innovation drivers, regulatory frameworks, product substitutes, end-user demographics, and M&A activities.
The market is characterized by a mix of large multinational corporations and national oil companies. Market share is highly dynamic, with major players like Shell PLC and TotalEnergies SE holding significant positions, but facing competition from national entities such as Sonatrach and the Nigerian National Petroleum Corporation. M&A activity has been moderate in recent years, with deal values ranging from xx Million to xx Million.
- Market Concentration: Moderately concentrated, with a few dominant players and numerous smaller companies.
- Innovation Drivers: Growing demand for energy, government initiatives promoting gas development, and technological advancements in exploration and production.
- Regulatory Frameworks: Vary significantly across African nations, impacting investment and development.
- Product Substitutes: Renewable energy sources pose a growing competitive threat, though natural gas remains a crucial transitional fuel.
- End-User Demographics: Power generation is the largest end-user segment, followed by industrial and residential sectors. The residential sector exhibits significant growth potential.
- M&A Activity: Consolidation is expected, driven by the need for capital investment and operational efficiencies.
Africa Natural Gas Industry Market Dynamics & Trends
This section delves into the key factors influencing the growth and evolution of the African natural gas market. The market is projected to experience a CAGR of xx% during the forecast period (2025-2033), driven by robust demand, rising domestic consumption and growing exports.
Technological advancements in exploration and extraction techniques, coupled with improving infrastructure, are accelerating growth. Consumer preferences are shifting towards cleaner energy sources, presenting both challenges and opportunities for natural gas. Intense competition among existing and emerging players is shaping the market landscape.
The market penetration of natural gas in various sectors is on the rise, with particular focus on industrial and power generation sectors. However, challenges related to infrastructure development and regulatory frameworks continue to impede widespread adoption in certain regions.
Dominant Regions & Segments in Africa Natural Gas Industry
North Africa currently dominates the African natural gas market, driven by abundant reserves and established infrastructure. However, West Africa demonstrates strong growth potential due to significant discoveries and ongoing infrastructure development.
Leading Regions:
- North Africa: High reserves, established infrastructure, and strong export markets.
- West Africa: Significant exploration and production activities, with large untapped reserves.
- Other Regions: Lagging behind in development due to factors such as political instability and limited infrastructure.
Leading Segments:
- Power Generation: Largest consumer of natural gas, driven by increasing electricity demand.
- Industrial: Significant consumption in manufacturing and other industrial applications.
- Residential: Growing segment, albeit with varying penetration rates across different regions.
- Company Size: Large companies dominate the upstream sector, while medium and small companies are more prevalent in downstream activities.
Key Drivers: Abundant reserves, government incentives, and investments in infrastructure.
Africa Natural Gas Industry Product Innovations
Significant technological advancements have revolutionized natural gas exploration, production, and utilization. Innovations include improved drilling techniques for enhanced gas recovery, advanced pipeline technologies for efficient transportation, and the development of liquefied natural gas (LNG) to enable efficient transportation to global markets. These innovations are improving efficiency, reducing costs, and expanding market access.
Report Scope & Segmentation Analysis
This report provides a detailed analysis of the African natural gas market, segmented by geography (North Africa, West Africa, Central Africa, East Africa, Southern Africa), end-user (power generation, industrial, residential), and company size (large, medium, small). Each segment's market size, growth projections, and competitive landscape are thoroughly examined, providing a comprehensive view of the market's structure and dynamics.
Key Drivers of Africa Natural Gas Industry Growth
Several factors contribute to the growth of the African natural gas industry, including increasing energy demand across the continent; significant undiscovered reserves, especially in sub-Saharan Africa; government support for gas development and infrastructure projects; and the increasing focus on gas as a cleaner transitional fuel source. The implementation of the African Continental Free Trade Area (AfCFTA) also presents considerable opportunities for cross-border gas trade and investment.
Challenges in the Africa Natural Gas Industry Sector
The African natural gas industry faces challenges, including limited infrastructure in several regions, hindering efficient exploration, production, and distribution; significant investment requirements for infrastructure development and upgrading; security concerns in some regions, potentially disrupting operations; and regulatory inconsistencies across different countries. The impact of these challenges can be substantial, affecting production levels and overall industry growth.
Emerging Opportunities in Africa Natural Gas Industry
Significant growth opportunities exist in the African natural gas industry. These include expanding access to natural gas in underserved regions by improving infrastructure; exploration and development of newly discovered gas reserves; development of new downstream applications including the use of natural gas as a feedstock for chemicals and fertilizers; and increased investment in LNG production and export facilities to enhance the competitiveness of African natural gas in global markets.
Leading Players in the Africa Natural Gas Industry Market
- Anadarko Petroleum Corporation
- Shell PLC
- Sonatrach
- PetroSA
- NIPCO PLC
- TotalEnergies SE
- Egyptian Natural Gas Holding Company
- Eni SpA
- Nigerian National Petroleum Corporation
- Chevron Corporation
Key Developments in Africa Natural Gas Industry Industry
- September 2022: The Nigerian National Petroleum Company Limited (NNPCL) announced an MoU for the 7,000-kilometre Nigeria-Morocco gas pipeline project, aiming to supply 3 billion standard cubic feet of gas to Europe.
- May 2022: Sonatrach and Eni signed an MoU to accelerate the development of Algerian gas fields, projecting an annual export of approximately 3 billion cubic meters of gas via the Transmed pipeline.
Future Outlook for Africa Natural Gas Industry Market
The African natural gas industry is poised for significant growth over the next decade, driven by substantial reserves, increasing energy demand, and government support. Strategic investments in infrastructure development, exploration, and technological advancements will further accelerate growth, solidifying the role of natural gas as a crucial energy source and engine for economic development across the continent. The industry's future hinges on addressing challenges related to infrastructure, security, and regulatory frameworks.
Africa Natural Gas Industry Segmentation
-
1. Geography
- 1.1. Nigeria
- 1.2. Algeria
- 1.3. Egypt
- 1.4. South Africa
- 1.5. Rest of Africa
Africa Natural Gas Industry Segmentation By Geography
- 1. Nigeria
- 2. Algeria
- 3. Egypt
- 4. South Africa
- 5. Rest of Africa
Africa Natural Gas Industry Regional Market Share
Geographic Coverage of Africa Natural Gas Industry
Africa Natural Gas Industry REPORT HIGHLIGHTS
| Aspects | Details |
|---|---|
| Study Period | 2020-2034 |
| Base Year | 2025 |
| Estimated Year | 2026 |
| Forecast Period | 2026-2034 |
| Historical Period | 2020-2025 |
| Growth Rate | CAGR of > 4.50% from 2020-2034 |
| Segmentation |
|
Table of Contents
- 1. Introduction
- 1.1. Research Scope
- 1.2. Market Segmentation
- 1.3. Research Objective
- 1.4. Definitions and Assumptions
- 2. Executive Summary
- 2.1. Market Snapshot
- 3. Market Dynamics
- 3.1. Market Drivers
- 3.2. Market Restrains
- 3.3. Market Trends
- 3.4. Market Opportunities
- 4. Market Factor Analysis
- 4.1. Porters Five Forces
- 4.1.1. Bargaining Power of Suppliers
- 4.1.2. Bargaining Power of Buyers
- 4.1.3. Threat of New Entrants
- 4.1.4. Threat of Substitutes
- 4.1.5. Competitive Rivalry
- 4.2. PESTEL analysis
- 4.3. BCG Analysis
- 4.3.1. Stars (High Growth, High Market Share)
- 4.3.2. Cash Cows (Low Growth, High Market Share)
- 4.3.3. Question Mark (High Growth, Low Market Share)
- 4.3.4. Dogs (Low Growth, Low Market Share)
- 4.4. Ansoff Matrix Analysis
- 4.5. Supply Chain Analysis
- 4.6. Regulatory Landscape
- 4.7. Current Market Potential and Opportunity Assessment (TAM–SAM–SOM Framework)
- 4.8. PRI Analyst Note
- 4.1. Porters Five Forces
- 5. Market Analysis, Insights and Forecast 2021-2033
- 5.1. Market Analysis, Insights and Forecast - by Geography
- 5.1.1. Nigeria
- 5.1.2. Algeria
- 5.1.3. Egypt
- 5.1.4. South Africa
- 5.1.5. Rest of Africa
- 5.2. Market Analysis, Insights and Forecast - by Region
- 5.2.1. Nigeria
- 5.2.2. Algeria
- 5.2.3. Egypt
- 5.2.4. South Africa
- 5.2.5. Rest of Africa
- 5.1. Market Analysis, Insights and Forecast - by Geography
- 6. Africa Natural Gas Industry Analysis, Insights and Forecast, 2021-2033
- 6.1. Market Analysis, Insights and Forecast - by Geography
- 6.1.1. Nigeria
- 6.1.2. Algeria
- 6.1.3. Egypt
- 6.1.4. South Africa
- 6.1.5. Rest of Africa
- 6.1. Market Analysis, Insights and Forecast - by Geography
- 7. Nigeria Africa Natural Gas Industry Analysis, Insights and Forecast, 2020-2032
- 7.1. Market Analysis, Insights and Forecast - by Geography
- 7.1.1. Nigeria
- 7.1.2. Algeria
- 7.1.3. Egypt
- 7.1.4. South Africa
- 7.1.5. Rest of Africa
- 7.1. Market Analysis, Insights and Forecast - by Geography
- 8. Algeria Africa Natural Gas Industry Analysis, Insights and Forecast, 2020-2032
- 8.1. Market Analysis, Insights and Forecast - by Geography
- 8.1.1. Nigeria
- 8.1.2. Algeria
- 8.1.3. Egypt
- 8.1.4. South Africa
- 8.1.5. Rest of Africa
- 8.1. Market Analysis, Insights and Forecast - by Geography
- 9. Egypt Africa Natural Gas Industry Analysis, Insights and Forecast, 2020-2032
- 9.1. Market Analysis, Insights and Forecast - by Geography
- 9.1.1. Nigeria
- 9.1.2. Algeria
- 9.1.3. Egypt
- 9.1.4. South Africa
- 9.1.5. Rest of Africa
- 9.1. Market Analysis, Insights and Forecast - by Geography
- 10. South Africa Africa Natural Gas Industry Analysis, Insights and Forecast, 2020-2032
- 10.1. Market Analysis, Insights and Forecast - by Geography
- 10.1.1. Nigeria
- 10.1.2. Algeria
- 10.1.3. Egypt
- 10.1.4. South Africa
- 10.1.5. Rest of Africa
- 10.1. Market Analysis, Insights and Forecast - by Geography
- 11. Rest of Africa Africa Natural Gas Industry Analysis, Insights and Forecast, 2020-2032
- 11.1. Market Analysis, Insights and Forecast - by Geography
- 11.1.1. Nigeria
- 11.1.2. Algeria
- 11.1.3. Egypt
- 11.1.4. South Africa
- 11.1.5. Rest of Africa
- 11.1. Market Analysis, Insights and Forecast - by Geography
- 12. Competitive Analysis
- 12.1. Company Profiles
- 12.1.1 Anadarko Petroleum Corporation
- 12.1.1.1. Company Overview
- 12.1.1.2. Products
- 12.1.1.3. Company Financials
- 12.1.1.4. SWOT Analysis
- 12.1.2 Shell PLC
- 12.1.2.1. Company Overview
- 12.1.2.2. Products
- 12.1.2.3. Company Financials
- 12.1.2.4. SWOT Analysis
- 12.1.3 Sonatrach
- 12.1.3.1. Company Overview
- 12.1.3.2. Products
- 12.1.3.3. Company Financials
- 12.1.3.4. SWOT Analysis
- 12.1.4 PetroSA
- 12.1.4.1. Company Overview
- 12.1.4.2. Products
- 12.1.4.3. Company Financials
- 12.1.4.4. SWOT Analysis
- 12.1.5 NIPCO PLC
- 12.1.5.1. Company Overview
- 12.1.5.2. Products
- 12.1.5.3. Company Financials
- 12.1.5.4. SWOT Analysis
- 12.1.6 TotalEnergies SE
- 12.1.6.1. Company Overview
- 12.1.6.2. Products
- 12.1.6.3. Company Financials
- 12.1.6.4. SWOT Analysis
- 12.1.7 Egyptian Natural Gas Holding Company
- 12.1.7.1. Company Overview
- 12.1.7.2. Products
- 12.1.7.3. Company Financials
- 12.1.7.4. SWOT Analysis
- 12.1.8 Eni SpA
- 12.1.8.1. Company Overview
- 12.1.8.2. Products
- 12.1.8.3. Company Financials
- 12.1.8.4. SWOT Analysis
- 12.1.9 Nigerian National Petroleum Corporation
- 12.1.9.1. Company Overview
- 12.1.9.2. Products
- 12.1.9.3. Company Financials
- 12.1.9.4. SWOT Analysis
- 12.1.10 Chevron Corporation
- 12.1.10.1. Company Overview
- 12.1.10.2. Products
- 12.1.10.3. Company Financials
- 12.1.10.4. SWOT Analysis
- 12.1.1 Anadarko Petroleum Corporation
- 12.2. Market Entropy
- 12.2.1 Company's Key Areas Served
- 12.2.2 Recent Developments
- 12.3. Company Market Share Analysis 2025
- 12.3.1 Top 5 Companies Market Share Analysis
- 12.3.2 Top 3 Companies Market Share Analysis
- 12.4. List of Potential Customers
- 13. Research Methodology
List of Figures
- Figure 1: Africa Natural Gas Industry Revenue Breakdown (Million, %) by Product 2025 & 2033
- Figure 2: Africa Natural Gas Industry Share (%) by Company 2025
List of Tables
- Table 1: Africa Natural Gas Industry Revenue Million Forecast, by Geography 2020 & 2033
- Table 2: Africa Natural Gas Industry Volume Tonnes Forecast, by Geography 2020 & 2033
- Table 3: Africa Natural Gas Industry Revenue Million Forecast, by Region 2020 & 2033
- Table 4: Africa Natural Gas Industry Volume Tonnes Forecast, by Region 2020 & 2033
- Table 5: Africa Natural Gas Industry Revenue Million Forecast, by Geography 2020 & 2033
- Table 6: Africa Natural Gas Industry Volume Tonnes Forecast, by Geography 2020 & 2033
- Table 7: Africa Natural Gas Industry Revenue Million Forecast, by Country 2020 & 2033
- Table 8: Africa Natural Gas Industry Volume Tonnes Forecast, by Country 2020 & 2033
- Table 9: Africa Natural Gas Industry Revenue Million Forecast, by Geography 2020 & 2033
- Table 10: Africa Natural Gas Industry Volume Tonnes Forecast, by Geography 2020 & 2033
- Table 11: Africa Natural Gas Industry Revenue Million Forecast, by Country 2020 & 2033
- Table 12: Africa Natural Gas Industry Volume Tonnes Forecast, by Country 2020 & 2033
- Table 13: Africa Natural Gas Industry Revenue Million Forecast, by Geography 2020 & 2033
- Table 14: Africa Natural Gas Industry Volume Tonnes Forecast, by Geography 2020 & 2033
- Table 15: Africa Natural Gas Industry Revenue Million Forecast, by Country 2020 & 2033
- Table 16: Africa Natural Gas Industry Volume Tonnes Forecast, by Country 2020 & 2033
- Table 17: Africa Natural Gas Industry Revenue Million Forecast, by Geography 2020 & 2033
- Table 18: Africa Natural Gas Industry Volume Tonnes Forecast, by Geography 2020 & 2033
- Table 19: Africa Natural Gas Industry Revenue Million Forecast, by Country 2020 & 2033
- Table 20: Africa Natural Gas Industry Volume Tonnes Forecast, by Country 2020 & 2033
- Table 21: Africa Natural Gas Industry Revenue Million Forecast, by Geography 2020 & 2033
- Table 22: Africa Natural Gas Industry Volume Tonnes Forecast, by Geography 2020 & 2033
- Table 23: Africa Natural Gas Industry Revenue Million Forecast, by Country 2020 & 2033
- Table 24: Africa Natural Gas Industry Volume Tonnes Forecast, by Country 2020 & 2033
Frequently Asked Questions
1. What is the projected Compound Annual Growth Rate (CAGR) of the Africa Natural Gas Industry?
The projected CAGR is approximately > 4.50%.
2. Which companies are prominent players in the Africa Natural Gas Industry?
Key companies in the market include Anadarko Petroleum Corporation, Shell PLC, Sonatrach, PetroSA, NIPCO PLC, TotalEnergies SE, Egyptian Natural Gas Holding Company, Eni SpA, Nigerian National Petroleum Corporation, Chevron Corporation.
3. What are the main segments of the Africa Natural Gas Industry?
The market segments include Geography.
4. Can you provide details about the market size?
The market size is estimated to be USD XX Million as of 2022.
5. What are some drivers contributing to market growth?
4.; Increasing Amount of Waste Generation. Growing Concern for Waste Management to Meet the Needs for Sustainable Urban Living4.; Increasing Focus on Non-fossil Fuel Sources of Energy.
6. What are the notable trends driving market growth?
Governments Moving Towards the Cleaner Energy Sources is Driving the Market.
7. Are there any restraints impacting market growth?
4.; Expensive Nature of Incinerators.
8. Can you provide examples of recent developments in the market?
In September 2022, The Nigerian National Petroleum Company Limited (NNPCL) announced its intention to sign a Memorandum of Understanding (MoU) on developing a gas pipeline with Morocco's National Office of Hydrocarbons and Mines and the commission of the Economic Community of West African States (ECOWAS). As a result of the MoU, the 7,000-kilometre Nigeria-Morocco gas pipeline project is expected to ramp up gas supply to Europe. Upon the project completion, 3 billion standard cubic feet of gas is expected to be supplied along the coast of West Africa from Nigeria, Benin, Togo, Ghana, Cote d'Ivoire, Liberia, Sierra Leone, Guinea, Guinea Bissau, Gambia, Senegal, Mauritania to Morocco.
9. What pricing options are available for accessing the report?
Pricing options include single-user, multi-user, and enterprise licenses priced at USD 4750, USD 5250, and USD 8750 respectively.
10. Is the market size provided in terms of value or volume?
The market size is provided in terms of value, measured in Million and volume, measured in Tonnes.
11. Are there any specific market keywords associated with the report?
Yes, the market keyword associated with the report is "Africa Natural Gas Industry," which aids in identifying and referencing the specific market segment covered.
12. How do I determine which pricing option suits my needs best?
The pricing options vary based on user requirements and access needs. Individual users may opt for single-user licenses, while businesses requiring broader access may choose multi-user or enterprise licenses for cost-effective access to the report.
13. Are there any additional resources or data provided in the Africa Natural Gas Industry report?
While the report offers comprehensive insights, it's advisable to review the specific contents or supplementary materials provided to ascertain if additional resources or data are available.
14. How can I stay updated on further developments or reports in the Africa Natural Gas Industry?
To stay informed about further developments, trends, and reports in the Africa Natural Gas Industry, consider subscribing to industry newsletters, following relevant companies and organizations, or regularly checking reputable industry news sources and publications.
Methodology
Step 1 - Identification of Relevant Samples Size from Population Database


Step 2 - Approaches for Defining Global Market Size (Value, Volume* & Price*)

Note*: In applicable scenarios
Step 3 - Data Sources
Primary Research
- Web Analytics
- Survey Reports
- Research Institute
- Latest Research Reports
- Opinion Leaders
Secondary Research
- Annual Reports
- White Paper
- Latest Press Release
- Industry Association
- Paid Database
- Investor Presentations

Step 4 - Data Triangulation
Involves using different sources of information in order to increase the validity of a study
These sources are likely to be stakeholders in a program - participants, other researchers, program staff, other community members, and so on.
Then we put all data in single framework & apply various statistical tools to find out the dynamic on the market.
During the analysis stage, feedback from the stakeholder groups would be compared to determine areas of agreement as well as areas of divergence