

Key Insights
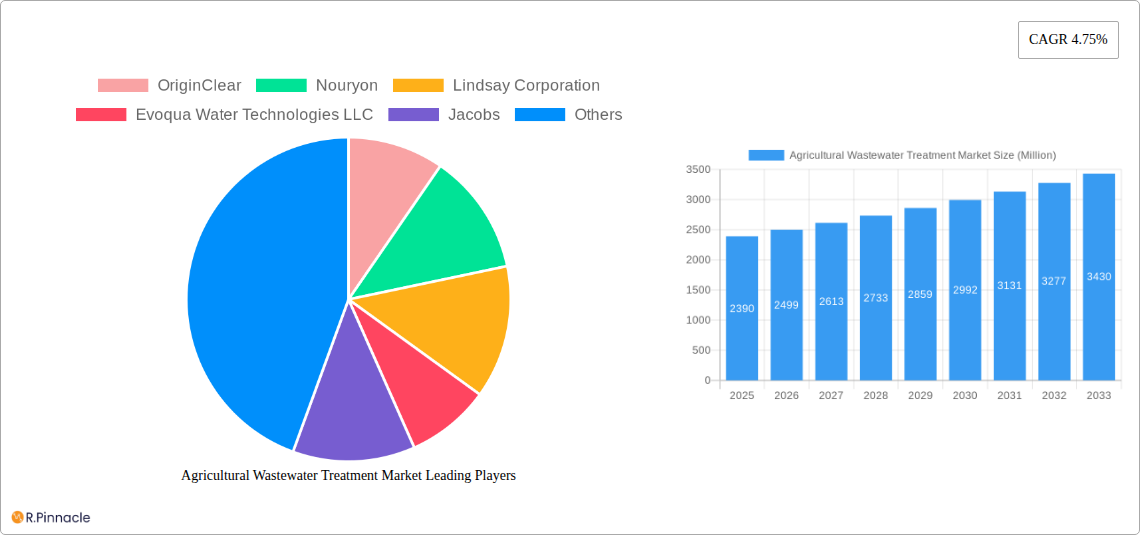
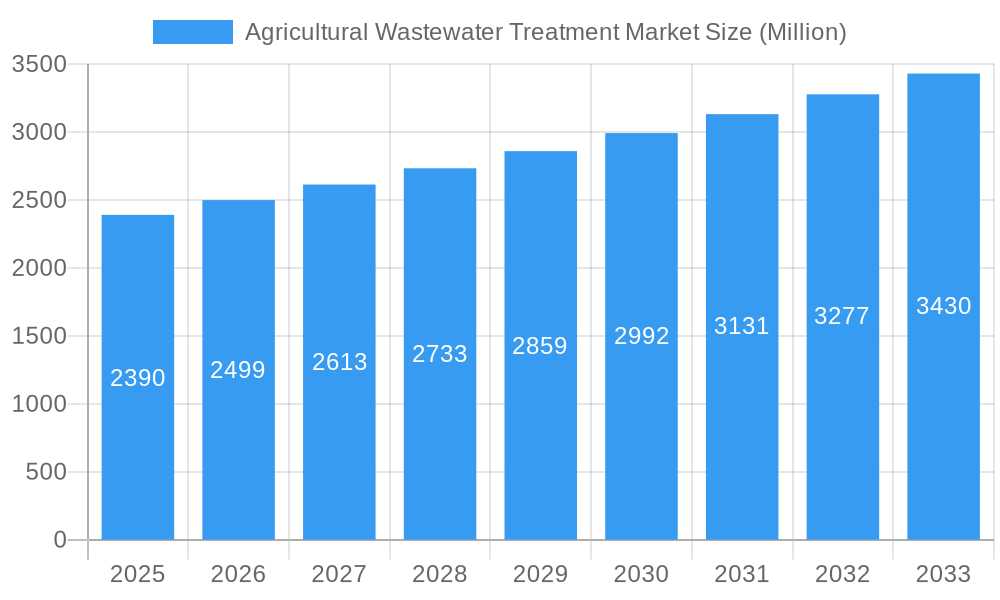
The global agricultural wastewater treatment market, valued at $2.39 billion in 2025, is projected to experience robust growth, driven by increasing regulatory pressures to reduce agricultural pollution and rising awareness of sustainable farming practices. A compound annual growth rate (CAGR) of 4.75% from 2025 to 2033 indicates a significant market expansion, reaching an estimated value exceeding $3.5 billion by 2033. This growth is fueled by several key factors. The increasing adoption of advanced treatment technologies, such as biological solutions offering efficient nutrient removal and physical solutions for solids separation, is significantly impacting the market. Furthermore, the rising demand for treated water for irrigation, particularly in water-stressed regions, is creating a substantial market opportunity. The market is segmented by technology (physical, chemical, biological), pollutant source (point and non-point), and application (crop and non-crop), offering diverse avenues for growth. While advancements in technology contribute to the expansion, challenges remain, including the high initial investment costs associated with implementing advanced treatment systems, particularly in smaller agricultural operations. The varying regulatory landscapes across different regions also pose a challenge to consistent market penetration. However, government initiatives promoting sustainable agriculture and water management are expected to mitigate these challenges and boost market growth in the long term. The competitive landscape involves a mix of large multinational corporations and specialized firms focusing on specific technologies and regional markets.
Agricultural Wastewater Treatment Market Market Size (In Billion)
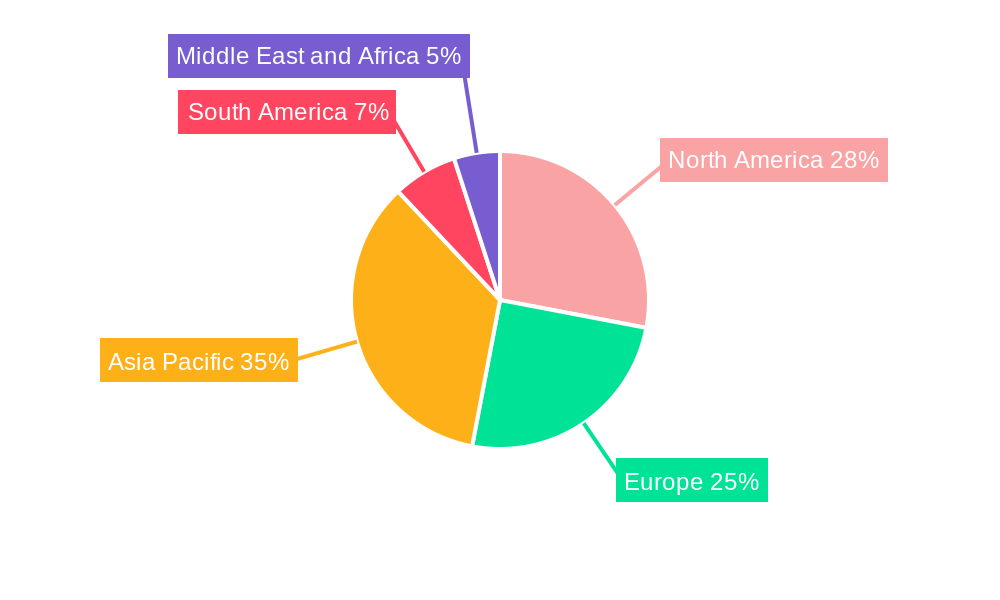
The Asia-Pacific region, including major economies like China and India, is anticipated to dominate the market due to its large agricultural sector and rising concerns about water pollution. North America and Europe will also contribute substantially to market growth, driven by stringent environmental regulations and the adoption of precision agriculture practices. South America and the Middle East and Africa are expected to show slower yet steady growth, driven by increasing agricultural activities and government focus on water resource management. The market's trajectory strongly indicates a continuous need for innovative and cost-effective solutions to address the growing challenges of agricultural wastewater management, creating opportunities for technology providers and service companies within the sector. Future growth will hinge on the successful development and adoption of sustainable and economically viable technologies catering to the unique needs of different agricultural regions and farming practices.
Agricultural Wastewater Treatment Market Company Market Share
Agricultural Wastewater Treatment Market Report: 2019-2033
This comprehensive report provides an in-depth analysis of the Agricultural Wastewater Treatment Market, offering invaluable insights for industry professionals, investors, and strategic decision-makers. Covering the period 2019-2033, with a focus on 2025, this report examines market dynamics, technological advancements, and key players shaping this crucial sector. The study period (2019-2024) and forecast period (2025-2033), alongside the base year (2025) and estimated year (2025), ensure a robust and forward-looking perspective.
Agricultural Wastewater Treatment Market Market Structure & Innovation Trends
The Agricultural Wastewater Treatment Market exhibits a moderately concentrated structure, with key players like OriginClear, Nouryon, Lindsay Corporation, Evoqua Water Technologies LLC, Jacobs, Aquatech International LLC, BASF SE, IDE, SUEZ, DuPont, Organo Corporation, Veolia, AECOM, and Louis Berger International vying for market share. Precise market share data for each company is not readily available and requires further primary research, resulting in an xx value for this metric, however, M&A activity is contributing to consolidation. Recent deals, while specifics on deal values are unavailable (xx Million), indicate a move towards larger, integrated players. Innovation is driven by stringent environmental regulations, the need for sustainable agricultural practices, and the rising demand for efficient and cost-effective treatment solutions. The market is characterized by a diverse range of technologies, including physical, chemical, and biological solutions, each catering to specific pollutant sources (point and non-point) and applications (crop and non-crop). Substitute technologies, while present, often lack the efficiency or scalability of established methods. End-user demographics encompass a wide range of agricultural businesses, from small-scale farms to large-scale industrial operations, creating a diversified market.
- Market Concentration: Moderately Concentrated (xx%)
- M&A Activity: Increasing (xx Million in recent deals)
- Innovation Drivers: Environmental Regulations, Sustainable Agriculture, Cost Efficiency
- Product Substitutes: Limited, less efficient alternatives
Agricultural Wastewater Treatment Market Market Dynamics & Trends
The Agricultural Wastewater Treatment Market is experiencing robust growth, with a projected CAGR of xx% during the forecast period (2025-2033). This growth is fueled by several key factors: increasing awareness of water pollution from agricultural runoff, stricter environmental regulations globally, rising demand for improved water quality for irrigation and human consumption, and technological advancements leading to more efficient and sustainable treatment methods. Technological disruptions, such as the adoption of advanced oxidation processes and membrane filtration technologies, are improving treatment efficacy and reducing operational costs. Consumer preferences are shifting towards environmentally friendly solutions, placing pressure on companies to develop sustainable and eco-conscious technologies. Competitive dynamics are intense, with established players and emerging companies vying for market share through innovation, strategic partnerships, and geographic expansion. Market penetration of advanced technologies is still relatively low but is projected to increase significantly over the forecast period, driven by cost reductions and growing awareness of benefits.
Dominant Regions & Segments in Agricultural Wastewater Treatment Market
While precise market share data for each region and segment is not available (xx% for all regions/segments), several factors point towards specific areas of dominance. The North American and European markets are currently leading in terms of adoption of advanced technologies and stringent environmental regulations. Within the technology segments, biological solutions are gaining traction due to their cost-effectiveness and environmental sustainability. For pollutant sources, Point Source treatment commands a larger market share owing to easier management and regulatory compliance. The crop application segment dominates over non-crop application due to increased farming activity and stringent regulations.
- Key Drivers for Leading Regions:
- North America: Stringent environmental regulations, high adoption of advanced technologies.
- Europe: Similar to North America, driven by regulation and technology.
- Asia-Pacific: Rapidly growing agricultural sector, increasing focus on environmental protection.
- Key Drivers for Dominant Segments:
- Biological Solutions: Cost-effectiveness, environmental friendliness.
- Point Source: Easier management and compliance with regulations.
- Crop Application: Larger market size, stringent regulations.
Agricultural Wastewater Treatment Market Product Innovations
Recent innovations focus on improving treatment efficiency, reducing energy consumption, and minimizing environmental impact. New products incorporating advanced oxidation processes, membrane filtration technologies, and bioaugmentation strategies are gaining traction. These advancements offer superior performance compared to traditional methods, while also addressing the growing need for sustainable and cost-effective solutions. The market is witnessing a trend towards integrated solutions that combine different treatment technologies to optimize performance and minimize waste. The focus on enhancing efficiency, reducing operating costs, and compliance with stringent environmental regulations are significant drivers shaping product development.
Report Scope & Segmentation Analysis
This report segments the Agricultural Wastewater Treatment Market based on technology (Physical Solutions, Chemical Solutions, Biological Solutions), pollutant source (Point Source, Nonpoint Source), and application (Crop, Non-Crop). Each segment exhibits unique growth projections and competitive dynamics. Market size for each segment is not readily available and requires primary research (xx Million for all segments).
- Technology: Each technology segment (Physical, Chemical, Biological) shows varying growth rates based on its efficiency and environmental footprint.
- Pollutant Source: Point source treatment is more established and commands a larger market share than nonpoint source, which presents unique challenges.
- Application: Crop application dominates due to scale and regulatory pressure, whilst non-crop applications are niche but growing.
Key Drivers of Agricultural Wastewater Treatment Market Growth
Growth is driven by increasing environmental concerns regarding agricultural wastewater, stringent government regulations mandating wastewater treatment, and the rising need for efficient irrigation water. Technological advancements, like the development of cost-effective and sustainable treatment solutions, are also crucial. The increasing awareness of the impact of agricultural runoff on water quality and the ecosystem is further boosting market growth.
Challenges in the Agricultural Wastewater Treatment Market Sector
The market faces challenges including the high initial investment costs associated with installing advanced treatment systems, the complexity of treating diverse wastewater streams, and the lack of awareness among small-scale farmers regarding appropriate treatment practices. Furthermore, inconsistent regulatory frameworks across different regions and potential supply chain disruptions related to specific components or chemicals can impede market growth. These factors can affect market adoption and impact overall growth projections (reducing potential growth by xx%).
Emerging Opportunities in Agricultural Wastewater Treatment Market
Emerging opportunities lie in the development of decentralized wastewater treatment systems for smaller farms, the integration of renewable energy sources to reduce operational costs, and the exploration of innovative technologies for nutrient recovery and resource reuse. The growing demand for sustainable and circular economy solutions opens new avenues for market expansion. Focus on digitalization and remote monitoring could reduce costs and improve efficiency.
Leading Players in the Agricultural Wastewater Treatment Market Market
- OriginClear
- Nouryon
- Lindsay Corporation
- Evoqua Water Technologies LLC
- Jacobs
- Aquatech International LLC
- BASF SE
- IDE
- SUEZ
- DuPont
- Organo Corporation
- Veolia
- AECOM
- Louis Berger International
Key Developments in Agricultural Wastewater Treatment Market Industry
- September 2022: Lanxess commissioned a new wastewater treatment plant in Belgium, investing USD 12.65 Million. This highlights the commitment of large industrial players to environmental compliance and showcases the scale of investment in the sector.
- June 2022: AECOM completed the design for a new North Shore wastewater treatment plant. This signifies the growing demand for sophisticated solutions and the importance of infrastructure development in the market.
Future Outlook for Agricultural Wastewater Treatment Market Market
The Agricultural Wastewater Treatment Market is poised for significant growth, driven by increasing environmental awareness, stringent regulations, and technological advancements. Strategic partnerships, investments in research and development, and expansion into new geographical markets will be key to future success. The market will continue to see innovation and consolidation of players. The focus will remain on sustainability, cost-effectiveness, and regulatory compliance.
Agricultural Wastewater Treatment Market Segmentation
-
1. Technology
- 1.1. Physical Solutions
- 1.2. Chemical Solutions
- 1.3. Biological Solutions
-
2. Pollutant Source
- 2.1. Point Source
- 2.2. Nonpoint Source
-
3. Application
- 3.1. Crop
- 3.2. Non-Crop
Agricultural Wastewater Treatment Market Segmentation By Geography
-
1. Asia Pacific
- 1.1. China
- 1.2. India
- 1.3. Japan
- 1.4. South Korea
- 1.5. Rest of Asia Pacific
-
2. North America
- 2.1. United States
- 2.2. Canada
- 2.3. Mexico
-
3. Europe
- 3.1. Germany
- 3.2. United Kingdom
- 3.3. France
- 3.4. Italy
- 3.5. Rest of Europe
-
4. South America
- 4.1. Brazil
- 4.2. Argentina
- 4.3. Rest of South America
-
5. Middle East and Africa
- 5.1. Saudi Arabia
- 5.2. South Africa
- 5.3. Rest of Middle East and Africa
Agricultural Wastewater Treatment Market Regional Market Share
Geographic Coverage of Agricultural Wastewater Treatment Market
Agricultural Wastewater Treatment Market REPORT HIGHLIGHTS
| Aspects | Details |
|---|---|
| Study Period | 2020-2034 |
| Base Year | 2025 |
| Estimated Year | 2026 |
| Forecast Period | 2026-2034 |
| Historical Period | 2020-2025 |
| Growth Rate | CAGR of 4.75% from 2020-2034 |
| Segmentation |
|
Table of Contents
- 1. Introduction
- 1.1. Research Scope
- 1.2. Market Segmentation
- 1.3. Research Objective
- 1.4. Definitions and Assumptions
- 2. Executive Summary
- 2.1. Market Snapshot
- 3. Market Dynamics
- 3.1. Market Drivers
- 3.2. Market Restrains
- 3.3. Market Trends
- 3.4. Market Opportunities
- 4. Market Factor Analysis
- 4.1. Porters Five Forces
- 4.1.1. Bargaining Power of Suppliers
- 4.1.2. Bargaining Power of Buyers
- 4.1.3. Threat of New Entrants
- 4.1.4. Threat of Substitutes
- 4.1.5. Competitive Rivalry
- 4.2. PESTEL analysis
- 4.3. BCG Analysis
- 4.3.1. Stars (High Growth, High Market Share)
- 4.3.2. Cash Cows (Low Growth, High Market Share)
- 4.3.3. Question Mark (High Growth, Low Market Share)
- 4.3.4. Dogs (Low Growth, Low Market Share)
- 4.4. Ansoff Matrix Analysis
- 4.5. Supply Chain Analysis
- 4.6. Regulatory Landscape
- 4.7. Current Market Potential and Opportunity Assessment (TAM–SAM–SOM Framework)
- 4.8. PRI Analyst Note
- 4.1. Porters Five Forces
- 5. Market Analysis, Insights and Forecast 2021-2033
- 5.1. Market Analysis, Insights and Forecast - by Technology
- 5.1.1. Physical Solutions
- 5.1.2. Chemical Solutions
- 5.1.3. Biological Solutions
- 5.2. Market Analysis, Insights and Forecast - by Pollutant Source
- 5.2.1. Point Source
- 5.2.2. Nonpoint Source
- 5.3. Market Analysis, Insights and Forecast - by Application
- 5.3.1. Crop
- 5.3.2. Non-Crop
- 5.4. Market Analysis, Insights and Forecast - by Region
- 5.4.1. Asia Pacific
- 5.4.2. North America
- 5.4.3. Europe
- 5.4.4. South America
- 5.4.5. Middle East and Africa
- 5.1. Market Analysis, Insights and Forecast - by Technology
- 6. Global Agricultural Wastewater Treatment Market Analysis, Insights and Forecast, 2021-2033
- 6.1. Market Analysis, Insights and Forecast - by Technology
- 6.1.1. Physical Solutions
- 6.1.2. Chemical Solutions
- 6.1.3. Biological Solutions
- 6.2. Market Analysis, Insights and Forecast - by Pollutant Source
- 6.2.1. Point Source
- 6.2.2. Nonpoint Source
- 6.3. Market Analysis, Insights and Forecast - by Application
- 6.3.1. Crop
- 6.3.2. Non-Crop
- 6.1. Market Analysis, Insights and Forecast - by Technology
- 7. Asia Pacific Agricultural Wastewater Treatment Market Analysis, Insights and Forecast, 2020-2032
- 7.1. Market Analysis, Insights and Forecast - by Technology
- 7.1.1. Physical Solutions
- 7.1.2. Chemical Solutions
- 7.1.3. Biological Solutions
- 7.2. Market Analysis, Insights and Forecast - by Pollutant Source
- 7.2.1. Point Source
- 7.2.2. Nonpoint Source
- 7.3. Market Analysis, Insights and Forecast - by Application
- 7.3.1. Crop
- 7.3.2. Non-Crop
- 7.1. Market Analysis, Insights and Forecast - by Technology
- 8. North America Agricultural Wastewater Treatment Market Analysis, Insights and Forecast, 2020-2032
- 8.1. Market Analysis, Insights and Forecast - by Technology
- 8.1.1. Physical Solutions
- 8.1.2. Chemical Solutions
- 8.1.3. Biological Solutions
- 8.2. Market Analysis, Insights and Forecast - by Pollutant Source
- 8.2.1. Point Source
- 8.2.2. Nonpoint Source
- 8.3. Market Analysis, Insights and Forecast - by Application
- 8.3.1. Crop
- 8.3.2. Non-Crop
- 8.1. Market Analysis, Insights and Forecast - by Technology
- 9. Europe Agricultural Wastewater Treatment Market Analysis, Insights and Forecast, 2020-2032
- 9.1. Market Analysis, Insights and Forecast - by Technology
- 9.1.1. Physical Solutions
- 9.1.2. Chemical Solutions
- 9.1.3. Biological Solutions
- 9.2. Market Analysis, Insights and Forecast - by Pollutant Source
- 9.2.1. Point Source
- 9.2.2. Nonpoint Source
- 9.3. Market Analysis, Insights and Forecast - by Application
- 9.3.1. Crop
- 9.3.2. Non-Crop
- 9.1. Market Analysis, Insights and Forecast - by Technology
- 10. South America Agricultural Wastewater Treatment Market Analysis, Insights and Forecast, 2020-2032
- 10.1. Market Analysis, Insights and Forecast - by Technology
- 10.1.1. Physical Solutions
- 10.1.2. Chemical Solutions
- 10.1.3. Biological Solutions
- 10.2. Market Analysis, Insights and Forecast - by Pollutant Source
- 10.2.1. Point Source
- 10.2.2. Nonpoint Source
- 10.3. Market Analysis, Insights and Forecast - by Application
- 10.3.1. Crop
- 10.3.2. Non-Crop
- 10.1. Market Analysis, Insights and Forecast - by Technology
- 11. Middle East and Africa Agricultural Wastewater Treatment Market Analysis, Insights and Forecast, 2020-2032
- 11.1. Market Analysis, Insights and Forecast - by Technology
- 11.1.1. Physical Solutions
- 11.1.2. Chemical Solutions
- 11.1.3. Biological Solutions
- 11.2. Market Analysis, Insights and Forecast - by Pollutant Source
- 11.2.1. Point Source
- 11.2.2. Nonpoint Source
- 11.3. Market Analysis, Insights and Forecast - by Application
- 11.3.1. Crop
- 11.3.2. Non-Crop
- 11.1. Market Analysis, Insights and Forecast - by Technology
- 12. Competitive Analysis
- 12.1. Company Profiles
- 12.1.1 OriginClear
- 12.1.1.1. Company Overview
- 12.1.1.2. Products
- 12.1.1.3. Company Financials
- 12.1.1.4. SWOT Analysis
- 12.1.2 Nouryon
- 12.1.2.1. Company Overview
- 12.1.2.2. Products
- 12.1.2.3. Company Financials
- 12.1.2.4. SWOT Analysis
- 12.1.3 Lindsay Corporation
- 12.1.3.1. Company Overview
- 12.1.3.2. Products
- 12.1.3.3. Company Financials
- 12.1.3.4. SWOT Analysis
- 12.1.4 Evoqua Water Technologies LLC
- 12.1.4.1. Company Overview
- 12.1.4.2. Products
- 12.1.4.3. Company Financials
- 12.1.4.4. SWOT Analysis
- 12.1.5 Jacobs
- 12.1.5.1. Company Overview
- 12.1.5.2. Products
- 12.1.5.3. Company Financials
- 12.1.5.4. SWOT Analysis
- 12.1.6 Aquatech International LLC
- 12.1.6.1. Company Overview
- 12.1.6.2. Products
- 12.1.6.3. Company Financials
- 12.1.6.4. SWOT Analysis
- 12.1.7 BASF SE
- 12.1.7.1. Company Overview
- 12.1.7.2. Products
- 12.1.7.3. Company Financials
- 12.1.7.4. SWOT Analysis
- 12.1.8 IDE
- 12.1.8.1. Company Overview
- 12.1.8.2. Products
- 12.1.8.3. Company Financials
- 12.1.8.4. SWOT Analysis
- 12.1.9 SUEZ
- 12.1.9.1. Company Overview
- 12.1.9.2. Products
- 12.1.9.3. Company Financials
- 12.1.9.4. SWOT Analysis
- 12.1.10 DuPont
- 12.1.10.1. Company Overview
- 12.1.10.2. Products
- 12.1.10.3. Company Financials
- 12.1.10.4. SWOT Analysis
- 12.1.11 Organo Corporation
- 12.1.11.1. Company Overview
- 12.1.11.2. Products
- 12.1.11.3. Company Financials
- 12.1.11.4. SWOT Analysis
- 12.1.12 Veolia*List Not Exhaustive
- 12.1.12.1. Company Overview
- 12.1.12.2. Products
- 12.1.12.3. Company Financials
- 12.1.12.4. SWOT Analysis
- 12.1.13 AECOM
- 12.1.13.1. Company Overview
- 12.1.13.2. Products
- 12.1.13.3. Company Financials
- 12.1.13.4. SWOT Analysis
- 12.1.14 Louis Berger International
- 12.1.14.1. Company Overview
- 12.1.14.2. Products
- 12.1.14.3. Company Financials
- 12.1.14.4. SWOT Analysis
- 12.1.1 OriginClear
- 12.2. Market Entropy
- 12.2.1 Company's Key Areas Served
- 12.2.2 Recent Developments
- 12.3. Company Market Share Analysis 2025
- 12.3.1 Top 5 Companies Market Share Analysis
- 12.3.2 Top 3 Companies Market Share Analysis
- 12.4. List of Potential Customers
- 13. Research Methodology
List of Figures
- Figure 1: Global Agricultural Wastewater Treatment Market Revenue Breakdown (Million, %) by Region 2025 & 2033
- Figure 2: Asia Pacific Agricultural Wastewater Treatment Market Revenue (Million), by Technology 2025 & 2033
- Figure 3: Asia Pacific Agricultural Wastewater Treatment Market Revenue Share (%), by Technology 2025 & 2033
- Figure 4: Asia Pacific Agricultural Wastewater Treatment Market Revenue (Million), by Pollutant Source 2025 & 2033
- Figure 5: Asia Pacific Agricultural Wastewater Treatment Market Revenue Share (%), by Pollutant Source 2025 & 2033
- Figure 6: Asia Pacific Agricultural Wastewater Treatment Market Revenue (Million), by Application 2025 & 2033
- Figure 7: Asia Pacific Agricultural Wastewater Treatment Market Revenue Share (%), by Application 2025 & 2033
- Figure 8: Asia Pacific Agricultural Wastewater Treatment Market Revenue (Million), by Country 2025 & 2033
- Figure 9: Asia Pacific Agricultural Wastewater Treatment Market Revenue Share (%), by Country 2025 & 2033
- Figure 10: North America Agricultural Wastewater Treatment Market Revenue (Million), by Technology 2025 & 2033
- Figure 11: North America Agricultural Wastewater Treatment Market Revenue Share (%), by Technology 2025 & 2033
- Figure 12: North America Agricultural Wastewater Treatment Market Revenue (Million), by Pollutant Source 2025 & 2033
- Figure 13: North America Agricultural Wastewater Treatment Market Revenue Share (%), by Pollutant Source 2025 & 2033
- Figure 14: North America Agricultural Wastewater Treatment Market Revenue (Million), by Application 2025 & 2033
- Figure 15: North America Agricultural Wastewater Treatment Market Revenue Share (%), by Application 2025 & 2033
- Figure 16: North America Agricultural Wastewater Treatment Market Revenue (Million), by Country 2025 & 2033
- Figure 17: North America Agricultural Wastewater Treatment Market Revenue Share (%), by Country 2025 & 2033
- Figure 18: Europe Agricultural Wastewater Treatment Market Revenue (Million), by Technology 2025 & 2033
- Figure 19: Europe Agricultural Wastewater Treatment Market Revenue Share (%), by Technology 2025 & 2033
- Figure 20: Europe Agricultural Wastewater Treatment Market Revenue (Million), by Pollutant Source 2025 & 2033
- Figure 21: Europe Agricultural Wastewater Treatment Market Revenue Share (%), by Pollutant Source 2025 & 2033
- Figure 22: Europe Agricultural Wastewater Treatment Market Revenue (Million), by Application 2025 & 2033
- Figure 23: Europe Agricultural Wastewater Treatment Market Revenue Share (%), by Application 2025 & 2033
- Figure 24: Europe Agricultural Wastewater Treatment Market Revenue (Million), by Country 2025 & 2033
- Figure 25: Europe Agricultural Wastewater Treatment Market Revenue Share (%), by Country 2025 & 2033
- Figure 26: South America Agricultural Wastewater Treatment Market Revenue (Million), by Technology 2025 & 2033
- Figure 27: South America Agricultural Wastewater Treatment Market Revenue Share (%), by Technology 2025 & 2033
- Figure 28: South America Agricultural Wastewater Treatment Market Revenue (Million), by Pollutant Source 2025 & 2033
- Figure 29: South America Agricultural Wastewater Treatment Market Revenue Share (%), by Pollutant Source 2025 & 2033
- Figure 30: South America Agricultural Wastewater Treatment Market Revenue (Million), by Application 2025 & 2033
- Figure 31: South America Agricultural Wastewater Treatment Market Revenue Share (%), by Application 2025 & 2033
- Figure 32: South America Agricultural Wastewater Treatment Market Revenue (Million), by Country 2025 & 2033
- Figure 33: South America Agricultural Wastewater Treatment Market Revenue Share (%), by Country 2025 & 2033
- Figure 34: Middle East and Africa Agricultural Wastewater Treatment Market Revenue (Million), by Technology 2025 & 2033
- Figure 35: Middle East and Africa Agricultural Wastewater Treatment Market Revenue Share (%), by Technology 2025 & 2033
- Figure 36: Middle East and Africa Agricultural Wastewater Treatment Market Revenue (Million), by Pollutant Source 2025 & 2033
- Figure 37: Middle East and Africa Agricultural Wastewater Treatment Market Revenue Share (%), by Pollutant Source 2025 & 2033
- Figure 38: Middle East and Africa Agricultural Wastewater Treatment Market Revenue (Million), by Application 2025 & 2033
- Figure 39: Middle East and Africa Agricultural Wastewater Treatment Market Revenue Share (%), by Application 2025 & 2033
- Figure 40: Middle East and Africa Agricultural Wastewater Treatment Market Revenue (Million), by Country 2025 & 2033
- Figure 41: Middle East and Africa Agricultural Wastewater Treatment Market Revenue Share (%), by Country 2025 & 2033
List of Tables
- Table 1: Global Agricultural Wastewater Treatment Market Revenue Million Forecast, by Technology 2020 & 2033
- Table 2: Global Agricultural Wastewater Treatment Market Revenue Million Forecast, by Pollutant Source 2020 & 2033
- Table 3: Global Agricultural Wastewater Treatment Market Revenue Million Forecast, by Application 2020 & 2033
- Table 4: Global Agricultural Wastewater Treatment Market Revenue Million Forecast, by Region 2020 & 2033
- Table 5: Global Agricultural Wastewater Treatment Market Revenue Million Forecast, by Technology 2020 & 2033
- Table 6: Global Agricultural Wastewater Treatment Market Revenue Million Forecast, by Pollutant Source 2020 & 2033
- Table 7: Global Agricultural Wastewater Treatment Market Revenue Million Forecast, by Application 2020 & 2033
- Table 8: Global Agricultural Wastewater Treatment Market Revenue Million Forecast, by Country 2020 & 2033
- Table 9: China Agricultural Wastewater Treatment Market Revenue (Million) Forecast, by Application 2020 & 2033
- Table 10: India Agricultural Wastewater Treatment Market Revenue (Million) Forecast, by Application 2020 & 2033
- Table 11: Japan Agricultural Wastewater Treatment Market Revenue (Million) Forecast, by Application 2020 & 2033
- Table 12: South Korea Agricultural Wastewater Treatment Market Revenue (Million) Forecast, by Application 2020 & 2033
- Table 13: Rest of Asia Pacific Agricultural Wastewater Treatment Market Revenue (Million) Forecast, by Application 2020 & 2033
- Table 14: Global Agricultural Wastewater Treatment Market Revenue Million Forecast, by Technology 2020 & 2033
- Table 15: Global Agricultural Wastewater Treatment Market Revenue Million Forecast, by Pollutant Source 2020 & 2033
- Table 16: Global Agricultural Wastewater Treatment Market Revenue Million Forecast, by Application 2020 & 2033
- Table 17: Global Agricultural Wastewater Treatment Market Revenue Million Forecast, by Country 2020 & 2033
- Table 18: United States Agricultural Wastewater Treatment Market Revenue (Million) Forecast, by Application 2020 & 2033
- Table 19: Canada Agricultural Wastewater Treatment Market Revenue (Million) Forecast, by Application 2020 & 2033
- Table 20: Mexico Agricultural Wastewater Treatment Market Revenue (Million) Forecast, by Application 2020 & 2033
- Table 21: Global Agricultural Wastewater Treatment Market Revenue Million Forecast, by Technology 2020 & 2033
- Table 22: Global Agricultural Wastewater Treatment Market Revenue Million Forecast, by Pollutant Source 2020 & 2033
- Table 23: Global Agricultural Wastewater Treatment Market Revenue Million Forecast, by Application 2020 & 2033
- Table 24: Global Agricultural Wastewater Treatment Market Revenue Million Forecast, by Country 2020 & 2033
- Table 25: Germany Agricultural Wastewater Treatment Market Revenue (Million) Forecast, by Application 2020 & 2033
- Table 26: United Kingdom Agricultural Wastewater Treatment Market Revenue (Million) Forecast, by Application 2020 & 2033
- Table 27: France Agricultural Wastewater Treatment Market Revenue (Million) Forecast, by Application 2020 & 2033
- Table 28: Italy Agricultural Wastewater Treatment Market Revenue (Million) Forecast, by Application 2020 & 2033
- Table 29: Rest of Europe Agricultural Wastewater Treatment Market Revenue (Million) Forecast, by Application 2020 & 2033
- Table 30: Global Agricultural Wastewater Treatment Market Revenue Million Forecast, by Technology 2020 & 2033
- Table 31: Global Agricultural Wastewater Treatment Market Revenue Million Forecast, by Pollutant Source 2020 & 2033
- Table 32: Global Agricultural Wastewater Treatment Market Revenue Million Forecast, by Application 2020 & 2033
- Table 33: Global Agricultural Wastewater Treatment Market Revenue Million Forecast, by Country 2020 & 2033
- Table 34: Brazil Agricultural Wastewater Treatment Market Revenue (Million) Forecast, by Application 2020 & 2033
- Table 35: Argentina Agricultural Wastewater Treatment Market Revenue (Million) Forecast, by Application 2020 & 2033
- Table 36: Rest of South America Agricultural Wastewater Treatment Market Revenue (Million) Forecast, by Application 2020 & 2033
- Table 37: Global Agricultural Wastewater Treatment Market Revenue Million Forecast, by Technology 2020 & 2033
- Table 38: Global Agricultural Wastewater Treatment Market Revenue Million Forecast, by Pollutant Source 2020 & 2033
- Table 39: Global Agricultural Wastewater Treatment Market Revenue Million Forecast, by Application 2020 & 2033
- Table 40: Global Agricultural Wastewater Treatment Market Revenue Million Forecast, by Country 2020 & 2033
- Table 41: Saudi Arabia Agricultural Wastewater Treatment Market Revenue (Million) Forecast, by Application 2020 & 2033
- Table 42: South Africa Agricultural Wastewater Treatment Market Revenue (Million) Forecast, by Application 2020 & 2033
- Table 43: Rest of Middle East and Africa Agricultural Wastewater Treatment Market Revenue (Million) Forecast, by Application 2020 & 2033
Frequently Asked Questions
1. What is the projected Compound Annual Growth Rate (CAGR) of the Agricultural Wastewater Treatment Market?
The projected CAGR is approximately 4.75%.
2. Which companies are prominent players in the Agricultural Wastewater Treatment Market?
Key companies in the market include OriginClear, Nouryon, Lindsay Corporation, Evoqua Water Technologies LLC, Jacobs, Aquatech International LLC, BASF SE, IDE, SUEZ, DuPont, Organo Corporation, Veolia*List Not Exhaustive, AECOM, Louis Berger International.
3. What are the main segments of the Agricultural Wastewater Treatment Market?
The market segments include Technology, Pollutant Source, Application.
4. Can you provide details about the market size?
The market size is estimated to be USD 2.39 Million as of 2022.
5. What are some drivers contributing to market growth?
Rapidly Diminishing Fresh Water Resources; Rising Agricultural Water Demand; Other Drivers.
6. What are the notable trends driving market growth?
Non-Crop Segment to Dominate the Market.
7. Are there any restraints impacting market growth?
Dearth of Awareness regarding Agriculture Wastewater Treatment; Other Restraints.
8. Can you provide examples of recent developments in the market?
September 2022: Lanxess commissioned a new wastewater treatment plant at its Belgium Kallo/Antwerp site. The company invested around EUR 12 million (USD 12.65 million) in the plant, having a treatment capacity of around 260,000 liters of wastewater per hour.
9. What pricing options are available for accessing the report?
Pricing options include single-user, multi-user, and enterprise licenses priced at USD 4750, USD 5250, and USD 8750 respectively.
10. Is the market size provided in terms of value or volume?
The market size is provided in terms of value, measured in Million.
11. Are there any specific market keywords associated with the report?
Yes, the market keyword associated with the report is "Agricultural Wastewater Treatment Market," which aids in identifying and referencing the specific market segment covered.
12. How do I determine which pricing option suits my needs best?
The pricing options vary based on user requirements and access needs. Individual users may opt for single-user licenses, while businesses requiring broader access may choose multi-user or enterprise licenses for cost-effective access to the report.
13. Are there any additional resources or data provided in the Agricultural Wastewater Treatment Market report?
While the report offers comprehensive insights, it's advisable to review the specific contents or supplementary materials provided to ascertain if additional resources or data are available.
14. How can I stay updated on further developments or reports in the Agricultural Wastewater Treatment Market?
To stay informed about further developments, trends, and reports in the Agricultural Wastewater Treatment Market, consider subscribing to industry newsletters, following relevant companies and organizations, or regularly checking reputable industry news sources and publications.
Methodology
Step 1 - Identification of Relevant Samples Size from Population Database


Step 2 - Approaches for Defining Global Market Size (Value, Volume* & Price*)

Note*: In applicable scenarios
Step 3 - Data Sources
Primary Research
- Web Analytics
- Survey Reports
- Research Institute
- Latest Research Reports
- Opinion Leaders
Secondary Research
- Annual Reports
- White Paper
- Latest Press Release
- Industry Association
- Paid Database
- Investor Presentations

Step 4 - Data Triangulation
Involves using different sources of information in order to increase the validity of a study
These sources are likely to be stakeholders in a program - participants, other researchers, program staff, other community members, and so on.
Then we put all data in single framework & apply various statistical tools to find out the dynamic on the market.
During the analysis stage, feedback from the stakeholder groups would be compared to determine areas of agreement as well as areas of divergence