Aircraft Tugs Market Insightful Analysis: Trends, Competitor Dynamics, and Opportunities 2025-2033

Aircraft Tugs Market by Production Analysis, by Consumption Analysis, by Import Market Analysis (Value & Volume), by Export Market Analysis (Value & Volume), by Price Trend Analysis, by North America (United States, Canada, Mexico), by South America (Brazil, Argentina, Rest of South America), by Europe (United Kingdom, Germany, France, Italy, Spain, Russia, Benelux, Nordics, Rest of Europe), by Middle East & Africa (Turkey, Israel, GCC, North Africa, South Africa, Rest of Middle East & Africa), by Asia Pacific (China, India, Japan, South Korea, ASEAN, Oceania, Rest of Asia Pacific) Forecast 2025-2033

Jun 26 2025
Base Year: 2024

234 Pages
Main Logo

Aircraft Tugs Market Insightful Analysis: Trends, Competitor Dynamics, and Opportunities 2025-2033


Home
Industries
Aerospace & Defense
sponsor image
sponsor image
sponsor image
sponsor image

Tailored for you

  • In-depth Analysis Tailored to Specified Regions or Segments
  • Company Profiles Customized to User Preferences
  • Comprehensive Insights Focused on Specific Segments or Regions
  • Customized Evaluation of Competitive Landscape to Meet Your Needs
  • Tailored Customization to Address Other Specific Requirements
Ask for customization


Key Insights

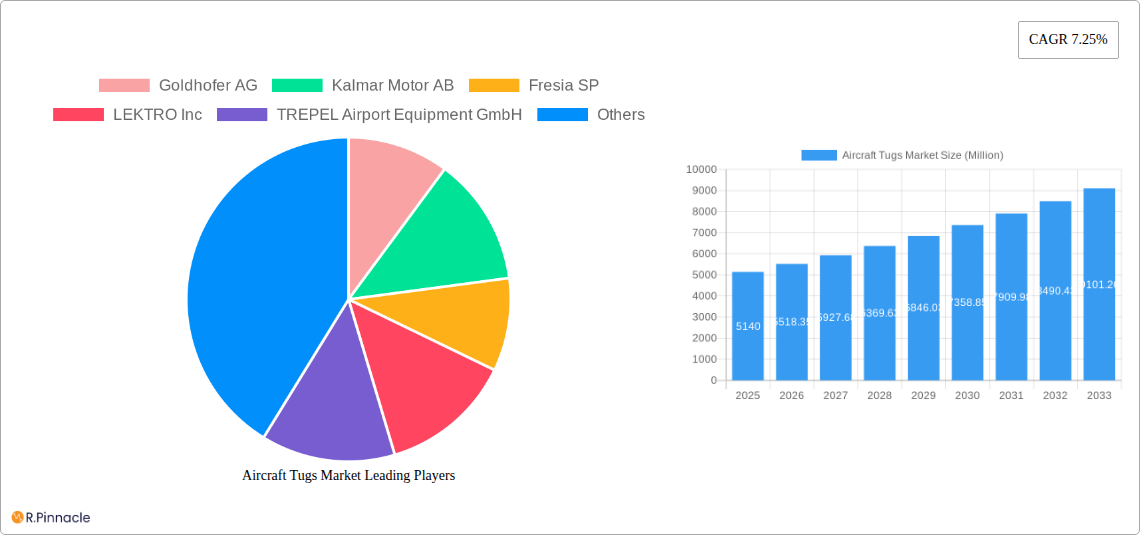
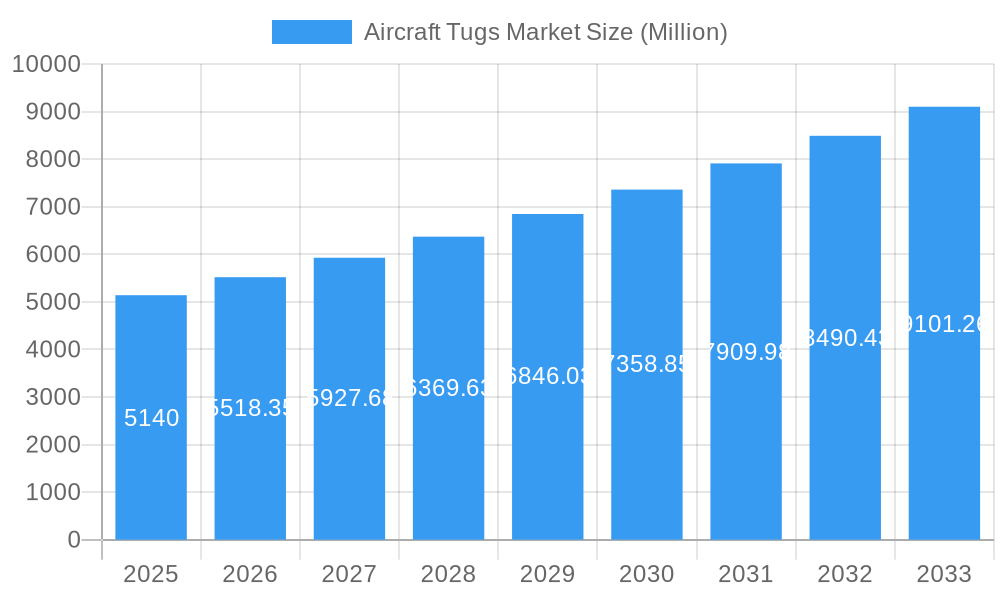
The global aircraft tugs market, valued at $5.14 billion in 2025, is projected to experience robust growth, exhibiting a compound annual growth rate (CAGR) of 7.25% from 2025 to 2033. This expansion is driven by several key factors. The increasing air travel volume globally necessitates efficient ground handling solutions, fueling demand for aircraft tugs. Furthermore, the ongoing modernization of airport infrastructure and the adoption of advanced technologies within the aviation sector contribute significantly to market growth. The shift towards larger and heavier aircraft also increases the demand for more powerful and reliable tug models. The market is segmented by type (conventional and towbarless), power source (diesel, gas, and electric), and geographic region. While diesel-powered tugs currently dominate the market, electric tugs are gaining traction due to their environmental benefits and reduced operational costs, particularly within airports emphasizing sustainability initiatives. The presence of established players like Goldhofer AG and emerging innovators like LEKTRO Inc. fosters competition and drives innovation. Regional growth is expected to vary, with North America and Europe maintaining significant market shares due to established aviation industries and high airport density. However, the Asia-Pacific region is poised for substantial growth given the rapid expansion of its aviation sector.

Growth constraints include the high initial investment cost of aircraft tugs, especially for advanced electric models. Furthermore, stringent safety regulations and maintenance requirements can impact market growth. However, technological advancements leading to improved fuel efficiency and reduced maintenance needs are mitigating these challenges. The market's competitive landscape is characterized by both established manufacturers and specialized niche players, ensuring a dynamic and innovative market. The forecast period (2025-2033) promises consistent growth driven by the interconnected factors of rising air travel, technological advancements, and the continuous expansion of global aviation infrastructure. The market is well-positioned for sustained expansion, driven by both organic growth and strategic acquisitions and collaborations within the industry.

Aircraft Tugs Market: A Comprehensive Report (2019-2033)

This in-depth report provides a comprehensive analysis of the Aircraft Tugs Market, offering invaluable insights for industry professionals, investors, and stakeholders. The study period covers 2019-2033, with 2025 as the base and estimated year. The report forecasts market trends from 2025-2033, based on data from the historical period of 2019-2024. Expect detailed analysis across key segments, including type (conventional, towbarless), power source (diesel, gas, electric), and geographic regions, revealing market size in Millions.

Aircraft Tugs Market Research Report - Market Size, Growth & Forecast

Aircraft Tugs Market Structure & Innovation Trends

The Aircraft Tugs Market exhibits a moderately concentrated structure, with key players like Goldhofer AG, Kalmar Motor AB, and Textron Inc (Ground Support Equipment Inc) holding significant market share. However, the market also features several smaller, specialized manufacturers, leading to a dynamic competitive landscape. Innovation in the sector is driven by increasing demand for fuel-efficient and environmentally friendly solutions, stricter emission regulations, and the growing adoption of automation technologies. The market is witnessing a rise in electric and hybrid-electric tugs, responding to the aviation industry's sustainability goals.

Mergers and acquisitions (M&A) activity remains moderate, with deal values in the xx Million range over the past five years, primarily focused on expanding geographic reach and technological capabilities. Regulatory frameworks, such as those concerning emissions and safety standards, play a crucial role in shaping market dynamics. Product substitutes, while limited, include specialized ground handling equipment designed for specific aircraft types. End-user demographics are primarily focused on major international and regional airports, airlines, and ground handling service providers.

Aircraft Tugs Market Growth

Aircraft Tugs Market Dynamics & Trends

The Aircraft Tugs Market is experiencing robust growth, driven by rising air passenger traffic, expansion of airport infrastructure globally, and an increasing emphasis on operational efficiency. The CAGR for the forecast period (2025-2033) is projected at xx%. Market penetration of electric tugs is expected to increase significantly, reaching xx% by 2033, fueled by environmental concerns and government incentives. Technological disruptions, primarily stemming from the adoption of advanced electric powertrains and autonomous features, are reshaping the competitive landscape. Consumer preferences are shifting towards tugs with improved fuel efficiency, lower emissions, and enhanced safety features. Competitive dynamics are characterized by intense rivalry among established players and the emergence of innovative startups, leading to continuous product improvements and price competition.

Aircraft Tugs Market Growth

Dominant Regions & Segments in Aircraft Tugs Market

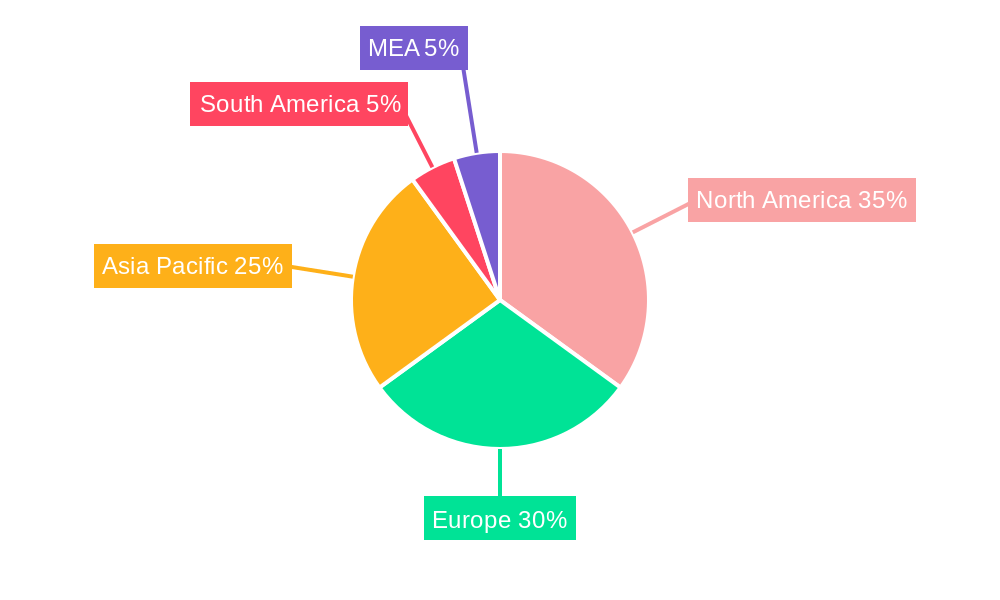
The North American region currently dominates the Aircraft Tugs Market, driven by the presence of major airports and airlines, coupled with robust investments in airport infrastructure. Europe also holds a substantial market share, with significant growth potential in emerging economies in Asia Pacific.

  • Key Drivers in North America: Strong airline presence, high disposable income, investment in airport modernization.
  • Key Drivers in Europe: Stringent emission regulations, technological advancements, well-established airport infrastructure.
  • Key Drivers in Asia Pacific: Rapid air travel growth, infrastructure development, government initiatives to improve airport capabilities.

The conventional towbarless segment holds the largest market share within the type segment currently, driven by their versatility and efficiency. However, the electric power segment is projected to experience the highest growth rate during the forecast period (2025-2033) due to environmental concerns and cost savings.

Aircraft Tugs Market Product Innovations

Recent product innovations focus on enhancing efficiency, reducing emissions, and improving safety features. Electric and hybrid-electric tugs are gaining prominence, with manufacturers integrating advanced battery technologies and regenerative braking systems. Improved maneuverability and control systems, including autonomous functionalities, are also being incorporated to streamline ground operations. These innovations address the industry's growing need for sustainable and cost-effective solutions. The market fit is strong given the rising focus on environmental concerns and operational optimization within the aviation sector.

Report Scope & Segmentation Analysis

This report segments the Aircraft Tugs Market based on type (conventional, towbarless) and power source (diesel, gas, electric).

Type: The conventional segment is characterized by mature technology and a large installed base; the towbarless segment demonstrates faster growth, reflecting technological advancements and improved safety. Both segments will see steady growth during the forecast period.

Power Source: The diesel segment currently holds the largest market share but faces pressure from stricter environmental regulations. The gas segment has limited market share, and the electric segment displays significant growth potential driven by increasing sustainability concerns. Market sizes for each segment are detailed within the complete report.

Key Drivers of Aircraft Tugs Market Growth

The Aircraft Tugs Market growth is fueled by several factors. The rising air passenger traffic globally necessitates efficient ground support equipment. Stricter emission regulations are driving the adoption of electric and hybrid-electric tugs. Furthermore, continuous advancements in technology enhance safety, efficiency, and automation, thereby increasing market demand. Airport infrastructure development globally, driven by increasing air travel, supports the expansion of the aircraft tug market.

Challenges in the Aircraft Tugs Market Sector

The Aircraft Tugs Market faces challenges such as high initial investment costs for electric tugs, limited charging infrastructure at airports, and the need for skilled labor to operate sophisticated equipment. Supply chain disruptions can impact production and delivery timelines. Furthermore, intense competition from established and emerging players can put downward pressure on pricing, affecting profitability.

Emerging Opportunities in Aircraft Tugs Market

The growing adoption of electric and autonomous technologies presents significant opportunities. The development of advanced battery technologies and charging infrastructure can further accelerate the market's growth. Emerging markets in Asia and Africa also offer considerable expansion potential. Furthermore, the development of specialized tugs for emerging aircraft types will create new market segments.

Leading Players in the Aircraft Tugs Market Market

  • Goldhofer AG
  • Kalmar Motor AB
  • Fresia SP
  • LEKTRO Inc
  • TREPEL Airport Equipment GmbH
  • Tronair Inc
  • John Bean Technologies Corp
  • Tinka Resources Limited
  • Textron Inc (Ground Support Equipment Inc)
  • Airtug LLC
  • MULAG
  • MOTOTOK

Key Developments in Aircraft Tugs Market Industry

  • April 2023: Air India announced pilot-controlled tow tractors for Airbus A320s at Delhi and Bengaluru airports, aiming to reduce emissions.
  • June 2023: Lokpriyo Gopinath Bordoloi International Airport launched its first electric vehicle tug, showcasing a move towards sustainable ground operations.

Future Outlook for Aircraft Tugs Market Market

The Aircraft Tugs Market is poised for substantial growth over the next decade, driven by the increasing demand for eco-friendly solutions, technological advancements, and expanding airport infrastructure. Strategic partnerships, investments in research and development, and a focus on customization will be key to success in this dynamic and evolving market. The market will witness a higher adoption of electric and autonomous tugs, leading to increased efficiency and sustainability.

Aircraft Tugs Market Segmentation

  • 1. Production Analysis
  • 2. Consumption Analysis
  • 3. Import Market Analysis (Value & Volume)
  • 4. Export Market Analysis (Value & Volume)
  • 5. Price Trend Analysis

Aircraft Tugs Market Segmentation By Geography

  • 1. North America
    • 1.1. United States
    • 1.2. Canada
    • 1.3. Mexico
  • 2. South America
    • 2.1. Brazil
    • 2.2. Argentina
    • 2.3. Rest of South America
  • 3. Europe
    • 3.1. United Kingdom
    • 3.2. Germany
    • 3.3. France
    • 3.4. Italy
    • 3.5. Spain
    • 3.6. Russia
    • 3.7. Benelux
    • 3.8. Nordics
    • 3.9. Rest of Europe
  • 4. Middle East & Africa
    • 4.1. Turkey
    • 4.2. Israel
    • 4.3. GCC
    • 4.4. North Africa
    • 4.5. South Africa
    • 4.6. Rest of Middle East & Africa
  • 5. Asia Pacific
    • 5.1. China
    • 5.2. India
    • 5.3. Japan
    • 5.4. South Korea
    • 5.5. ASEAN
    • 5.6. Oceania
    • 5.7. Rest of Asia Pacific
Aircraft Tugs Market Regional Share


Aircraft Tugs Market REPORT HIGHLIGHTS

AspectsDetails
Study Period 2019-2033
Base Year 2024
Estimated Year 2025
Forecast Period2025-2033
Historical Period2019-2024
Growth RateCAGR of 7.25% from 2019-2033
Segmentation
    • By Production Analysis
    • By Consumption Analysis
    • By Import Market Analysis (Value & Volume)
    • By Export Market Analysis (Value & Volume)
    • By Price Trend Analysis
  • By Geography
    • North America
      • United States
      • Canada
      • Mexico
    • South America
      • Brazil
      • Argentina
      • Rest of South America
    • Europe
      • United Kingdom
      • Germany
      • France
      • Italy
      • Spain
      • Russia
      • Benelux
      • Nordics
      • Rest of Europe
    • Middle East & Africa
      • Turkey
      • Israel
      • GCC
      • North Africa
      • South Africa
      • Rest of Middle East & Africa
    • Asia Pacific
      • China
      • India
      • Japan
      • South Korea
      • ASEAN
      • Oceania
      • Rest of Asia Pacific


Table of Contents

  1. 1. Introduction
    • 1.1. Research Scope
    • 1.2. Market Segmentation
    • 1.3. Research Methodology
    • 1.4. Definitions and Assumptions
  2. 2. Executive Summary
    • 2.1. Introduction
  3. 3. Market Dynamics
    • 3.1. Introduction
      • 3.2. Market Drivers
        • 3.2.1. Increase in Internet of Things (IoT) and Autonomous Systems; Rise in Demand for Military and Defense Satellite Communication Solutions
      • 3.3. Market Restrains
        • 3.3.1. Cybersecurity Threats to Satellite Communication; Interference in Transmission of Data
      • 3.4. Market Trends
        • 3.4.1. Electric Segment is Anticipated to Register the Highest CAGR During the Forecast Period
  4. 4. Market Factor Analysis
    • 4.1. Porters Five Forces
    • 4.2. Supply/Value Chain
    • 4.3. PESTEL analysis
    • 4.4. Market Entropy
    • 4.5. Patent/Trademark Analysis
  5. 5. Global Aircraft Tugs Market Analysis, Insights and Forecast, 2019-2031
    • 5.1. Market Analysis, Insights and Forecast - by Production Analysis
      • 5.2. Market Analysis, Insights and Forecast - by Consumption Analysis
        • 5.3. Market Analysis, Insights and Forecast - by Import Market Analysis (Value & Volume)
          • 5.4. Market Analysis, Insights and Forecast - by Export Market Analysis (Value & Volume)
            • 5.5. Market Analysis, Insights and Forecast - by Price Trend Analysis
              • 5.6. Market Analysis, Insights and Forecast - by Region
                • 5.6.1. North America
                • 5.6.2. South America
                • 5.6.3. Europe
                • 5.6.4. Middle East & Africa
                • 5.6.5. Asia Pacific
            • 6. North America Aircraft Tugs Market Analysis, Insights and Forecast, 2019-2031
              • 6.1. Market Analysis, Insights and Forecast - by Production Analysis
                • 6.2. Market Analysis, Insights and Forecast - by Consumption Analysis
                  • 6.3. Market Analysis, Insights and Forecast - by Import Market Analysis (Value & Volume)
                    • 6.4. Market Analysis, Insights and Forecast - by Export Market Analysis (Value & Volume)
                      • 6.5. Market Analysis, Insights and Forecast - by Price Trend Analysis
                      • 7. South America Aircraft Tugs Market Analysis, Insights and Forecast, 2019-2031
                        • 7.1. Market Analysis, Insights and Forecast - by Production Analysis
                          • 7.2. Market Analysis, Insights and Forecast - by Consumption Analysis
                            • 7.3. Market Analysis, Insights and Forecast - by Import Market Analysis (Value & Volume)
                              • 7.4. Market Analysis, Insights and Forecast - by Export Market Analysis (Value & Volume)
                                • 7.5. Market Analysis, Insights and Forecast - by Price Trend Analysis
                                • 8. Europe Aircraft Tugs Market Analysis, Insights and Forecast, 2019-2031
                                  • 8.1. Market Analysis, Insights and Forecast - by Production Analysis
                                    • 8.2. Market Analysis, Insights and Forecast - by Consumption Analysis
                                      • 8.3. Market Analysis, Insights and Forecast - by Import Market Analysis (Value & Volume)
                                        • 8.4. Market Analysis, Insights and Forecast - by Export Market Analysis (Value & Volume)
                                          • 8.5. Market Analysis, Insights and Forecast - by Price Trend Analysis
                                          • 9. Middle East & Africa Aircraft Tugs Market Analysis, Insights and Forecast, 2019-2031
                                            • 9.1. Market Analysis, Insights and Forecast - by Production Analysis
                                              • 9.2. Market Analysis, Insights and Forecast - by Consumption Analysis
                                                • 9.3. Market Analysis, Insights and Forecast - by Import Market Analysis (Value & Volume)
                                                  • 9.4. Market Analysis, Insights and Forecast - by Export Market Analysis (Value & Volume)
                                                    • 9.5. Market Analysis, Insights and Forecast - by Price Trend Analysis
                                                    • 10. Asia Pacific Aircraft Tugs Market Analysis, Insights and Forecast, 2019-2031
                                                      • 10.1. Market Analysis, Insights and Forecast - by Production Analysis
                                                        • 10.2. Market Analysis, Insights and Forecast - by Consumption Analysis
                                                          • 10.3. Market Analysis, Insights and Forecast - by Import Market Analysis (Value & Volume)
                                                            • 10.4. Market Analysis, Insights and Forecast - by Export Market Analysis (Value & Volume)
                                                              • 10.5. Market Analysis, Insights and Forecast - by Price Trend Analysis
                                                              • 11. North America Aircraft Tugs Market Analysis, Insights and Forecast, 2019-2031
                                                                  • 11.1. Market Analysis, Insights and Forecast - By Country/Sub-region
                                                                    • 11.1.1 United States
                                                                    • 11.1.2 Canada
                                                                    • 11.1.3 Mexico
                                                              • 12. Europe Aircraft Tugs Market Analysis, Insights and Forecast, 2019-2031
                                                                  • 12.1. Market Analysis, Insights and Forecast - By Country/Sub-region
                                                                    • 12.1.1 Germany
                                                                    • 12.1.2 United Kingdom
                                                                    • 12.1.3 France
                                                                    • 12.1.4 Spain
                                                                    • 12.1.5 Italy
                                                                    • 12.1.6 Spain
                                                                    • 12.1.7 Belgium
                                                                    • 12.1.8 Netherland
                                                                    • 12.1.9 Nordics
                                                                    • 12.1.10 Rest of Europe
                                                              • 13. Asia Pacific Aircraft Tugs Market Analysis, Insights and Forecast, 2019-2031
                                                                  • 13.1. Market Analysis, Insights and Forecast - By Country/Sub-region
                                                                    • 13.1.1 China
                                                                    • 13.1.2 Japan
                                                                    • 13.1.3 India
                                                                    • 13.1.4 South Korea
                                                                    • 13.1.5 Southeast Asia
                                                                    • 13.1.6 Australia
                                                                    • 13.1.7 Indonesia
                                                                    • 13.1.8 Phillipes
                                                                    • 13.1.9 Singapore
                                                                    • 13.1.10 Thailandc
                                                                    • 13.1.11 Rest of Asia Pacific
                                                              • 14. South America Aircraft Tugs Market Analysis, Insights and Forecast, 2019-2031
                                                                  • 14.1. Market Analysis, Insights and Forecast - By Country/Sub-region
                                                                    • 14.1.1 Brazil
                                                                    • 14.1.2 Argentina
                                                                    • 14.1.3 Peru
                                                                    • 14.1.4 Chile
                                                                    • 14.1.5 Colombia
                                                                    • 14.1.6 Ecuador
                                                                    • 14.1.7 Venezuela
                                                                    • 14.1.8 Rest of South America
                                                              • 15. North America Aircraft Tugs Market Analysis, Insights and Forecast, 2019-2031
                                                                  • 15.1. Market Analysis, Insights and Forecast - By Country/Sub-region
                                                                    • 15.1.1 United States
                                                                    • 15.1.2 Canada
                                                                    • 15.1.3 Mexico
                                                              • 16. MEA Aircraft Tugs Market Analysis, Insights and Forecast, 2019-2031
                                                                  • 16.1. Market Analysis, Insights and Forecast - By Country/Sub-region
                                                                    • 16.1.1 United Arab Emirates
                                                                    • 16.1.2 Saudi Arabia
                                                                    • 16.1.3 South Africa
                                                                    • 16.1.4 Rest of Middle East and Africa
                                                              • 17. Competitive Analysis
                                                                • 17.1. Global Market Share Analysis 2024
                                                                  • 17.2. Company Profiles
                                                                    • 17.2.1 Goldhofer AG
                                                                      • 17.2.1.1. Overview
                                                                      • 17.2.1.2. Products
                                                                      • 17.2.1.3. SWOT Analysis
                                                                      • 17.2.1.4. Recent Developments
                                                                      • 17.2.1.5. Financials (Based on Availability)
                                                                    • 17.2.2 Kalmar Motor AB
                                                                      • 17.2.2.1. Overview
                                                                      • 17.2.2.2. Products
                                                                      • 17.2.2.3. SWOT Analysis
                                                                      • 17.2.2.4. Recent Developments
                                                                      • 17.2.2.5. Financials (Based on Availability)
                                                                    • 17.2.3 Fresia SP
                                                                      • 17.2.3.1. Overview
                                                                      • 17.2.3.2. Products
                                                                      • 17.2.3.3. SWOT Analysis
                                                                      • 17.2.3.4. Recent Developments
                                                                      • 17.2.3.5. Financials (Based on Availability)
                                                                    • 17.2.4 LEKTRO Inc
                                                                      • 17.2.4.1. Overview
                                                                      • 17.2.4.2. Products
                                                                      • 17.2.4.3. SWOT Analysis
                                                                      • 17.2.4.4. Recent Developments
                                                                      • 17.2.4.5. Financials (Based on Availability)
                                                                    • 17.2.5 TREPEL Airport Equipment GmbH
                                                                      • 17.2.5.1. Overview
                                                                      • 17.2.5.2. Products
                                                                      • 17.2.5.3. SWOT Analysis
                                                                      • 17.2.5.4. Recent Developments
                                                                      • 17.2.5.5. Financials (Based on Availability)
                                                                    • 17.2.6 Tronair Inc
                                                                      • 17.2.6.1. Overview
                                                                      • 17.2.6.2. Products
                                                                      • 17.2.6.3. SWOT Analysis
                                                                      • 17.2.6.4. Recent Developments
                                                                      • 17.2.6.5. Financials (Based on Availability)
                                                                    • 17.2.7 John Bean Technologies Corp
                                                                      • 17.2.7.1. Overview
                                                                      • 17.2.7.2. Products
                                                                      • 17.2.7.3. SWOT Analysis
                                                                      • 17.2.7.4. Recent Developments
                                                                      • 17.2.7.5. Financials (Based on Availability)
                                                                    • 17.2.8 Tinka Resources Limited
                                                                      • 17.2.8.1. Overview
                                                                      • 17.2.8.2. Products
                                                                      • 17.2.8.3. SWOT Analysis
                                                                      • 17.2.8.4. Recent Developments
                                                                      • 17.2.8.5. Financials (Based on Availability)
                                                                    • 17.2.9 Textron Inc (Ground Support Equipment Inc )
                                                                      • 17.2.9.1. Overview
                                                                      • 17.2.9.2. Products
                                                                      • 17.2.9.3. SWOT Analysis
                                                                      • 17.2.9.4. Recent Developments
                                                                      • 17.2.9.5. Financials (Based on Availability)
                                                                    • 17.2.10 Airtug LLC
                                                                      • 17.2.10.1. Overview
                                                                      • 17.2.10.2. Products
                                                                      • 17.2.10.3. SWOT Analysis
                                                                      • 17.2.10.4. Recent Developments
                                                                      • 17.2.10.5. Financials (Based on Availability)
                                                                    • 17.2.11 MULAG
                                                                      • 17.2.11.1. Overview
                                                                      • 17.2.11.2. Products
                                                                      • 17.2.11.3. SWOT Analysis
                                                                      • 17.2.11.4. Recent Developments
                                                                      • 17.2.11.5. Financials (Based on Availability)
                                                                    • 17.2.12 MOTOTOK
                                                                      • 17.2.12.1. Overview
                                                                      • 17.2.12.2. Products
                                                                      • 17.2.12.3. SWOT Analysis
                                                                      • 17.2.12.4. Recent Developments
                                                                      • 17.2.12.5. Financials (Based on Availability)

                                                              List of Figures

                                                              1. Figure 1: Global Aircraft Tugs Market Revenue Breakdown (Million, %) by Region 2024 & 2032
                                                              2. Figure 2: North America Aircraft Tugs Market Revenue (Million), by Country 2024 & 2032
                                                              3. Figure 3: North America Aircraft Tugs Market Revenue Share (%), by Country 2024 & 2032
                                                              4. Figure 4: Europe Aircraft Tugs Market Revenue (Million), by Country 2024 & 2032
                                                              5. Figure 5: Europe Aircraft Tugs Market Revenue Share (%), by Country 2024 & 2032
                                                              6. Figure 6: Asia Pacific Aircraft Tugs Market Revenue (Million), by Country 2024 & 2032
                                                              7. Figure 7: Asia Pacific Aircraft Tugs Market Revenue Share (%), by Country 2024 & 2032
                                                              8. Figure 8: South America Aircraft Tugs Market Revenue (Million), by Country 2024 & 2032
                                                              9. Figure 9: South America Aircraft Tugs Market Revenue Share (%), by Country 2024 & 2032
                                                              10. Figure 10: North America Aircraft Tugs Market Revenue (Million), by Country 2024 & 2032
                                                              11. Figure 11: North America Aircraft Tugs Market Revenue Share (%), by Country 2024 & 2032
                                                              12. Figure 12: MEA Aircraft Tugs Market Revenue (Million), by Country 2024 & 2032
                                                              13. Figure 13: MEA Aircraft Tugs Market Revenue Share (%), by Country 2024 & 2032
                                                              14. Figure 14: North America Aircraft Tugs Market Revenue (Million), by Production Analysis 2024 & 2032
                                                              15. Figure 15: North America Aircraft Tugs Market Revenue Share (%), by Production Analysis 2024 & 2032
                                                              16. Figure 16: North America Aircraft Tugs Market Revenue (Million), by Consumption Analysis 2024 & 2032
                                                              17. Figure 17: North America Aircraft Tugs Market Revenue Share (%), by Consumption Analysis 2024 & 2032
                                                              18. Figure 18: North America Aircraft Tugs Market Revenue (Million), by Import Market Analysis (Value & Volume) 2024 & 2032
                                                              19. Figure 19: North America Aircraft Tugs Market Revenue Share (%), by Import Market Analysis (Value & Volume) 2024 & 2032
                                                              20. Figure 20: North America Aircraft Tugs Market Revenue (Million), by Export Market Analysis (Value & Volume) 2024 & 2032
                                                              21. Figure 21: North America Aircraft Tugs Market Revenue Share (%), by Export Market Analysis (Value & Volume) 2024 & 2032
                                                              22. Figure 22: North America Aircraft Tugs Market Revenue (Million), by Price Trend Analysis 2024 & 2032
                                                              23. Figure 23: North America Aircraft Tugs Market Revenue Share (%), by Price Trend Analysis 2024 & 2032
                                                              24. Figure 24: North America Aircraft Tugs Market Revenue (Million), by Country 2024 & 2032
                                                              25. Figure 25: North America Aircraft Tugs Market Revenue Share (%), by Country 2024 & 2032
                                                              26. Figure 26: South America Aircraft Tugs Market Revenue (Million), by Production Analysis 2024 & 2032
                                                              27. Figure 27: South America Aircraft Tugs Market Revenue Share (%), by Production Analysis 2024 & 2032
                                                              28. Figure 28: South America Aircraft Tugs Market Revenue (Million), by Consumption Analysis 2024 & 2032
                                                              29. Figure 29: South America Aircraft Tugs Market Revenue Share (%), by Consumption Analysis 2024 & 2032
                                                              30. Figure 30: South America Aircraft Tugs Market Revenue (Million), by Import Market Analysis (Value & Volume) 2024 & 2032
                                                              31. Figure 31: South America Aircraft Tugs Market Revenue Share (%), by Import Market Analysis (Value & Volume) 2024 & 2032
                                                              32. Figure 32: South America Aircraft Tugs Market Revenue (Million), by Export Market Analysis (Value & Volume) 2024 & 2032
                                                              33. Figure 33: South America Aircraft Tugs Market Revenue Share (%), by Export Market Analysis (Value & Volume) 2024 & 2032
                                                              34. Figure 34: South America Aircraft Tugs Market Revenue (Million), by Price Trend Analysis 2024 & 2032
                                                              35. Figure 35: South America Aircraft Tugs Market Revenue Share (%), by Price Trend Analysis 2024 & 2032
                                                              36. Figure 36: South America Aircraft Tugs Market Revenue (Million), by Country 2024 & 2032
                                                              37. Figure 37: South America Aircraft Tugs Market Revenue Share (%), by Country 2024 & 2032
                                                              38. Figure 38: Europe Aircraft Tugs Market Revenue (Million), by Production Analysis 2024 & 2032
                                                              39. Figure 39: Europe Aircraft Tugs Market Revenue Share (%), by Production Analysis 2024 & 2032
                                                              40. Figure 40: Europe Aircraft Tugs Market Revenue (Million), by Consumption Analysis 2024 & 2032
                                                              41. Figure 41: Europe Aircraft Tugs Market Revenue Share (%), by Consumption Analysis 2024 & 2032
                                                              42. Figure 42: Europe Aircraft Tugs Market Revenue (Million), by Import Market Analysis (Value & Volume) 2024 & 2032
                                                              43. Figure 43: Europe Aircraft Tugs Market Revenue Share (%), by Import Market Analysis (Value & Volume) 2024 & 2032
                                                              44. Figure 44: Europe Aircraft Tugs Market Revenue (Million), by Export Market Analysis (Value & Volume) 2024 & 2032
                                                              45. Figure 45: Europe Aircraft Tugs Market Revenue Share (%), by Export Market Analysis (Value & Volume) 2024 & 2032
                                                              46. Figure 46: Europe Aircraft Tugs Market Revenue (Million), by Price Trend Analysis 2024 & 2032
                                                              47. Figure 47: Europe Aircraft Tugs Market Revenue Share (%), by Price Trend Analysis 2024 & 2032
                                                              48. Figure 48: Europe Aircraft Tugs Market Revenue (Million), by Country 2024 & 2032
                                                              49. Figure 49: Europe Aircraft Tugs Market Revenue Share (%), by Country 2024 & 2032
                                                              50. Figure 50: Middle East & Africa Aircraft Tugs Market Revenue (Million), by Production Analysis 2024 & 2032
                                                              51. Figure 51: Middle East & Africa Aircraft Tugs Market Revenue Share (%), by Production Analysis 2024 & 2032
                                                              52. Figure 52: Middle East & Africa Aircraft Tugs Market Revenue (Million), by Consumption Analysis 2024 & 2032
                                                              53. Figure 53: Middle East & Africa Aircraft Tugs Market Revenue Share (%), by Consumption Analysis 2024 & 2032
                                                              54. Figure 54: Middle East & Africa Aircraft Tugs Market Revenue (Million), by Import Market Analysis (Value & Volume) 2024 & 2032
                                                              55. Figure 55: Middle East & Africa Aircraft Tugs Market Revenue Share (%), by Import Market Analysis (Value & Volume) 2024 & 2032
                                                              56. Figure 56: Middle East & Africa Aircraft Tugs Market Revenue (Million), by Export Market Analysis (Value & Volume) 2024 & 2032
                                                              57. Figure 57: Middle East & Africa Aircraft Tugs Market Revenue Share (%), by Export Market Analysis (Value & Volume) 2024 & 2032
                                                              58. Figure 58: Middle East & Africa Aircraft Tugs Market Revenue (Million), by Price Trend Analysis 2024 & 2032
                                                              59. Figure 59: Middle East & Africa Aircraft Tugs Market Revenue Share (%), by Price Trend Analysis 2024 & 2032
                                                              60. Figure 60: Middle East & Africa Aircraft Tugs Market Revenue (Million), by Country 2024 & 2032
                                                              61. Figure 61: Middle East & Africa Aircraft Tugs Market Revenue Share (%), by Country 2024 & 2032
                                                              62. Figure 62: Asia Pacific Aircraft Tugs Market Revenue (Million), by Production Analysis 2024 & 2032
                                                              63. Figure 63: Asia Pacific Aircraft Tugs Market Revenue Share (%), by Production Analysis 2024 & 2032
                                                              64. Figure 64: Asia Pacific Aircraft Tugs Market Revenue (Million), by Consumption Analysis 2024 & 2032
                                                              65. Figure 65: Asia Pacific Aircraft Tugs Market Revenue Share (%), by Consumption Analysis 2024 & 2032
                                                              66. Figure 66: Asia Pacific Aircraft Tugs Market Revenue (Million), by Import Market Analysis (Value & Volume) 2024 & 2032
                                                              67. Figure 67: Asia Pacific Aircraft Tugs Market Revenue Share (%), by Import Market Analysis (Value & Volume) 2024 & 2032
                                                              68. Figure 68: Asia Pacific Aircraft Tugs Market Revenue (Million), by Export Market Analysis (Value & Volume) 2024 & 2032
                                                              69. Figure 69: Asia Pacific Aircraft Tugs Market Revenue Share (%), by Export Market Analysis (Value & Volume) 2024 & 2032
                                                              70. Figure 70: Asia Pacific Aircraft Tugs Market Revenue (Million), by Price Trend Analysis 2024 & 2032
                                                              71. Figure 71: Asia Pacific Aircraft Tugs Market Revenue Share (%), by Price Trend Analysis 2024 & 2032
                                                              72. Figure 72: Asia Pacific Aircraft Tugs Market Revenue (Million), by Country 2024 & 2032
                                                              73. Figure 73: Asia Pacific Aircraft Tugs Market Revenue Share (%), by Country 2024 & 2032

                                                              List of Tables

                                                              1. Table 1: Global Aircraft Tugs Market Revenue Million Forecast, by Region 2019 & 2032
                                                              2. Table 2: Global Aircraft Tugs Market Revenue Million Forecast, by Production Analysis 2019 & 2032
                                                              3. Table 3: Global Aircraft Tugs Market Revenue Million Forecast, by Consumption Analysis 2019 & 2032
                                                              4. Table 4: Global Aircraft Tugs Market Revenue Million Forecast, by Import Market Analysis (Value & Volume) 2019 & 2032
                                                              5. Table 5: Global Aircraft Tugs Market Revenue Million Forecast, by Export Market Analysis (Value & Volume) 2019 & 2032
                                                              6. Table 6: Global Aircraft Tugs Market Revenue Million Forecast, by Price Trend Analysis 2019 & 2032
                                                              7. Table 7: Global Aircraft Tugs Market Revenue Million Forecast, by Region 2019 & 2032
                                                              8. Table 8: Global Aircraft Tugs Market Revenue Million Forecast, by Country 2019 & 2032
                                                              9. Table 9: United States Aircraft Tugs Market Revenue (Million) Forecast, by Application 2019 & 2032
                                                              10. Table 10: Canada Aircraft Tugs Market Revenue (Million) Forecast, by Application 2019 & 2032
                                                              11. Table 11: Mexico Aircraft Tugs Market Revenue (Million) Forecast, by Application 2019 & 2032
                                                              12. Table 12: Global Aircraft Tugs Market Revenue Million Forecast, by Country 2019 & 2032
                                                              13. Table 13: Germany Aircraft Tugs Market Revenue (Million) Forecast, by Application 2019 & 2032
                                                              14. Table 14: United Kingdom Aircraft Tugs Market Revenue (Million) Forecast, by Application 2019 & 2032
                                                              15. Table 15: France Aircraft Tugs Market Revenue (Million) Forecast, by Application 2019 & 2032
                                                              16. Table 16: Spain Aircraft Tugs Market Revenue (Million) Forecast, by Application 2019 & 2032
                                                              17. Table 17: Italy Aircraft Tugs Market Revenue (Million) Forecast, by Application 2019 & 2032
                                                              18. Table 18: Spain Aircraft Tugs Market Revenue (Million) Forecast, by Application 2019 & 2032
                                                              19. Table 19: Belgium Aircraft Tugs Market Revenue (Million) Forecast, by Application 2019 & 2032
                                                              20. Table 20: Netherland Aircraft Tugs Market Revenue (Million) Forecast, by Application 2019 & 2032
                                                              21. Table 21: Nordics Aircraft Tugs Market Revenue (Million) Forecast, by Application 2019 & 2032
                                                              22. Table 22: Rest of Europe Aircraft Tugs Market Revenue (Million) Forecast, by Application 2019 & 2032
                                                              23. Table 23: Global Aircraft Tugs Market Revenue Million Forecast, by Country 2019 & 2032
                                                              24. Table 24: China Aircraft Tugs Market Revenue (Million) Forecast, by Application 2019 & 2032
                                                              25. Table 25: Japan Aircraft Tugs Market Revenue (Million) Forecast, by Application 2019 & 2032
                                                              26. Table 26: India Aircraft Tugs Market Revenue (Million) Forecast, by Application 2019 & 2032
                                                              27. Table 27: South Korea Aircraft Tugs Market Revenue (Million) Forecast, by Application 2019 & 2032
                                                              28. Table 28: Southeast Asia Aircraft Tugs Market Revenue (Million) Forecast, by Application 2019 & 2032
                                                              29. Table 29: Australia Aircraft Tugs Market Revenue (Million) Forecast, by Application 2019 & 2032
                                                              30. Table 30: Indonesia Aircraft Tugs Market Revenue (Million) Forecast, by Application 2019 & 2032
                                                              31. Table 31: Phillipes Aircraft Tugs Market Revenue (Million) Forecast, by Application 2019 & 2032
                                                              32. Table 32: Singapore Aircraft Tugs Market Revenue (Million) Forecast, by Application 2019 & 2032
                                                              33. Table 33: Thailandc Aircraft Tugs Market Revenue (Million) Forecast, by Application 2019 & 2032
                                                              34. Table 34: Rest of Asia Pacific Aircraft Tugs Market Revenue (Million) Forecast, by Application 2019 & 2032
                                                              35. Table 35: Global Aircraft Tugs Market Revenue Million Forecast, by Country 2019 & 2032
                                                              36. Table 36: Brazil Aircraft Tugs Market Revenue (Million) Forecast, by Application 2019 & 2032
                                                              37. Table 37: Argentina Aircraft Tugs Market Revenue (Million) Forecast, by Application 2019 & 2032
                                                              38. Table 38: Peru Aircraft Tugs Market Revenue (Million) Forecast, by Application 2019 & 2032
                                                              39. Table 39: Chile Aircraft Tugs Market Revenue (Million) Forecast, by Application 2019 & 2032
                                                              40. Table 40: Colombia Aircraft Tugs Market Revenue (Million) Forecast, by Application 2019 & 2032
                                                              41. Table 41: Ecuador Aircraft Tugs Market Revenue (Million) Forecast, by Application 2019 & 2032
                                                              42. Table 42: Venezuela Aircraft Tugs Market Revenue (Million) Forecast, by Application 2019 & 2032
                                                              43. Table 43: Rest of South America Aircraft Tugs Market Revenue (Million) Forecast, by Application 2019 & 2032
                                                              44. Table 44: Global Aircraft Tugs Market Revenue Million Forecast, by Country 2019 & 2032
                                                              45. Table 45: United States Aircraft Tugs Market Revenue (Million) Forecast, by Application 2019 & 2032
                                                              46. Table 46: Canada Aircraft Tugs Market Revenue (Million) Forecast, by Application 2019 & 2032
                                                              47. Table 47: Mexico Aircraft Tugs Market Revenue (Million) Forecast, by Application 2019 & 2032
                                                              48. Table 48: Global Aircraft Tugs Market Revenue Million Forecast, by Country 2019 & 2032
                                                              49. Table 49: United Arab Emirates Aircraft Tugs Market Revenue (Million) Forecast, by Application 2019 & 2032
                                                              50. Table 50: Saudi Arabia Aircraft Tugs Market Revenue (Million) Forecast, by Application 2019 & 2032
                                                              51. Table 51: South Africa Aircraft Tugs Market Revenue (Million) Forecast, by Application 2019 & 2032
                                                              52. Table 52: Rest of Middle East and Africa Aircraft Tugs Market Revenue (Million) Forecast, by Application 2019 & 2032
                                                              53. Table 53: Global Aircraft Tugs Market Revenue Million Forecast, by Production Analysis 2019 & 2032
                                                              54. Table 54: Global Aircraft Tugs Market Revenue Million Forecast, by Consumption Analysis 2019 & 2032
                                                              55. Table 55: Global Aircraft Tugs Market Revenue Million Forecast, by Import Market Analysis (Value & Volume) 2019 & 2032
                                                              56. Table 56: Global Aircraft Tugs Market Revenue Million Forecast, by Export Market Analysis (Value & Volume) 2019 & 2032
                                                              57. Table 57: Global Aircraft Tugs Market Revenue Million Forecast, by Price Trend Analysis 2019 & 2032
                                                              58. Table 58: Global Aircraft Tugs Market Revenue Million Forecast, by Country 2019 & 2032
                                                              59. Table 59: United States Aircraft Tugs Market Revenue (Million) Forecast, by Application 2019 & 2032
                                                              60. Table 60: Canada Aircraft Tugs Market Revenue (Million) Forecast, by Application 2019 & 2032
                                                              61. Table 61: Mexico Aircraft Tugs Market Revenue (Million) Forecast, by Application 2019 & 2032
                                                              62. Table 62: Global Aircraft Tugs Market Revenue Million Forecast, by Production Analysis 2019 & 2032
                                                              63. Table 63: Global Aircraft Tugs Market Revenue Million Forecast, by Consumption Analysis 2019 & 2032
                                                              64. Table 64: Global Aircraft Tugs Market Revenue Million Forecast, by Import Market Analysis (Value & Volume) 2019 & 2032
                                                              65. Table 65: Global Aircraft Tugs Market Revenue Million Forecast, by Export Market Analysis (Value & Volume) 2019 & 2032
                                                              66. Table 66: Global Aircraft Tugs Market Revenue Million Forecast, by Price Trend Analysis 2019 & 2032
                                                              67. Table 67: Global Aircraft Tugs Market Revenue Million Forecast, by Country 2019 & 2032
                                                              68. Table 68: Brazil Aircraft Tugs Market Revenue (Million) Forecast, by Application 2019 & 2032
                                                              69. Table 69: Argentina Aircraft Tugs Market Revenue (Million) Forecast, by Application 2019 & 2032
                                                              70. Table 70: Rest of South America Aircraft Tugs Market Revenue (Million) Forecast, by Application 2019 & 2032
                                                              71. Table 71: Global Aircraft Tugs Market Revenue Million Forecast, by Production Analysis 2019 & 2032
                                                              72. Table 72: Global Aircraft Tugs Market Revenue Million Forecast, by Consumption Analysis 2019 & 2032
                                                              73. Table 73: Global Aircraft Tugs Market Revenue Million Forecast, by Import Market Analysis (Value & Volume) 2019 & 2032
                                                              74. Table 74: Global Aircraft Tugs Market Revenue Million Forecast, by Export Market Analysis (Value & Volume) 2019 & 2032
                                                              75. Table 75: Global Aircraft Tugs Market Revenue Million Forecast, by Price Trend Analysis 2019 & 2032
                                                              76. Table 76: Global Aircraft Tugs Market Revenue Million Forecast, by Country 2019 & 2032
                                                              77. Table 77: United Kingdom Aircraft Tugs Market Revenue (Million) Forecast, by Application 2019 & 2032
                                                              78. Table 78: Germany Aircraft Tugs Market Revenue (Million) Forecast, by Application 2019 & 2032
                                                              79. Table 79: France Aircraft Tugs Market Revenue (Million) Forecast, by Application 2019 & 2032
                                                              80. Table 80: Italy Aircraft Tugs Market Revenue (Million) Forecast, by Application 2019 & 2032
                                                              81. Table 81: Spain Aircraft Tugs Market Revenue (Million) Forecast, by Application 2019 & 2032
                                                              82. Table 82: Russia Aircraft Tugs Market Revenue (Million) Forecast, by Application 2019 & 2032
                                                              83. Table 83: Benelux Aircraft Tugs Market Revenue (Million) Forecast, by Application 2019 & 2032
                                                              84. Table 84: Nordics Aircraft Tugs Market Revenue (Million) Forecast, by Application 2019 & 2032
                                                              85. Table 85: Rest of Europe Aircraft Tugs Market Revenue (Million) Forecast, by Application 2019 & 2032
                                                              86. Table 86: Global Aircraft Tugs Market Revenue Million Forecast, by Production Analysis 2019 & 2032
                                                              87. Table 87: Global Aircraft Tugs Market Revenue Million Forecast, by Consumption Analysis 2019 & 2032
                                                              88. Table 88: Global Aircraft Tugs Market Revenue Million Forecast, by Import Market Analysis (Value & Volume) 2019 & 2032
                                                              89. Table 89: Global Aircraft Tugs Market Revenue Million Forecast, by Export Market Analysis (Value & Volume) 2019 & 2032
                                                              90. Table 90: Global Aircraft Tugs Market Revenue Million Forecast, by Price Trend Analysis 2019 & 2032
                                                              91. Table 91: Global Aircraft Tugs Market Revenue Million Forecast, by Country 2019 & 2032
                                                              92. Table 92: Turkey Aircraft Tugs Market Revenue (Million) Forecast, by Application 2019 & 2032
                                                              93. Table 93: Israel Aircraft Tugs Market Revenue (Million) Forecast, by Application 2019 & 2032
                                                              94. Table 94: GCC Aircraft Tugs Market Revenue (Million) Forecast, by Application 2019 & 2032
                                                              95. Table 95: North Africa Aircraft Tugs Market Revenue (Million) Forecast, by Application 2019 & 2032
                                                              96. Table 96: South Africa Aircraft Tugs Market Revenue (Million) Forecast, by Application 2019 & 2032
                                                              97. Table 97: Rest of Middle East & Africa Aircraft Tugs Market Revenue (Million) Forecast, by Application 2019 & 2032
                                                              98. Table 98: Global Aircraft Tugs Market Revenue Million Forecast, by Production Analysis 2019 & 2032
                                                              99. Table 99: Global Aircraft Tugs Market Revenue Million Forecast, by Consumption Analysis 2019 & 2032
                                                              100. Table 100: Global Aircraft Tugs Market Revenue Million Forecast, by Import Market Analysis (Value & Volume) 2019 & 2032
                                                              101. Table 101: Global Aircraft Tugs Market Revenue Million Forecast, by Export Market Analysis (Value & Volume) 2019 & 2032
                                                              102. Table 102: Global Aircraft Tugs Market Revenue Million Forecast, by Price Trend Analysis 2019 & 2032
                                                              103. Table 103: Global Aircraft Tugs Market Revenue Million Forecast, by Country 2019 & 2032
                                                              104. Table 104: China Aircraft Tugs Market Revenue (Million) Forecast, by Application 2019 & 2032
                                                              105. Table 105: India Aircraft Tugs Market Revenue (Million) Forecast, by Application 2019 & 2032
                                                              106. Table 106: Japan Aircraft Tugs Market Revenue (Million) Forecast, by Application 2019 & 2032
                                                              107. Table 107: South Korea Aircraft Tugs Market Revenue (Million) Forecast, by Application 2019 & 2032
                                                              108. Table 108: ASEAN Aircraft Tugs Market Revenue (Million) Forecast, by Application 2019 & 2032
                                                              109. Table 109: Oceania Aircraft Tugs Market Revenue (Million) Forecast, by Application 2019 & 2032
                                                              110. Table 110: Rest of Asia Pacific Aircraft Tugs Market Revenue (Million) Forecast, by Application 2019 & 2032


                                                              Frequently Asked Questions

                                                              1. What is the projected Compound Annual Growth Rate (CAGR) of the Aircraft Tugs Market?

                                                              The projected CAGR is approximately 7.25%.

                                                              2. Which companies are prominent players in the Aircraft Tugs Market?

                                                              Key companies in the market include Goldhofer AG, Kalmar Motor AB, Fresia SP, LEKTRO Inc, TREPEL Airport Equipment GmbH, Tronair Inc, John Bean Technologies Corp, Tinka Resources Limited, Textron Inc (Ground Support Equipment Inc ), Airtug LLC, MULAG, MOTOTOK.

                                                              3. What are the main segments of the Aircraft Tugs Market?

                                                              The market segments include Production Analysis, Consumption Analysis, Import Market Analysis (Value & Volume), Export Market Analysis (Value & Volume), Price Trend Analysis.

                                                              4. Can you provide details about the market size?

                                                              The market size is estimated to be USD 5.14 Million as of 2022.

                                                              5. What are some drivers contributing to market growth?

                                                              Increase in Internet of Things (IoT) and Autonomous Systems; Rise in Demand for Military and Defense Satellite Communication Solutions.

                                                              6. What are the notable trends driving market growth?

                                                              Electric Segment is Anticipated to Register the Highest CAGR During the Forecast Period.

                                                              7. Are there any restraints impacting market growth?

                                                              Cybersecurity Threats to Satellite Communication; Interference in Transmission of Data.

                                                              8. Can you provide examples of recent developments in the market?

                                                              June 2023: Lokpriyo Gopinath Bordoloi International Airport launched its first electric vehicle tug to handle ground operations.

                                                              9. What pricing options are available for accessing the report?

                                                              Pricing options include single-user, multi-user, and enterprise licenses priced at USD 4750, USD 5250, and USD 8750 respectively.

                                                              10. Is the market size provided in terms of value or volume?

                                                              The market size is provided in terms of value, measured in Million.

                                                              11. Are there any specific market keywords associated with the report?

                                                              Yes, the market keyword associated with the report is "Aircraft Tugs Market," which aids in identifying and referencing the specific market segment covered.

                                                              12. How do I determine which pricing option suits my needs best?

                                                              The pricing options vary based on user requirements and access needs. Individual users may opt for single-user licenses, while businesses requiring broader access may choose multi-user or enterprise licenses for cost-effective access to the report.

                                                              13. Are there any additional resources or data provided in the Aircraft Tugs Market report?

                                                              While the report offers comprehensive insights, it's advisable to review the specific contents or supplementary materials provided to ascertain if additional resources or data are available.

                                                              14. How can I stay updated on further developments or reports in the Aircraft Tugs Market?

                                                              To stay informed about further developments, trends, and reports in the Aircraft Tugs Market, consider subscribing to industry newsletters, following relevant companies and organizations, or regularly checking reputable industry news sources and publications.


                                                              Methodology

                                                              Step 1 - Identification of Relevant Samples Size from Population Database

                                                              Step Chart
                                                              Bar Chart
                                                              Method Chart

                                                              Step 2 - Approaches for Defining Global Market Size (Value, Volume* & Price*)

                                                              Approach Chart
                                                              Top-down and bottom-up approaches are used to validate the global market size and estimate the market size for manufactures, regional segments, product, and application.

                                                              Note*: In applicable scenarios

                                                              Step 3 - Data Sources

                                                              Primary Research

                                                              • Web Analytics
                                                              • Survey Reports
                                                              • Research Institute
                                                              • Latest Research Reports
                                                              • Opinion Leaders

                                                              Secondary Research

                                                              • Annual Reports
                                                              • White Paper
                                                              • Latest Press Release
                                                              • Industry Association
                                                              • Paid Database
                                                              • Investor Presentations
                                                              Analyst Chart

                                                              Step 4 - Data Triangulation

                                                              Involves using different sources of information in order to increase the validity of a study

                                                              These sources are likely to be stakeholders in a program - participants, other researchers, program staff, other community members, and so on.

                                                              Then we put all data in single framework & apply various statistical tools to find out the dynamic on the market.

                                                              During the analysis stage, feedback from the stakeholder groups would be compared to determine areas of agreement as well as areas of divergence

                                                              Additionally, after gathering mixed and scattered data from a wide range of sources, data is triangulated and correlated to come up with estimated figures which are further validated through primary mediums or industry experts, opinion leaders.

                                                              About Report Pinnacle

                                                              Report Pinnacle provides top-tier market research, industry intelligence, and actionable insights for finance, technology, healthcare, and consumer sectors. Our reports empower you to make informed decisions and achieve business success.

                                                              Our expert team combines primary research, data analytics, and industry knowledge to deliver insights you can trust. We offer syndicated reports, custom research, and consulting services tailored to your unique business needs.

                                                              At Report Pinnacle, we are committed to quality, transparency, and client satisfaction. Every report is rigorously validated to ensure accuracy and relevance. Our global perspective and local expertise help you understand both broad trends and detailed market shifts.

                                                              Stay ahead with Report Pinnacle. Subscribe to our newsletter for the latest insights and research highlights, and follow us on social media for real-time updates.

                                                              Report Pinnacle – Your Partner for Reaching the Top in Market Intelligence.

                                                              artwork spiralartwork spiralRelated Reports
                                                              artwork underline

                                                              Strategic Insights for Military Electro-optical and Infrared Systems Market Market Expansion

                                                              The Military Electro-optical and Infrared (EO/IR) Systems market is booming, projected to reach [estimated 2033 value based on CAGR] by 2033. Driven by geopolitical tensions and technological advancements, this report analyzes market size, growth, key players (L3Harris, Raytheon, Thales), and regional trends. Discover insights into the future of EO/IR systems in defense.

                                                              July 2025
                                                              Base Year: 2024
                                                              No Of Pages: 234
                                                              Price: $4750

                                                              Analyzing Drone Camera Market: Opportunities and Growth Patterns 2025-2033

                                                              The drone camera market is booming, projected to reach \$10.96 billion in 2025, with a CAGR of 18.28% through 2033. Explore market drivers, trends, restraints, and key players in this explosive sector. Discover insights into regional market share and future growth projections for high-resolution drone cameras.

                                                              July 2025
                                                              Base Year: 2024
                                                              No Of Pages: 234
                                                              Price: $4750

                                                              Commercial Aircraft Windows and Windshields Industry and Emerging Technologies: Growth Insights 2025-2033

                                                              Discover the booming commercial aircraft windows and windshields market! This in-depth analysis reveals a CAGR exceeding 3%, driven by surging air travel and technological advancements. Explore key players, regional trends, and future growth projections for 2025-2033.

                                                              July 2025
                                                              Base Year: 2024
                                                              No Of Pages: 234
                                                              Price: $4750

                                                              North America Commercial Aviation Market Industry’s Growth Dynamics and Insights

                                                              Discover the North American commercial aviation market's growth trajectory and key players. This in-depth analysis reveals market size, CAGR, and regional breakdowns, highlighting trends and challenges for passenger and freighter aircraft through 2033. Explore market segmentation, competitive landscapes, and future projections.

                                                              July 2025
                                                              Base Year: 2024
                                                              No Of Pages: 197
                                                              Price: $3800

                                                              Future Prospects for Asia-Pacific Commercial Aircraft Cabin Seating Market Growth

                                                              The Asia-Pacific commercial aircraft cabin seating market is booming, projected to reach $XX million by 2033 with a 7.32% CAGR. Driven by rising air travel and economic growth in key nations like China and India, this report analyzes market trends, key players (Safran, Recaro, Expliseat), and regional segmentation. Discover growth opportunities and challenges in this dynamic industry.

                                                              July 2025
                                                              Base Year: 2024
                                                              No Of Pages: 197
                                                              Price: $3800

                                                              Aircraft Health Monitoring Systems Industry 2025-2033 Market Analysis: Trends, Dynamics, and Growth Opportunities

                                                              Discover the booming Aircraft Health Monitoring Systems market! This in-depth analysis reveals a CAGR of 6% through 2033, driven by predictive maintenance, safety regulations, and technological advancements. Explore key players, regional trends, and future growth projections for this dynamic sector.

                                                              July 2025
                                                              Base Year: 2024
                                                              No Of Pages: 234
                                                              Price: $4750

                                                              Aircraft Exhaust Systems Market Industry’s Future Growth Prospects

                                                              The Aircraft Exhaust Systems Market is booming, projected to reach \$1.78 Billion by 2033 with a 6.49% CAGR. Driven by rising air travel and stringent emission regulations, this report analyzes market trends, key players (Safran, Triumph Group, GKN Aerospace), and regional growth (North America, Europe, Asia-Pacific). Discover key insights and future projections for this expanding sector.

                                                              July 2025
                                                              Base Year: 2024
                                                              No Of Pages: 234
                                                              Price: $4750

                                                              Active Protection Systems Market Market’s Growth Catalysts

                                                              The Active Protection Systems (APS) market is booming, projected to reach $7 billion by 2033 with a 6.06% CAGR. This in-depth analysis explores market drivers, trends, restraints, key players (Thales, General Dynamics, Rheinmetall), and regional breakdowns (North America, Europe, Asia-Pacific). Discover the future of military vehicle protection.

                                                              July 2025
                                                              Base Year: 2024
                                                              No Of Pages: 234
                                                              Price: $4750

                                                              Consumer-Centric Trends in Middle-East and Africa Aircraft MRO Industry Industry

                                                              The Middle East & Africa Aircraft MRO market is booming, with a CAGR exceeding 4% through 2033. Driven by rising air travel and fleet expansion, this report analyzes market size, key players (Ethiopian Airlines, Lufthansa Technik AG, etc.), regional trends, and growth opportunities in commercial, military, and general aviation sectors. Discover the challenges and potential within this dynamic industry.

                                                              July 2025
                                                              Base Year: 2024
                                                              No Of Pages: 234
                                                              Price: $4750

                                                              Southeast Asia Commercial Aircraft MRO Market Future-Proof Strategies: Market Trends 2025-2033

                                                              The Southeast Asia Commercial Aircraft MRO market is booming, projected to reach $3.77 billion by 2025, with a CAGR of 11.47%. Discover key drivers, trends, and challenges shaping this dynamic industry, including insights into leading companies and regional market share. Explore growth opportunities in airframe, engine, and component MRO across narrowbody and widebody aircraft.

                                                              July 2025
                                                              Base Year: 2024
                                                              No Of Pages: 234
                                                              Price: $4750

                                                              Turboprop Engine Market Trends and Forecast 2025-2033

                                                              The turboprop engine market is booming, projected to reach \$31.89 billion by 2033 with a CAGR of 3.71%. Explore key drivers, trends, and regional market shares for this high-growth sector, dominated by Honeywell, Safran, and others. Discover the impact of technological advancements and increasing demand for fuel-efficient aircraft.

                                                              July 2025
                                                              Base Year: 2024
                                                              No Of Pages: 234
                                                              Price: $4750

                                                              Unveiling Low Cost Carrier Market Growth Patterns: CAGR Analysis and Forecasts 2025-2033

                                                              Discover the booming low-cost carrier market! Explore its 10% CAGR, key drivers, regional trends, leading companies like Ryanair & Southwest, and future projections to 2033. Get insights into market segmentation, challenges, and opportunities in this dynamic industry.

                                                              July 2025
                                                              Base Year: 2024
                                                              No Of Pages: 234
                                                              Price: $4750

                                                              Commercial Aircraft Floor Panels Market 2025-2033 Analysis: Trends, Competitor Dynamics, and Growth Opportunities

                                                              The global commercial aircraft floor panels market is booming, projected to reach \$392.64 million by 2025 and grow at a CAGR of 4.67% until 2033. Driven by increasing air travel and demand for lightweight, durable materials, key players like Airbus and Boeing are shaping this lucrative sector. Explore market trends, segment analysis, and regional insights.

                                                              July 2025
                                                              Base Year: 2024
                                                              No Of Pages: 234
                                                              Price: $4750

                                                              Electronically Scanned Array Radar Market 2025-2033 Analysis: Trends, Competitor Dynamics, and Growth Opportunities

                                                              The Electronically Scanned Array (ESA) Radar Market is booming, with a CAGR of 6.45%! Discover key trends, leading companies like Raytheon and Thales, and regional market insights in this comprehensive analysis projecting growth to 2033. Learn about active vs. passive ESA, land, air, and sea applications, and the impact of AI and autonomous systems.

                                                              July 2025
                                                              Base Year: 2024
                                                              No Of Pages: 234
                                                              Price: $4750

                                                              Decoding Aircraft Engine Blades Market’s Market Size Potential by 2033

                                                              Discover the booming Aircraft Engine Blades market, projected to surpass $XX million by 2033 with a CAGR exceeding 5.5%! This in-depth analysis explores market drivers, trends, restraints, and key players like Raytheon, GE, and Safran, covering segments like blade type, application, and materials. Get insights into regional market shares and future growth predictions.

                                                              July 2025
                                                              Base Year: 2024
                                                              No Of Pages: 234
                                                              Price: $4750

                                                              Flight Data Monitoring Industry 2025-2033 Market Analysis: Trends, Dynamics, and Growth Opportunities

                                                              The Flight Data Monitoring (FDM) market is booming, exceeding a $1.5 Billion valuation in 2025 and projected for significant growth through 2033. Discover key drivers, trends, and regional market shares in this in-depth analysis covering major players and technological advancements in flight safety and operational efficiency.

                                                              July 2025
                                                              Base Year: 2024
                                                              No Of Pages: 234
                                                              Price: $4750

                                                              Military Transport Aircraft Market Market Expansion: Growth Outlook 2025-2033

                                                              The Military Transport Aircraft Market is booming, projected to reach $43.56 billion by 2033 with a 7.09% CAGR. Discover key drivers, trends, and regional insights, including major players like Boeing and Lockheed Martin. Analyze market segmentation and future growth projections in this comprehensive report.

                                                              July 2025
                                                              Base Year: 2024
                                                              No Of Pages: 234
                                                              Price: $4750

                                                              Analyzing Competitor Moves: Eastern Europe Defense Market Growth Outlook 2025-2033

                                                              The Eastern European defense market is booming, projected to reach [estimated 2033 value] by 2033, driven by geopolitical tensions and modernization efforts. Discover key trends, growth drivers, and leading companies shaping this dynamic sector.

                                                              July 2025
                                                              Base Year: 2024
                                                              No Of Pages: 210
                                                              Price: $4750

                                                              LEO Satellite Market Analysis 2025 and Forecasts 2033: Unveiling Growth Opportunities

                                                              Discover the booming LEO Satellite market! This in-depth analysis reveals a 3.52% CAGR, key drivers, trends, and restraints, examining segments by application (communication, Earth observation), satellite mass, end-user, and propulsion technology. Explore leading companies like SpaceX and Airbus and regional market shares. Project your strategic moves with our comprehensive forecast to 2033.

                                                              July 2025
                                                              Base Year: 2024
                                                              No Of Pages: 197
                                                              Price: $3800

                                                              Space Sensors And Actuators Market Soars to XXX Million, witnessing a CAGR of XX during the forecast period 2025-2033

                                                              The Space Sensors and Actuators market is booming, projected to reach $8.84 billion by 2033 with a 13.40% CAGR. Explore key drivers, trends, and regional insights in this comprehensive market analysis, featuring leading companies like Honeywell and Moog. Discover the growth potential across segments like satellites, rovers, and launch vehicles.

                                                              July 2025
                                                              Base Year: 2024
                                                              No Of Pages: 234
                                                              Price: $4750
                                                              • Home
                                                              • About Us
                                                              • Industries
                                                                • Aerospace & Defense
                                                                • Agriculture
                                                                • Animal Nutrition & Wellness
                                                                • Automotive
                                                                • Chemicals & Materials
                                                                • Consumer Goods and Services
                                                                • Energy & Power
                                                                • Financial Services and Investment Intelligence
                                                                • Food & Beverage
                                                                • Home and Property Improvement
                                                                • Hospitality and Tourism
                                                                • Logistics
                                                                • Manufacturing Products and Services
                                                                • Packaging
                                                                • Professional and Commercial Services
                                                                • Real Estate and Construction
                                                                • Retail
                                                                • Technology, Media and Telecom
                                                                • Healthcare
                                                              • Services
                                                              • Contact
                                                              Main Logo
                                                              • Home
                                                              • About Us
                                                              • Industries
                                                                • Aerospace & Defense
                                                                • Agriculture
                                                                • Animal Nutrition & Wellness
                                                                • Automotive
                                                                • Chemicals & Materials
                                                                • Consumer Goods and Services
                                                                • Energy & Power
                                                                • Financial Services and Investment Intelligence
                                                                • Food & Beverage
                                                                • Home and Property Improvement
                                                                • Hospitality and Tourism
                                                                • Logistics
                                                                • Manufacturing Products and Services
                                                                • Packaging
                                                                • Professional and Commercial Services
                                                                • Real Estate and Construction
                                                                • Retail
                                                                • Technology, Media and Telecom
                                                                • Healthcare
                                                              • Services
                                                              • Contact
                                                              +17162654855
                                                              [email protected]

                                                              +17162654855

                                                              [email protected]

                                                              Business Address

                                                              Head Office

                                                              Office no. A 5010, fifth floor, Solitaire Business Hub, Near Phoenix mall, Pune, Maharashtra 411014

                                                              Contact Information

                                                              Craig Francis

                                                              Business Development Head

                                                              +17162654855

                                                              [email protected]

                                                              Connect With Us

                                                              Secure Payment Partners

                                                              payment image
                                                              RetailLogisticsPackagingAutomotiveHealthcareAgricultureEnergy & PowerFood & BeverageAerospace & DefenseChemicals & MaterialsHospitality and TourismAnimal Nutrition & WellnessConsumer Goods and ServicesReal Estate and ConstructionHome and Property ImprovementTechnology, Media and TelecomManufacturing Products and ServicesFinancial Services and Investment Intelligence

                                                              © 2025 All rights reserved


                                                              Privacy Policy
                                                              Terms and Conditions
                                                              FAQ