

Key Insights
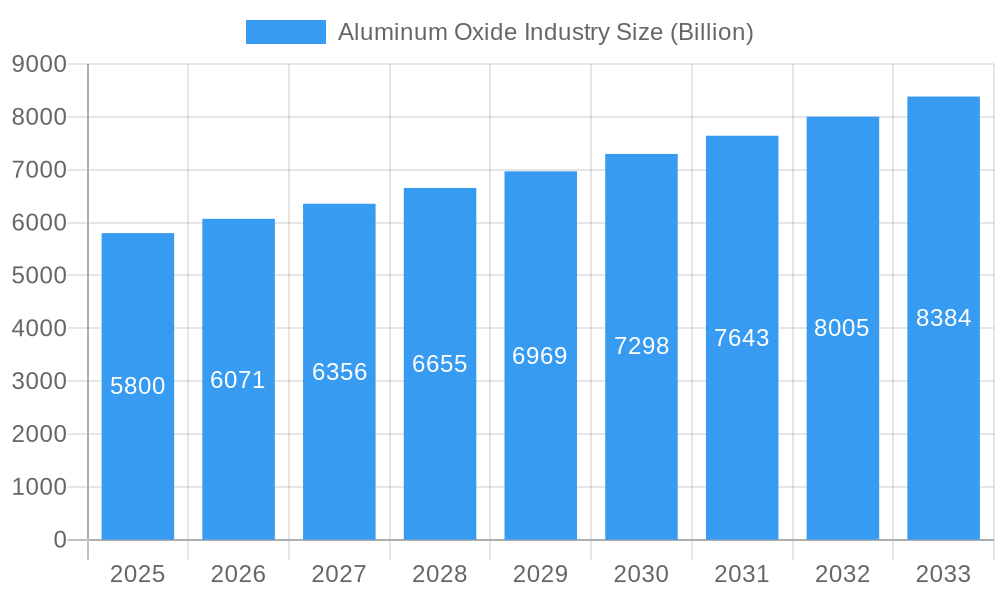
The global aluminum oxide market, valued at $5.8 billion in 2025, is projected to experience robust growth, driven by increasing demand from key sectors. The market's Compound Annual Growth Rate (CAGR) of 4.7% from 2025 to 2033 indicates a steady expansion, primarily fueled by the flourishing aluminum smelting and engineered ceramics industries. The rising construction and infrastructure development globally further bolsters demand for high-quality aluminum oxide refractories and abrasives. Technological advancements in nanoparticle and powder production are leading to the development of novel applications in advanced materials, contributing to market growth. However, fluctuating aluminum prices and the availability of alternative materials pose potential restraints. The market is segmented by form type (nanoparticles, powder, pellets, tablets, sputtering targets) and application (aluminum smelting, abrasives, aluminum chemicals, engineered ceramics, refractories). Leading players such as Emirates Global Aluminum, East Hope Group, and Alcoa Corporation are actively shaping market dynamics through strategic investments in research and development and expansion into new geographic markets. Regional variations in growth rates are anticipated, with Asia-Pacific, particularly China and India, expected to dominate due to their strong industrial growth and infrastructure projects. North America and Europe will continue to hold significant market shares, driven by technological advancements and established industrial bases. The diverse applications and ongoing innovations promise a sustained period of growth for the aluminum oxide market.
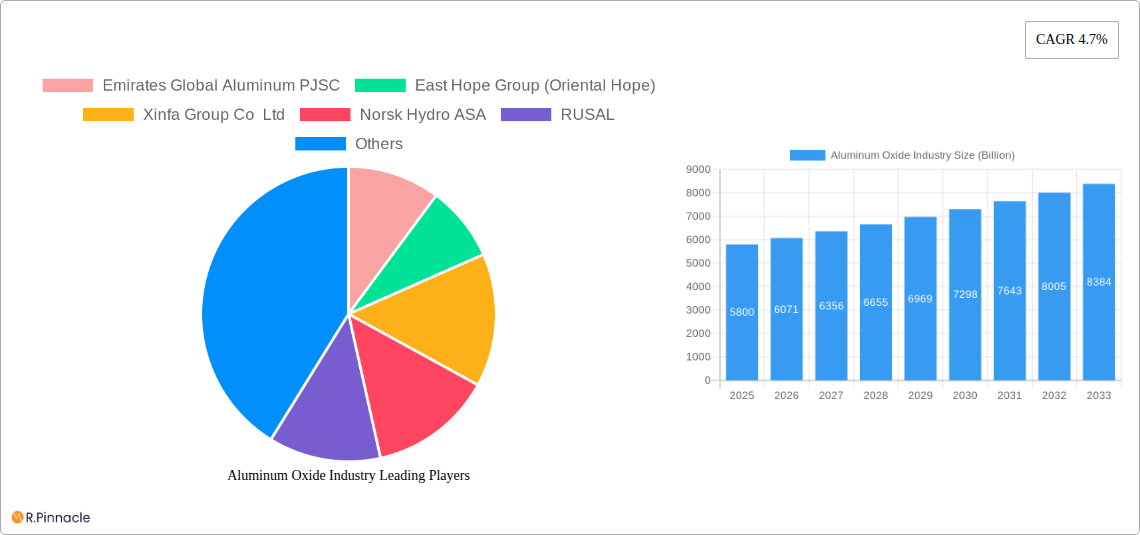
Aluminum Oxide Industry Market Size (In Billion)
The competitive landscape is characterized by a mix of large multinational corporations and regional players. Strategic partnerships, mergers and acquisitions, and technological collaborations are common strategies employed by market participants to gain a competitive edge. The increasing focus on sustainability and the development of eco-friendly production methods are also shaping market trends. The market's future trajectory depends on various factors including government policies related to infrastructure development, the price of raw materials, and advancements in manufacturing technologies. Continued investment in research and development is expected to unlock new applications and drive further growth in the coming years. Market players are increasingly focusing on providing customized solutions tailored to specific industry needs, further enhancing the market's dynamism and competitiveness.
Aluminum Oxide Industry Company Market Share
Aluminum Oxide Industry: A Comprehensive Market Report (2019-2033)
This in-depth report provides a comprehensive analysis of the global Aluminum Oxide industry, offering invaluable insights for industry professionals, investors, and strategic decision-makers. With a study period spanning 2019-2033, a base year of 2025, and a forecast period of 2025-2033, this report leverages extensive market data to deliver actionable intelligence and future projections. The market size is predicted to reach xx Billion by 2033.
Aluminum Oxide Industry Market Structure & Innovation Trends
This section analyzes the competitive landscape of the Aluminum Oxide industry, examining market concentration, innovation drivers, regulatory frameworks, and mergers & acquisitions (M&A) activities. The industry exhibits a moderately concentrated structure, with key players like Alcoa Corporation, RUSAL, and CHALCO holding significant market share. However, the presence of numerous regional players indicates a dynamic competitive environment.
- Market Concentration: The top 5 players account for approximately xx% of the global market share in 2025.
- Innovation Drivers: The demand for high-performance materials in diverse applications, coupled with ongoing R&D efforts focusing on enhanced product properties (e.g., improved purity, particle size control), are key innovation drivers.
- Regulatory Frameworks: Stringent environmental regulations concerning emissions and waste management significantly impact production costs and operational strategies.
- Product Substitutes: While direct substitutes are limited, advancements in alternative materials are creating competitive pressure.
- End-User Demographics: Key end-use sectors include aluminum smelting, abrasives, refractories, and engineered ceramics. The growth of these sectors directly influences Aluminum Oxide demand.
- M&A Activities: Recent years have witnessed several significant M&A deals, valued at approximately xx Billion collectively, driven by strategic expansion and consolidation within the industry. These activities reshape the competitive landscape and market share distribution.
Aluminum Oxide Industry Market Dynamics & Trends
This section explores the key factors shaping the Aluminum Oxide market's trajectory. Market growth is primarily driven by increasing demand from the construction, automotive, and electronics industries. Technological advancements, particularly in materials science and nanotechnology, are leading to the development of novel Aluminum Oxide products with improved properties. Consumer preferences are shifting towards sustainable and eco-friendly materials, influencing the demand for Aluminum Oxide produced with lower carbon footprints. Competitive dynamics are characterized by price competition, innovation, and strategic partnerships. The market is expected to exhibit a CAGR of xx% during the forecast period (2025-2033). Market penetration in emerging economies is projected to increase significantly, driven by infrastructural development and industrialization.
Dominant Regions & Segments in Aluminum Oxide Industry
This section highlights the leading regions and segments within the Aluminum Oxide market. Asia-Pacific is the dominant region, driven by robust economic growth and expanding industrialization in countries like China and India. The powder segment holds the largest market share in terms of structural form, owing to its widespread applications across various industries. Aluminum smelting remains the largest application segment due to its indispensable role in aluminum production.
Key Drivers for Asia-Pacific Dominance:
- Rapid industrialization and urbanization.
- Growing construction and infrastructure projects.
- Significant investments in manufacturing facilities.
- Favorable government policies supporting industrial growth.
Powder Segment Dominance: The versatility and cost-effectiveness of powder Aluminum Oxide make it the most widely used form across various applications.
Aluminum Smelting Application: This segment's dominance stems from the fundamental role of Aluminum Oxide in aluminum production.
Aluminum Oxide Industry Product Innovations
Recent innovations focus on developing high-purity Aluminum Oxide with tailored particle size and morphology for specific applications. Nanoparticles and specialized coatings are gaining traction due to their enhanced properties, such as improved strength, thermal conductivity, and wear resistance. These advancements cater to the evolving needs of various industries, creating a competitive advantage for manufacturers who can deliver superior product performance.
Report Scope & Segmentation Analysis
This report segments the Aluminum Oxide market based on structural form (Nanoparticles, Powder, Pellets, Tablets, Sputtering Targets) and application (Aluminum Smelting, Abrasive, Aluminum Chemicals, Engineered Ceramics, Refractories). Each segment's growth projection, market size, and competitive dynamics are analyzed extensively, providing detailed insights into market trends and opportunities. For example, the Nanoparticles segment is expected to witness high growth due to its use in advanced technologies, while the Aluminum Smelting segment remains the largest, driven by the aluminum industry's expansion.
Key Drivers of Aluminum Oxide Industry Growth
The Aluminum Oxide industry's growth is driven by several factors: burgeoning demand from the construction and automotive sectors, technological advancements in materials science leading to enhanced product properties, and the increasing adoption of Aluminum Oxide in high-tech applications such as electronics and aerospace. Favorable government policies promoting industrial development in several countries also contribute to market expansion.
Challenges in the Aluminum Oxide Industry Sector
The Aluminum Oxide industry faces challenges, including fluctuating raw material prices, stringent environmental regulations, and intense competition from alternative materials. Supply chain disruptions can significantly impact production costs and availability, and maintaining consistent product quality while meeting stringent environmental standards presents ongoing operational hurdles.
Emerging Opportunities in Aluminum Oxide Industry
Emerging opportunities lie in the development of specialized Aluminum Oxide materials for niche applications, particularly in the burgeoning nanotechnology and renewable energy sectors. The increasing adoption of sustainable manufacturing practices also presents opportunities for environmentally conscious manufacturers. Expansion into new geographical markets with growing industrial activity offers significant growth potential.
Leading Players in the Aluminum Oxide Industry Market
- Emirates Global Aluminum PJSC
- East Hope Group (Oriental Hope)
- Xinfa Group Co Ltd
- Norsk Hydro ASA
- RUSAL
- NALCO India
- Hindalco Industries Limited (Aditya Birla Group)
- Sasol
- Rio Tinto
- South
- Hangzhou Jinjiang Group Co Ltd
- Aluminum Corporation of China Limited (CHALCO)
- China Hongqiao Group Limited
- Alcoa Corporation
Key Developments in Aluminum Oxide Industry
- June 2022: Alcoa announced a USD 51 million project to increase production capacity at its plant in Mosjoen, Norway, aiming for a 214,000-ton increase by the end of 2026. This expansion reflects growing market demand and Alcoa's strategic investment in production capacity.
- October 2022: Rio Tinto partnered with the Canadian government, investing up to USD 537 million over eight years to decarbonize its RTFT operations and establish a critical minerals processing center of excellence. This initiative highlights the industry's focus on sustainability and decarbonization efforts.
Future Outlook for Aluminum Oxide Industry Market
The Aluminum Oxide market is poised for robust growth, driven by increasing demand from key end-use sectors and ongoing technological advancements. The focus on sustainability and the development of innovative, high-performance materials will continue to shape market dynamics. Strategic partnerships and investments in R&D will play a crucial role in shaping the future landscape of the Aluminum Oxide industry.
Aluminum Oxide Industry Segmentation
-
1. Structural Form Type
- 1.1. Nanoparticles
- 1.2. Powder
- 1.3. Pellets
- 1.4. Tablets
- 1.5. Sputtering Targets
-
2. Application
- 2.1. Aluminum Smelting
- 2.2. Abrasive
- 2.3. Aluminum Chemicals
- 2.4. Engineered Ceramics
- 2.5. Refractories
Aluminum Oxide Industry Segmentation By Geography
-
1. Asia Pacific
- 1.1. China
- 1.2. India
- 1.3. Japan
- 1.4. South Korea
- 1.5. Rest of Asia Pacific
-
2. North America
- 2.1. United States
- 2.2. Canada
- 2.3. Mexico
-
3. Europe
- 3.1. Germany
- 3.2. United Kingdom
- 3.3. France
- 3.4. Italy
- 3.5. Rest of Europe
-
4. South America
- 4.1. Brazil
- 4.2. Argentina
- 4.3. Rest of South America
-
5. Middle East and Africa
- 5.1. Saudi Arabia
- 5.2. South Africa
- 5.3. Rest of Middle East and Africa
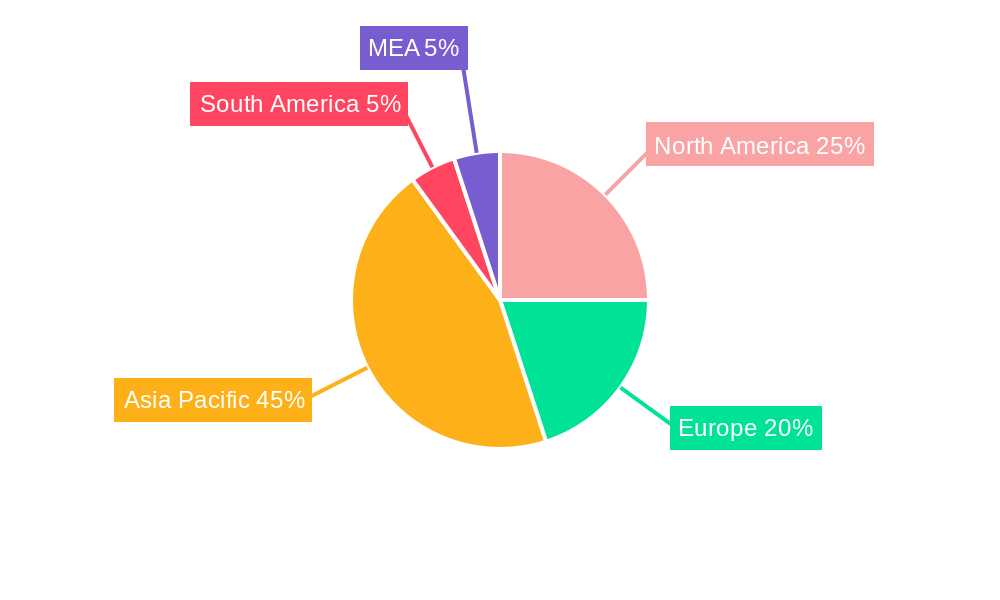
Aluminum Oxide Industry Regional Market Share
Geographic Coverage of Aluminum Oxide Industry
Aluminum Oxide Industry REPORT HIGHLIGHTS
| Aspects | Details |
|---|---|
| Study Period | 2020-2034 |
| Base Year | 2025 |
| Estimated Year | 2026 |
| Forecast Period | 2026-2034 |
| Historical Period | 2020-2025 |
| Growth Rate | CAGR of 4.7% from 2020-2034 |
| Segmentation |
|
Table of Contents
- 1. Introduction
- 1.1. Research Scope
- 1.2. Market Segmentation
- 1.3. Research Objective
- 1.4. Definitions and Assumptions
- 2. Executive Summary
- 2.1. Market Snapshot
- 3. Market Dynamics
- 3.1. Market Drivers
- 3.2. Market Restrains
- 3.3. Market Trends
- 3.4. Market Opportunities
- 4. Market Factor Analysis
- 4.1. Porters Five Forces
- 4.1.1. Bargaining Power of Suppliers
- 4.1.2. Bargaining Power of Buyers
- 4.1.3. Threat of New Entrants
- 4.1.4. Threat of Substitutes
- 4.1.5. Competitive Rivalry
- 4.2. PESTEL analysis
- 4.3. BCG Analysis
- 4.3.1. Stars (High Growth, High Market Share)
- 4.3.2. Cash Cows (Low Growth, High Market Share)
- 4.3.3. Question Mark (High Growth, Low Market Share)
- 4.3.4. Dogs (Low Growth, Low Market Share)
- 4.4. Ansoff Matrix Analysis
- 4.5. Supply Chain Analysis
- 4.6. Regulatory Landscape
- 4.7. Current Market Potential and Opportunity Assessment (TAM–SAM–SOM Framework)
- 4.8. PRI Analyst Note
- 4.1. Porters Five Forces
- 5. Market Analysis, Insights and Forecast 2021-2033
- 5.1. Market Analysis, Insights and Forecast - by Structural Form Type
- 5.1.1. Nanoparticles
- 5.1.2. Powder
- 5.1.3. Pellets
- 5.1.4. Tablets
- 5.1.5. Sputtering Targets
- 5.2. Market Analysis, Insights and Forecast - by Application
- 5.2.1. Aluminum Smelting
- 5.2.2. Abrasive
- 5.2.3. Aluminum Chemicals
- 5.2.4. Engineered Ceramics
- 5.2.5. Refractories
- 5.3. Market Analysis, Insights and Forecast - by Region
- 5.3.1. Asia Pacific
- 5.3.2. North America
- 5.3.3. Europe
- 5.3.4. South America
- 5.3.5. Middle East and Africa
- 5.1. Market Analysis, Insights and Forecast - by Structural Form Type
- 6. Global Aluminum Oxide Industry Analysis, Insights and Forecast, 2021-2033
- 6.1. Market Analysis, Insights and Forecast - by Structural Form Type
- 6.1.1. Nanoparticles
- 6.1.2. Powder
- 6.1.3. Pellets
- 6.1.4. Tablets
- 6.1.5. Sputtering Targets
- 6.2. Market Analysis, Insights and Forecast - by Application
- 6.2.1. Aluminum Smelting
- 6.2.2. Abrasive
- 6.2.3. Aluminum Chemicals
- 6.2.4. Engineered Ceramics
- 6.2.5. Refractories
- 6.1. Market Analysis, Insights and Forecast - by Structural Form Type
- 7. Asia Pacific Aluminum Oxide Industry Analysis, Insights and Forecast, 2020-2032
- 7.1. Market Analysis, Insights and Forecast - by Structural Form Type
- 7.1.1. Nanoparticles
- 7.1.2. Powder
- 7.1.3. Pellets
- 7.1.4. Tablets
- 7.1.5. Sputtering Targets
- 7.2. Market Analysis, Insights and Forecast - by Application
- 7.2.1. Aluminum Smelting
- 7.2.2. Abrasive
- 7.2.3. Aluminum Chemicals
- 7.2.4. Engineered Ceramics
- 7.2.5. Refractories
- 7.1. Market Analysis, Insights and Forecast - by Structural Form Type
- 8. North America Aluminum Oxide Industry Analysis, Insights and Forecast, 2020-2032
- 8.1. Market Analysis, Insights and Forecast - by Structural Form Type
- 8.1.1. Nanoparticles
- 8.1.2. Powder
- 8.1.3. Pellets
- 8.1.4. Tablets
- 8.1.5. Sputtering Targets
- 8.2. Market Analysis, Insights and Forecast - by Application
- 8.2.1. Aluminum Smelting
- 8.2.2. Abrasive
- 8.2.3. Aluminum Chemicals
- 8.2.4. Engineered Ceramics
- 8.2.5. Refractories
- 8.1. Market Analysis, Insights and Forecast - by Structural Form Type
- 9. Europe Aluminum Oxide Industry Analysis, Insights and Forecast, 2020-2032
- 9.1. Market Analysis, Insights and Forecast - by Structural Form Type
- 9.1.1. Nanoparticles
- 9.1.2. Powder
- 9.1.3. Pellets
- 9.1.4. Tablets
- 9.1.5. Sputtering Targets
- 9.2. Market Analysis, Insights and Forecast - by Application
- 9.2.1. Aluminum Smelting
- 9.2.2. Abrasive
- 9.2.3. Aluminum Chemicals
- 9.2.4. Engineered Ceramics
- 9.2.5. Refractories
- 9.1. Market Analysis, Insights and Forecast - by Structural Form Type
- 10. South America Aluminum Oxide Industry Analysis, Insights and Forecast, 2020-2032
- 10.1. Market Analysis, Insights and Forecast - by Structural Form Type
- 10.1.1. Nanoparticles
- 10.1.2. Powder
- 10.1.3. Pellets
- 10.1.4. Tablets
- 10.1.5. Sputtering Targets
- 10.2. Market Analysis, Insights and Forecast - by Application
- 10.2.1. Aluminum Smelting
- 10.2.2. Abrasive
- 10.2.3. Aluminum Chemicals
- 10.2.4. Engineered Ceramics
- 10.2.5. Refractories
- 10.1. Market Analysis, Insights and Forecast - by Structural Form Type
- 11. Middle East and Africa Aluminum Oxide Industry Analysis, Insights and Forecast, 2020-2032
- 11.1. Market Analysis, Insights and Forecast - by Structural Form Type
- 11.1.1. Nanoparticles
- 11.1.2. Powder
- 11.1.3. Pellets
- 11.1.4. Tablets
- 11.1.5. Sputtering Targets
- 11.2. Market Analysis, Insights and Forecast - by Application
- 11.2.1. Aluminum Smelting
- 11.2.2. Abrasive
- 11.2.3. Aluminum Chemicals
- 11.2.4. Engineered Ceramics
- 11.2.5. Refractories
- 11.1. Market Analysis, Insights and Forecast - by Structural Form Type
- 12. Competitive Analysis
- 12.1. Company Profiles
- 12.1.1 Emirates Global Aluminum PJSC
- 12.1.1.1. Company Overview
- 12.1.1.2. Products
- 12.1.1.3. Company Financials
- 12.1.1.4. SWOT Analysis
- 12.1.2 East Hope Group (Oriental Hope)
- 12.1.2.1. Company Overview
- 12.1.2.2. Products
- 12.1.2.3. Company Financials
- 12.1.2.4. SWOT Analysis
- 12.1.3 Xinfa Group Co Ltd
- 12.1.3.1. Company Overview
- 12.1.3.2. Products
- 12.1.3.3. Company Financials
- 12.1.3.4. SWOT Analysis
- 12.1.4 Norsk Hydro ASA
- 12.1.4.1. Company Overview
- 12.1.4.2. Products
- 12.1.4.3. Company Financials
- 12.1.4.4. SWOT Analysis
- 12.1.5 RUSAL
- 12.1.5.1. Company Overview
- 12.1.5.2. Products
- 12.1.5.3. Company Financials
- 12.1.5.4. SWOT Analysis
- 12.1.6 NALCO India
- 12.1.6.1. Company Overview
- 12.1.6.2. Products
- 12.1.6.3. Company Financials
- 12.1.6.4. SWOT Analysis
- 12.1.7 Hindalco Industries Limited (Aditya Birla Group)
- 12.1.7.1. Company Overview
- 12.1.7.2. Products
- 12.1.7.3. Company Financials
- 12.1.7.4. SWOT Analysis
- 12.1.8 Sasol
- 12.1.8.1. Company Overview
- 12.1.8.2. Products
- 12.1.8.3. Company Financials
- 12.1.8.4. SWOT Analysis
- 12.1.9 Rio Tinto
- 12.1.9.1. Company Overview
- 12.1.9.2. Products
- 12.1.9.3. Company Financials
- 12.1.9.4. SWOT Analysis
- 12.1.10 South
- 12.1.10.1. Company Overview
- 12.1.10.2. Products
- 12.1.10.3. Company Financials
- 12.1.10.4. SWOT Analysis
- 12.1.11 Hangzhou Jinjiang Group Co Ltd
- 12.1.11.1. Company Overview
- 12.1.11.2. Products
- 12.1.11.3. Company Financials
- 12.1.11.4. SWOT Analysis
- 12.1.12 Aluminum Corporation of China Limited (CHALCO)
- 12.1.12.1. Company Overview
- 12.1.12.2. Products
- 12.1.12.3. Company Financials
- 12.1.12.4. SWOT Analysis
- 12.1.13 China Hongqiao Group Limited
- 12.1.13.1. Company Overview
- 12.1.13.2. Products
- 12.1.13.3. Company Financials
- 12.1.13.4. SWOT Analysis
- 12.1.14 Alcoa Corporation
- 12.1.14.1. Company Overview
- 12.1.14.2. Products
- 12.1.14.3. Company Financials
- 12.1.14.4. SWOT Analysis
- 12.1.1 Emirates Global Aluminum PJSC
- 12.2. Market Entropy
- 12.2.1 Company's Key Areas Served
- 12.2.2 Recent Developments
- 12.3. Company Market Share Analysis 2025
- 12.3.1 Top 5 Companies Market Share Analysis
- 12.3.2 Top 3 Companies Market Share Analysis
- 12.4. List of Potential Customers
- 13. Research Methodology
List of Figures
- Figure 1: Global Aluminum Oxide Industry Revenue Breakdown (Billion, %) by Region 2025 & 2033
- Figure 2: Global Aluminum Oxide Industry Volume Breakdown (K Tons, %) by Region 2025 & 2033
- Figure 3: Asia Pacific Aluminum Oxide Industry Revenue (Billion), by Structural Form Type 2025 & 2033
- Figure 4: Asia Pacific Aluminum Oxide Industry Volume (K Tons), by Structural Form Type 2025 & 2033
- Figure 5: Asia Pacific Aluminum Oxide Industry Revenue Share (%), by Structural Form Type 2025 & 2033
- Figure 6: Asia Pacific Aluminum Oxide Industry Volume Share (%), by Structural Form Type 2025 & 2033
- Figure 7: Asia Pacific Aluminum Oxide Industry Revenue (Billion), by Application 2025 & 2033
- Figure 8: Asia Pacific Aluminum Oxide Industry Volume (K Tons), by Application 2025 & 2033
- Figure 9: Asia Pacific Aluminum Oxide Industry Revenue Share (%), by Application 2025 & 2033
- Figure 10: Asia Pacific Aluminum Oxide Industry Volume Share (%), by Application 2025 & 2033
- Figure 11: Asia Pacific Aluminum Oxide Industry Revenue (Billion), by Country 2025 & 2033
- Figure 12: Asia Pacific Aluminum Oxide Industry Volume (K Tons), by Country 2025 & 2033
- Figure 13: Asia Pacific Aluminum Oxide Industry Revenue Share (%), by Country 2025 & 2033
- Figure 14: Asia Pacific Aluminum Oxide Industry Volume Share (%), by Country 2025 & 2033
- Figure 15: North America Aluminum Oxide Industry Revenue (Billion), by Structural Form Type 2025 & 2033
- Figure 16: North America Aluminum Oxide Industry Volume (K Tons), by Structural Form Type 2025 & 2033
- Figure 17: North America Aluminum Oxide Industry Revenue Share (%), by Structural Form Type 2025 & 2033
- Figure 18: North America Aluminum Oxide Industry Volume Share (%), by Structural Form Type 2025 & 2033
- Figure 19: North America Aluminum Oxide Industry Revenue (Billion), by Application 2025 & 2033
- Figure 20: North America Aluminum Oxide Industry Volume (K Tons), by Application 2025 & 2033
- Figure 21: North America Aluminum Oxide Industry Revenue Share (%), by Application 2025 & 2033
- Figure 22: North America Aluminum Oxide Industry Volume Share (%), by Application 2025 & 2033
- Figure 23: North America Aluminum Oxide Industry Revenue (Billion), by Country 2025 & 2033
- Figure 24: North America Aluminum Oxide Industry Volume (K Tons), by Country 2025 & 2033
- Figure 25: North America Aluminum Oxide Industry Revenue Share (%), by Country 2025 & 2033
- Figure 26: North America Aluminum Oxide Industry Volume Share (%), by Country 2025 & 2033
- Figure 27: Europe Aluminum Oxide Industry Revenue (Billion), by Structural Form Type 2025 & 2033
- Figure 28: Europe Aluminum Oxide Industry Volume (K Tons), by Structural Form Type 2025 & 2033
- Figure 29: Europe Aluminum Oxide Industry Revenue Share (%), by Structural Form Type 2025 & 2033
- Figure 30: Europe Aluminum Oxide Industry Volume Share (%), by Structural Form Type 2025 & 2033
- Figure 31: Europe Aluminum Oxide Industry Revenue (Billion), by Application 2025 & 2033
- Figure 32: Europe Aluminum Oxide Industry Volume (K Tons), by Application 2025 & 2033
- Figure 33: Europe Aluminum Oxide Industry Revenue Share (%), by Application 2025 & 2033
- Figure 34: Europe Aluminum Oxide Industry Volume Share (%), by Application 2025 & 2033
- Figure 35: Europe Aluminum Oxide Industry Revenue (Billion), by Country 2025 & 2033
- Figure 36: Europe Aluminum Oxide Industry Volume (K Tons), by Country 2025 & 2033
- Figure 37: Europe Aluminum Oxide Industry Revenue Share (%), by Country 2025 & 2033
- Figure 38: Europe Aluminum Oxide Industry Volume Share (%), by Country 2025 & 2033
- Figure 39: South America Aluminum Oxide Industry Revenue (Billion), by Structural Form Type 2025 & 2033
- Figure 40: South America Aluminum Oxide Industry Volume (K Tons), by Structural Form Type 2025 & 2033
- Figure 41: South America Aluminum Oxide Industry Revenue Share (%), by Structural Form Type 2025 & 2033
- Figure 42: South America Aluminum Oxide Industry Volume Share (%), by Structural Form Type 2025 & 2033
- Figure 43: South America Aluminum Oxide Industry Revenue (Billion), by Application 2025 & 2033
- Figure 44: South America Aluminum Oxide Industry Volume (K Tons), by Application 2025 & 2033
- Figure 45: South America Aluminum Oxide Industry Revenue Share (%), by Application 2025 & 2033
- Figure 46: South America Aluminum Oxide Industry Volume Share (%), by Application 2025 & 2033
- Figure 47: South America Aluminum Oxide Industry Revenue (Billion), by Country 2025 & 2033
- Figure 48: South America Aluminum Oxide Industry Volume (K Tons), by Country 2025 & 2033
- Figure 49: South America Aluminum Oxide Industry Revenue Share (%), by Country 2025 & 2033
- Figure 50: South America Aluminum Oxide Industry Volume Share (%), by Country 2025 & 2033
- Figure 51: Middle East and Africa Aluminum Oxide Industry Revenue (Billion), by Structural Form Type 2025 & 2033
- Figure 52: Middle East and Africa Aluminum Oxide Industry Volume (K Tons), by Structural Form Type 2025 & 2033
- Figure 53: Middle East and Africa Aluminum Oxide Industry Revenue Share (%), by Structural Form Type 2025 & 2033
- Figure 54: Middle East and Africa Aluminum Oxide Industry Volume Share (%), by Structural Form Type 2025 & 2033
- Figure 55: Middle East and Africa Aluminum Oxide Industry Revenue (Billion), by Application 2025 & 2033
- Figure 56: Middle East and Africa Aluminum Oxide Industry Volume (K Tons), by Application 2025 & 2033
- Figure 57: Middle East and Africa Aluminum Oxide Industry Revenue Share (%), by Application 2025 & 2033
- Figure 58: Middle East and Africa Aluminum Oxide Industry Volume Share (%), by Application 2025 & 2033
- Figure 59: Middle East and Africa Aluminum Oxide Industry Revenue (Billion), by Country 2025 & 2033
- Figure 60: Middle East and Africa Aluminum Oxide Industry Volume (K Tons), by Country 2025 & 2033
- Figure 61: Middle East and Africa Aluminum Oxide Industry Revenue Share (%), by Country 2025 & 2033
- Figure 62: Middle East and Africa Aluminum Oxide Industry Volume Share (%), by Country 2025 & 2033
List of Tables
- Table 1: Global Aluminum Oxide Industry Revenue Billion Forecast, by Structural Form Type 2020 & 2033
- Table 2: Global Aluminum Oxide Industry Volume K Tons Forecast, by Structural Form Type 2020 & 2033
- Table 3: Global Aluminum Oxide Industry Revenue Billion Forecast, by Application 2020 & 2033
- Table 4: Global Aluminum Oxide Industry Volume K Tons Forecast, by Application 2020 & 2033
- Table 5: Global Aluminum Oxide Industry Revenue Billion Forecast, by Region 2020 & 2033
- Table 6: Global Aluminum Oxide Industry Volume K Tons Forecast, by Region 2020 & 2033
- Table 7: Global Aluminum Oxide Industry Revenue Billion Forecast, by Structural Form Type 2020 & 2033
- Table 8: Global Aluminum Oxide Industry Volume K Tons Forecast, by Structural Form Type 2020 & 2033
- Table 9: Global Aluminum Oxide Industry Revenue Billion Forecast, by Application 2020 & 2033
- Table 10: Global Aluminum Oxide Industry Volume K Tons Forecast, by Application 2020 & 2033
- Table 11: Global Aluminum Oxide Industry Revenue Billion Forecast, by Country 2020 & 2033
- Table 12: Global Aluminum Oxide Industry Volume K Tons Forecast, by Country 2020 & 2033
- Table 13: China Aluminum Oxide Industry Revenue (Billion) Forecast, by Application 2020 & 2033
- Table 14: China Aluminum Oxide Industry Volume (K Tons) Forecast, by Application 2020 & 2033
- Table 15: India Aluminum Oxide Industry Revenue (Billion) Forecast, by Application 2020 & 2033
- Table 16: India Aluminum Oxide Industry Volume (K Tons) Forecast, by Application 2020 & 2033
- Table 17: Japan Aluminum Oxide Industry Revenue (Billion) Forecast, by Application 2020 & 2033
- Table 18: Japan Aluminum Oxide Industry Volume (K Tons) Forecast, by Application 2020 & 2033
- Table 19: South Korea Aluminum Oxide Industry Revenue (Billion) Forecast, by Application 2020 & 2033
- Table 20: South Korea Aluminum Oxide Industry Volume (K Tons) Forecast, by Application 2020 & 2033
- Table 21: Rest of Asia Pacific Aluminum Oxide Industry Revenue (Billion) Forecast, by Application 2020 & 2033
- Table 22: Rest of Asia Pacific Aluminum Oxide Industry Volume (K Tons) Forecast, by Application 2020 & 2033
- Table 23: Global Aluminum Oxide Industry Revenue Billion Forecast, by Structural Form Type 2020 & 2033
- Table 24: Global Aluminum Oxide Industry Volume K Tons Forecast, by Structural Form Type 2020 & 2033
- Table 25: Global Aluminum Oxide Industry Revenue Billion Forecast, by Application 2020 & 2033
- Table 26: Global Aluminum Oxide Industry Volume K Tons Forecast, by Application 2020 & 2033
- Table 27: Global Aluminum Oxide Industry Revenue Billion Forecast, by Country 2020 & 2033
- Table 28: Global Aluminum Oxide Industry Volume K Tons Forecast, by Country 2020 & 2033
- Table 29: United States Aluminum Oxide Industry Revenue (Billion) Forecast, by Application 2020 & 2033
- Table 30: United States Aluminum Oxide Industry Volume (K Tons) Forecast, by Application 2020 & 2033
- Table 31: Canada Aluminum Oxide Industry Revenue (Billion) Forecast, by Application 2020 & 2033
- Table 32: Canada Aluminum Oxide Industry Volume (K Tons) Forecast, by Application 2020 & 2033
- Table 33: Mexico Aluminum Oxide Industry Revenue (Billion) Forecast, by Application 2020 & 2033
- Table 34: Mexico Aluminum Oxide Industry Volume (K Tons) Forecast, by Application 2020 & 2033
- Table 35: Global Aluminum Oxide Industry Revenue Billion Forecast, by Structural Form Type 2020 & 2033
- Table 36: Global Aluminum Oxide Industry Volume K Tons Forecast, by Structural Form Type 2020 & 2033
- Table 37: Global Aluminum Oxide Industry Revenue Billion Forecast, by Application 2020 & 2033
- Table 38: Global Aluminum Oxide Industry Volume K Tons Forecast, by Application 2020 & 2033
- Table 39: Global Aluminum Oxide Industry Revenue Billion Forecast, by Country 2020 & 2033
- Table 40: Global Aluminum Oxide Industry Volume K Tons Forecast, by Country 2020 & 2033
- Table 41: Germany Aluminum Oxide Industry Revenue (Billion) Forecast, by Application 2020 & 2033
- Table 42: Germany Aluminum Oxide Industry Volume (K Tons) Forecast, by Application 2020 & 2033
- Table 43: United Kingdom Aluminum Oxide Industry Revenue (Billion) Forecast, by Application 2020 & 2033
- Table 44: United Kingdom Aluminum Oxide Industry Volume (K Tons) Forecast, by Application 2020 & 2033
- Table 45: France Aluminum Oxide Industry Revenue (Billion) Forecast, by Application 2020 & 2033
- Table 46: France Aluminum Oxide Industry Volume (K Tons) Forecast, by Application 2020 & 2033
- Table 47: Italy Aluminum Oxide Industry Revenue (Billion) Forecast, by Application 2020 & 2033
- Table 48: Italy Aluminum Oxide Industry Volume (K Tons) Forecast, by Application 2020 & 2033
- Table 49: Rest of Europe Aluminum Oxide Industry Revenue (Billion) Forecast, by Application 2020 & 2033
- Table 50: Rest of Europe Aluminum Oxide Industry Volume (K Tons) Forecast, by Application 2020 & 2033
- Table 51: Global Aluminum Oxide Industry Revenue Billion Forecast, by Structural Form Type 2020 & 2033
- Table 52: Global Aluminum Oxide Industry Volume K Tons Forecast, by Structural Form Type 2020 & 2033
- Table 53: Global Aluminum Oxide Industry Revenue Billion Forecast, by Application 2020 & 2033
- Table 54: Global Aluminum Oxide Industry Volume K Tons Forecast, by Application 2020 & 2033
- Table 55: Global Aluminum Oxide Industry Revenue Billion Forecast, by Country 2020 & 2033
- Table 56: Global Aluminum Oxide Industry Volume K Tons Forecast, by Country 2020 & 2033
- Table 57: Brazil Aluminum Oxide Industry Revenue (Billion) Forecast, by Application 2020 & 2033
- Table 58: Brazil Aluminum Oxide Industry Volume (K Tons) Forecast, by Application 2020 & 2033
- Table 59: Argentina Aluminum Oxide Industry Revenue (Billion) Forecast, by Application 2020 & 2033
- Table 60: Argentina Aluminum Oxide Industry Volume (K Tons) Forecast, by Application 2020 & 2033
- Table 61: Rest of South America Aluminum Oxide Industry Revenue (Billion) Forecast, by Application 2020 & 2033
- Table 62: Rest of South America Aluminum Oxide Industry Volume (K Tons) Forecast, by Application 2020 & 2033
- Table 63: Global Aluminum Oxide Industry Revenue Billion Forecast, by Structural Form Type 2020 & 2033
- Table 64: Global Aluminum Oxide Industry Volume K Tons Forecast, by Structural Form Type 2020 & 2033
- Table 65: Global Aluminum Oxide Industry Revenue Billion Forecast, by Application 2020 & 2033
- Table 66: Global Aluminum Oxide Industry Volume K Tons Forecast, by Application 2020 & 2033
- Table 67: Global Aluminum Oxide Industry Revenue Billion Forecast, by Country 2020 & 2033
- Table 68: Global Aluminum Oxide Industry Volume K Tons Forecast, by Country 2020 & 2033
- Table 69: Saudi Arabia Aluminum Oxide Industry Revenue (Billion) Forecast, by Application 2020 & 2033
- Table 70: Saudi Arabia Aluminum Oxide Industry Volume (K Tons) Forecast, by Application 2020 & 2033
- Table 71: South Africa Aluminum Oxide Industry Revenue (Billion) Forecast, by Application 2020 & 2033
- Table 72: South Africa Aluminum Oxide Industry Volume (K Tons) Forecast, by Application 2020 & 2033
- Table 73: Rest of Middle East and Africa Aluminum Oxide Industry Revenue (Billion) Forecast, by Application 2020 & 2033
- Table 74: Rest of Middle East and Africa Aluminum Oxide Industry Volume (K Tons) Forecast, by Application 2020 & 2033
Frequently Asked Questions
1. What is the projected Compound Annual Growth Rate (CAGR) of the Aluminum Oxide Industry?
The projected CAGR is approximately 4.7%.
2. Which companies are prominent players in the Aluminum Oxide Industry?
Key companies in the market include Emirates Global Aluminum PJSC, East Hope Group (Oriental Hope), Xinfa Group Co Ltd, Norsk Hydro ASA, RUSAL, NALCO India, Hindalco Industries Limited (Aditya Birla Group), Sasol, Rio Tinto, South, Hangzhou Jinjiang Group Co Ltd, Aluminum Corporation of China Limited (CHALCO), China Hongqiao Group Limited, Alcoa Corporation.
3. What are the main segments of the Aluminum Oxide Industry?
The market segments include Structural Form Type, Application.
4. Can you provide details about the market size?
The market size is estimated to be USD 5.8 Billion as of 2022.
5. What are some drivers contributing to market growth?
High Demand from Pharmaceutical and Industrial Manufacturing Processes; Increasing Demand from Ceramic Industries for Producing Porous Ceramics.
6. What are the notable trends driving market growth?
Aluminum Smelting Segment to Dominate the Market Demand.
7. Are there any restraints impacting market growth?
Increasing Health Risks due to Exposure to Aluminum Oxide; Other Restraints.
8. Can you provide examples of recent developments in the market?
October 2022: Rio Tinto announced that it is partnering with the Government of Canada to invest up to CAD 737 million (USD 537 million) over the next eight years to decarbonize its Rio Tinto Fer et Titane (RTFT) operations in Sorel-Tracy, Québec, and to position the business as a center of excellence for critical minerals processing.
9. What pricing options are available for accessing the report?
Pricing options include single-user, multi-user, and enterprise licenses priced at USD 4750, USD 5250, and USD 8750 respectively.
10. Is the market size provided in terms of value or volume?
The market size is provided in terms of value, measured in Billion and volume, measured in K Tons.
11. Are there any specific market keywords associated with the report?
Yes, the market keyword associated with the report is "Aluminum Oxide Industry," which aids in identifying and referencing the specific market segment covered.
12. How do I determine which pricing option suits my needs best?
The pricing options vary based on user requirements and access needs. Individual users may opt for single-user licenses, while businesses requiring broader access may choose multi-user or enterprise licenses for cost-effective access to the report.
13. Are there any additional resources or data provided in the Aluminum Oxide Industry report?
While the report offers comprehensive insights, it's advisable to review the specific contents or supplementary materials provided to ascertain if additional resources or data are available.
14. How can I stay updated on further developments or reports in the Aluminum Oxide Industry?
To stay informed about further developments, trends, and reports in the Aluminum Oxide Industry, consider subscribing to industry newsletters, following relevant companies and organizations, or regularly checking reputable industry news sources and publications.
Methodology
Step 1 - Identification of Relevant Samples Size from Population Database


Step 2 - Approaches for Defining Global Market Size (Value, Volume* & Price*)

Note*: In applicable scenarios
Step 3 - Data Sources
Primary Research
- Web Analytics
- Survey Reports
- Research Institute
- Latest Research Reports
- Opinion Leaders
Secondary Research
- Annual Reports
- White Paper
- Latest Press Release
- Industry Association
- Paid Database
- Investor Presentations

Step 4 - Data Triangulation
Involves using different sources of information in order to increase the validity of a study
These sources are likely to be stakeholders in a program - participants, other researchers, program staff, other community members, and so on.
Then we put all data in single framework & apply various statistical tools to find out the dynamic on the market.
During the analysis stage, feedback from the stakeholder groups would be compared to determine areas of agreement as well as areas of divergence