

Key Insights
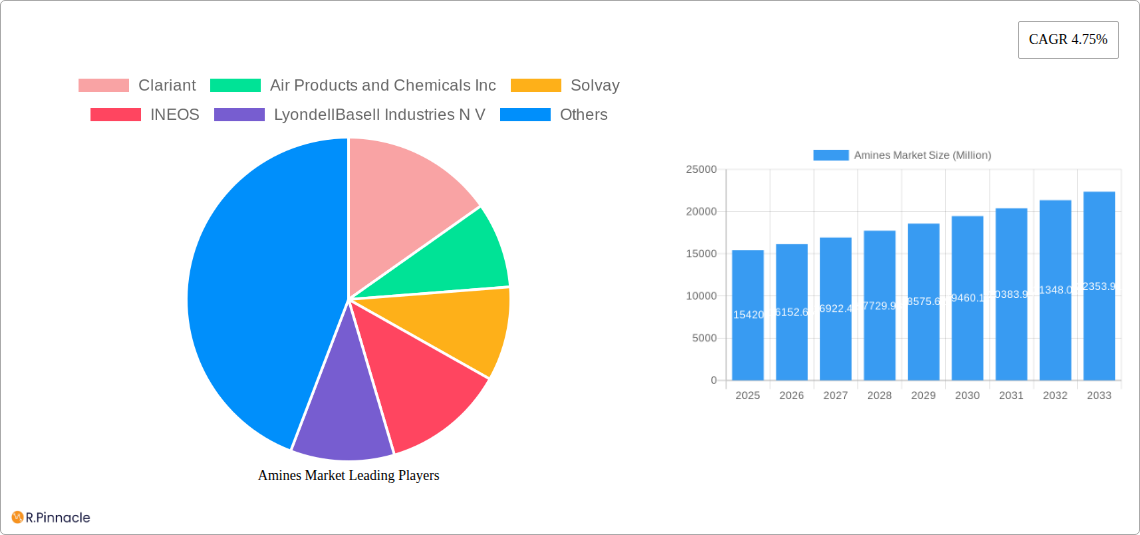
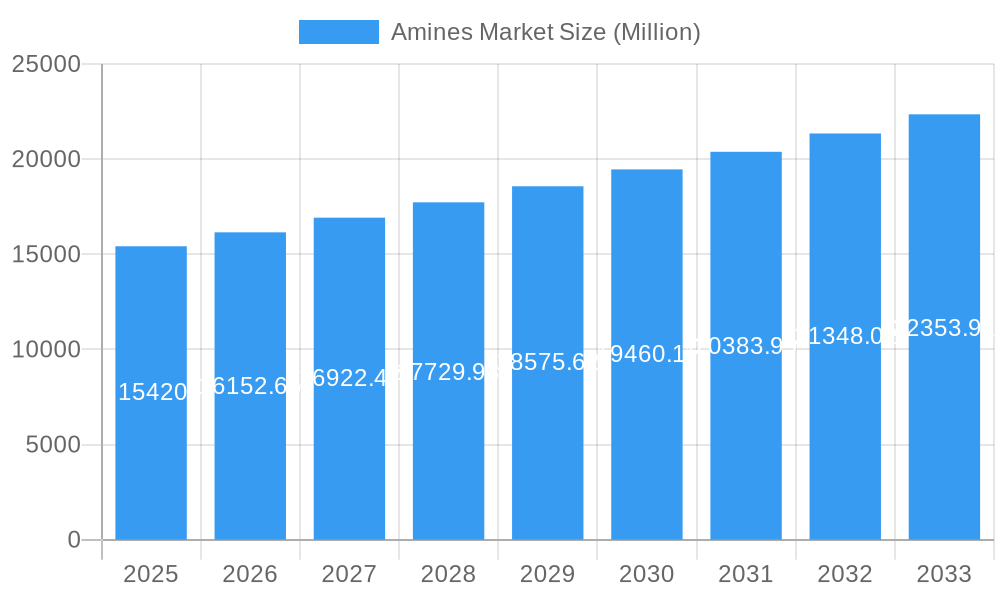
The global amines market, valued at $15.42 billion in 2025, is projected to experience robust growth, exhibiting a compound annual growth rate (CAGR) of 4.75% from 2025 to 2033. This expansion is driven by increasing demand across diverse end-use sectors, including the burgeoning personal care, cleaning products, and adhesives industries. The rising adoption of amines in rubber manufacturing for enhanced elasticity and durability further fuels market growth. Technological advancements leading to the development of more efficient and sustainable amine production processes are also contributing positively to market expansion. Specifically, the growing preference for eco-friendly alternatives in various applications is driving demand for bio-based amines. The Asia-Pacific region, particularly China and India, is expected to dominate the market owing to substantial industrial growth and expanding manufacturing sectors in these economies. However, fluctuations in raw material prices and stringent environmental regulations pose challenges to market growth. The market is segmented by type (ethyleneamines, alkylamines, fatty amines, specialty amines, ethanolamines) and end-use (rubber, personal care products, cleaning products, adhesives, paints and resins, agrochemicals, oil and petrochemicals, other end-uses). Leading players like Clariant, Air Products and Chemicals, Solvay, and INEOS are strategically investing in research and development to maintain their competitive edge and capitalize on emerging market opportunities.
Amines Market Market Size (In Billion)
The diverse applications of amines across various industries ensures consistent market demand. Growth in the construction sector, particularly in developing economies, further stimulates the demand for amines in adhesives and paints. The personal care and cleaning product sectors are also witnessing significant growth, driven by increasing disposable incomes and changing consumer preferences. However, concerns regarding the potential health and environmental impacts of certain amine types are prompting manufacturers to explore and adopt safer alternatives. This shift toward sustainable practices is expected to reshape the market landscape, favoring manufacturers who prioritize environmentally benign amine production and formulations. Furthermore, strategic collaborations and mergers & acquisitions within the industry are likely to shape the competitive dynamics in the coming years. The market's future growth trajectory will be influenced by the interplay between these factors, necessitating continuous innovation and adaptation by market players.
Amines Market Company Market Share
Amines Market Report: A Comprehensive Analysis (2019-2033)
This in-depth report provides a comprehensive analysis of the Amines Market, offering invaluable insights for industry professionals, investors, and strategic decision-makers. The report covers the period from 2019 to 2033, with a focus on the forecast period 2025-2033 and a base year of 2025. Expect detailed segmentation analysis, competitive landscape mapping, and future growth projections, all underpinned by rigorous market research. The report's key findings are presented in a clear, concise manner, allowing for easy understanding and actionable strategies.
Amines Market Structure & Innovation Trends
This section analyzes the Amines Market's structure, focusing on market concentration, innovation drivers, regulatory landscapes, and competitive activities. The report delves into the dynamics of mergers and acquisitions (M&A), providing insights into deal values and their impact on market share. Key aspects covered include:
- Market Concentration: Analysis of market share held by key players such as Clariant, Air Products and Chemicals Inc, Solvay, INEOS, and others. (Specific market share percentages will be detailed in the full report). The report assesses the level of competition and identifies dominant players.
- Innovation Drivers: Examination of technological advancements, research and development activities, and their influence on product development and market growth. This includes an assessment of the role of sustainability in driving innovation.
- Regulatory Frameworks: A detailed overview of relevant regulations and their implications for market participants, including environmental regulations and safety standards.
- Product Substitutes: An analysis of potential substitute products and their impact on market competition and growth.
- End-User Demographics: Analysis of the end-user industries driving demand, including their growth prospects and preferences.
- M&A Activities: Review of significant M&A deals within the Amines Market during the historical period, including deal values and their impact on market consolidation. Examples include (but are not limited to) XX Million dollar deals in XX and XX Million dollar deals in XX.
Amines Market Dynamics & Trends
This section provides a comprehensive overview of the Amines Market dynamics, focusing on growth drivers, technological advancements, consumer preferences, and competitive landscapes. The analysis includes projections for Compound Annual Growth Rate (CAGR) and market penetration rates for key segments. The report examines:
- Market Growth Drivers: Factors contributing to market expansion, such as increasing demand from key end-use sectors (e.g., growth in the construction industry driving demand for adhesives and resins).
- Technological Disruptions: Impact of technological advancements on production processes, product development, and market competitiveness. The analysis includes the adoption of sustainable manufacturing practices.
- Consumer Preferences: Shifting consumer preferences towards sustainable and environmentally friendly products, impacting market demand for specific amine types.
- Competitive Dynamics: Analysis of competitive strategies, pricing pressures, and market positioning among key players.
Dominant Regions & Segments in Amines Market
This section identifies the leading regions, countries, and segments within the Amines Market. Detailed analysis focuses on both Type (Ethyleneamines, Alkylamines, Fatty Amines, Specialty Amines, Ethanolamines) and End-use (Rubber, Personal Care products, Cleaning Products, Adhesives, Paints, and Resins, Agro Chemicals, Oil and Petrochemical, Other End-uses) segments.
Key Drivers (Examples):
- Economic Policies: Government incentives and regulations supporting specific industries driving demand for amines.
- Infrastructure Development: Growth in infrastructure projects, positively impacting demand in certain regions.
- Technological Advancements: Region-specific technological advancements enhancing production efficiency and driving growth.
Dominance Analysis: Paragraphs providing in-depth analysis of the leading regions and segments, explaining their market dominance based on factors identified above. (Specific regions and segments with dominance analysis will be provided in the full report).
Amines Market Product Innovations
This section summarizes recent product developments, highlighting technological trends and market fit. The analysis emphasizes new applications and competitive advantages stemming from these innovations. This will detail new product launches and improvements in existing product lines and discuss how these innovations are enhancing the market’s overall performance and appeal to consumers.
Report Scope & Segmentation Analysis
This section details the market segmentation by Type and End-use. Growth projections, market sizes, and competitive dynamics are presented for each segment.
- Type Segmentation: Detailed analysis of each type of amine (Ethyleneamines, Alkylamines, Fatty Amines, Specialty Amines, Ethanolamines), including market size, growth projections, and competitive landscape.
- End-use Segmentation: Similar detailed analysis for each end-use segment (Rubber, Personal Care products, Cleaning Products, Adhesives, Paints, and Resins, Agro Chemicals, Oil and Petrochemical, Other End-uses).
Key Drivers of Amines Market Growth
This section identifies key growth drivers, including technological advancements, economic factors, and supportive regulatory environments. Specific examples will be provided within the full report, illustrating their contribution to market expansion.
Challenges in the Amines Market Sector
This section discusses barriers and restraints affecting market growth. This includes regulatory hurdles, supply chain complexities, and competitive pressures, with quantifiable impacts presented where available.
Emerging Opportunities in Amines Market
This section highlights promising trends and opportunities, focusing on new markets, technological advancements, and evolving consumer preferences.
Leading Players in the Amines Market Market
- Clariant
- Air Products and Chemicals Inc
- Solvay
- INEOS
- LyondellBasell Industries N V
- Celanese Corporation
- Alkyl Amines Chemicals Limited
- INVISTA
- Kemipex
- BASF SE
- Arkema Group
- Huntsman International LLC
- SABIC
- Akzo Nobel N V
- Daicel Corporation
- Mitsubishi Gas Chemical Company Inc
- DowDuPont
- Tosoh Corporation
- List Not Exhaustive
Key Developments in Amines Market Industry
- 2022: LyondellBasell announced the expansion of its amine plant in China to meet growing demand in the Asia-Pacific region.
- 2023: Solvay launched a new range of sustainable amine products designed to reduce environmental impact during manufacturing.
Future Outlook for Amines Market Market
This section summarizes growth accelerators and strategic opportunities, focusing on the future market potential. The analysis will highlight promising areas for investment and expansion within the Amines Market. The report concludes with a summary of key findings and recommendations for market participants.
Amines Market Segmentation
-
1. Type
- 1.1. Ethyleneamines
- 1.2. Alkylamines
- 1.3. Fatty Amines
- 1.4. Specialty Amines
- 1.5. Ethanolamines
-
2. End-use
- 2.1. Rubber
- 2.2. Personal Care products
- 2.3. Cleaning Products
- 2.4. Adhesives, Paints, and Resins
- 2.5. Agro Chemicals
- 2.6. Oil and Petrochemical
- 2.7. Other End-uses
Amines Market Segmentation By Geography
-
1. Asia Pacific
- 1.1. China
- 1.2. India
- 1.3. Japan
- 1.4. South Korea
- 1.5. Australia and New Zealand
- 1.6. Rest of Asia Pacific
-
2. North America
- 2.1. United States
- 2.2. Canada
- 2.3. Mexico
-
3. Europe
- 3.1. Germany
- 3.2. United Kingdom
- 3.3. Italy
- 3.4. France
- 3.5. Rest of Europe
-
4. South America
- 4.1. Brazil
- 4.2. Argentina
- 4.3. Rest of South America
-
5. Middle East and Africa
- 5.1. Saudi Arabia
- 5.2. South Africa
- 5.3. Rest of Middle East and Africa
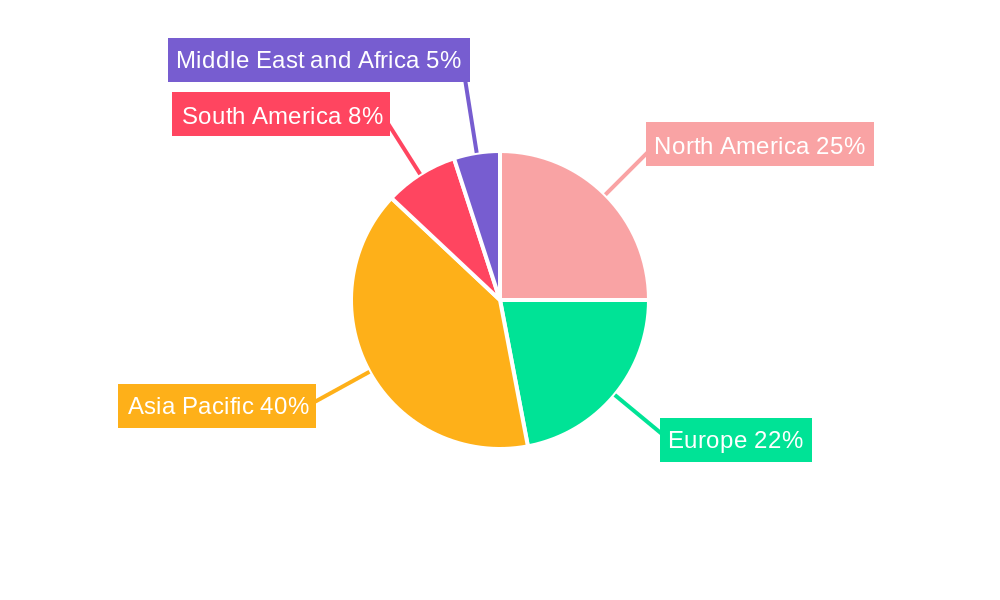
Amines Market Regional Market Share
Geographic Coverage of Amines Market
Amines Market REPORT HIGHLIGHTS
| Aspects | Details |
|---|---|
| Study Period | 2020-2034 |
| Base Year | 2025 |
| Estimated Year | 2026 |
| Forecast Period | 2026-2034 |
| Historical Period | 2020-2025 |
| Growth Rate | CAGR of 4.75% from 2020-2034 |
| Segmentation |
|
Table of Contents
- 1. Introduction
- 1.1. Research Scope
- 1.2. Market Segmentation
- 1.3. Research Objective
- 1.4. Definitions and Assumptions
- 2. Executive Summary
- 2.1. Market Snapshot
- 3. Market Dynamics
- 3.1. Market Drivers
- 3.2. Market Restrains
- 3.3. Market Trends
- 3.4. Market Opportunities
- 4. Market Factor Analysis
- 4.1. Porters Five Forces
- 4.1.1. Bargaining Power of Suppliers
- 4.1.2. Bargaining Power of Buyers
- 4.1.3. Threat of New Entrants
- 4.1.4. Threat of Substitutes
- 4.1.5. Competitive Rivalry
- 4.2. PESTEL analysis
- 4.3. BCG Analysis
- 4.3.1. Stars (High Growth, High Market Share)
- 4.3.2. Cash Cows (Low Growth, High Market Share)
- 4.3.3. Question Mark (High Growth, Low Market Share)
- 4.3.4. Dogs (Low Growth, Low Market Share)
- 4.4. Ansoff Matrix Analysis
- 4.5. Supply Chain Analysis
- 4.6. Regulatory Landscape
- 4.7. Current Market Potential and Opportunity Assessment (TAM–SAM–SOM Framework)
- 4.8. PRI Analyst Note
- 4.1. Porters Five Forces
- 5. Market Analysis, Insights and Forecast 2021-2033
- 5.1. Market Analysis, Insights and Forecast - by Type
- 5.1.1. Ethyleneamines
- 5.1.2. Alkylamines
- 5.1.3. Fatty Amines
- 5.1.4. Specialty Amines
- 5.1.5. Ethanolamines
- 5.2. Market Analysis, Insights and Forecast - by End-use
- 5.2.1. Rubber
- 5.2.2. Personal Care products
- 5.2.3. Cleaning Products
- 5.2.4. Adhesives, Paints, and Resins
- 5.2.5. Agro Chemicals
- 5.2.6. Oil and Petrochemical
- 5.2.7. Other End-uses
- 5.3. Market Analysis, Insights and Forecast - by Region
- 5.3.1. Asia Pacific
- 5.3.2. North America
- 5.3.3. Europe
- 5.3.4. South America
- 5.3.5. Middle East and Africa
- 5.1. Market Analysis, Insights and Forecast - by Type
- 6. Global Amines Market Analysis, Insights and Forecast, 2021-2033
- 6.1. Market Analysis, Insights and Forecast - by Type
- 6.1.1. Ethyleneamines
- 6.1.2. Alkylamines
- 6.1.3. Fatty Amines
- 6.1.4. Specialty Amines
- 6.1.5. Ethanolamines
- 6.2. Market Analysis, Insights and Forecast - by End-use
- 6.2.1. Rubber
- 6.2.2. Personal Care products
- 6.2.3. Cleaning Products
- 6.2.4. Adhesives, Paints, and Resins
- 6.2.5. Agro Chemicals
- 6.2.6. Oil and Petrochemical
- 6.2.7. Other End-uses
- 6.1. Market Analysis, Insights and Forecast - by Type
- 7. Asia Pacific Amines Market Analysis, Insights and Forecast, 2020-2032
- 7.1. Market Analysis, Insights and Forecast - by Type
- 7.1.1. Ethyleneamines
- 7.1.2. Alkylamines
- 7.1.3. Fatty Amines
- 7.1.4. Specialty Amines
- 7.1.5. Ethanolamines
- 7.2. Market Analysis, Insights and Forecast - by End-use
- 7.2.1. Rubber
- 7.2.2. Personal Care products
- 7.2.3. Cleaning Products
- 7.2.4. Adhesives, Paints, and Resins
- 7.2.5. Agro Chemicals
- 7.2.6. Oil and Petrochemical
- 7.2.7. Other End-uses
- 7.1. Market Analysis, Insights and Forecast - by Type
- 8. North America Amines Market Analysis, Insights and Forecast, 2020-2032
- 8.1. Market Analysis, Insights and Forecast - by Type
- 8.1.1. Ethyleneamines
- 8.1.2. Alkylamines
- 8.1.3. Fatty Amines
- 8.1.4. Specialty Amines
- 8.1.5. Ethanolamines
- 8.2. Market Analysis, Insights and Forecast - by End-use
- 8.2.1. Rubber
- 8.2.2. Personal Care products
- 8.2.3. Cleaning Products
- 8.2.4. Adhesives, Paints, and Resins
- 8.2.5. Agro Chemicals
- 8.2.6. Oil and Petrochemical
- 8.2.7. Other End-uses
- 8.1. Market Analysis, Insights and Forecast - by Type
- 9. Europe Amines Market Analysis, Insights and Forecast, 2020-2032
- 9.1. Market Analysis, Insights and Forecast - by Type
- 9.1.1. Ethyleneamines
- 9.1.2. Alkylamines
- 9.1.3. Fatty Amines
- 9.1.4. Specialty Amines
- 9.1.5. Ethanolamines
- 9.2. Market Analysis, Insights and Forecast - by End-use
- 9.2.1. Rubber
- 9.2.2. Personal Care products
- 9.2.3. Cleaning Products
- 9.2.4. Adhesives, Paints, and Resins
- 9.2.5. Agro Chemicals
- 9.2.6. Oil and Petrochemical
- 9.2.7. Other End-uses
- 9.1. Market Analysis, Insights and Forecast - by Type
- 10. South America Amines Market Analysis, Insights and Forecast, 2020-2032
- 10.1. Market Analysis, Insights and Forecast - by Type
- 10.1.1. Ethyleneamines
- 10.1.2. Alkylamines
- 10.1.3. Fatty Amines
- 10.1.4. Specialty Amines
- 10.1.5. Ethanolamines
- 10.2. Market Analysis, Insights and Forecast - by End-use
- 10.2.1. Rubber
- 10.2.2. Personal Care products
- 10.2.3. Cleaning Products
- 10.2.4. Adhesives, Paints, and Resins
- 10.2.5. Agro Chemicals
- 10.2.6. Oil and Petrochemical
- 10.2.7. Other End-uses
- 10.1. Market Analysis, Insights and Forecast - by Type
- 11. Middle East and Africa Amines Market Analysis, Insights and Forecast, 2020-2032
- 11.1. Market Analysis, Insights and Forecast - by Type
- 11.1.1. Ethyleneamines
- 11.1.2. Alkylamines
- 11.1.3. Fatty Amines
- 11.1.4. Specialty Amines
- 11.1.5. Ethanolamines
- 11.2. Market Analysis, Insights and Forecast - by End-use
- 11.2.1. Rubber
- 11.2.2. Personal Care products
- 11.2.3. Cleaning Products
- 11.2.4. Adhesives, Paints, and Resins
- 11.2.5. Agro Chemicals
- 11.2.6. Oil and Petrochemical
- 11.2.7. Other End-uses
- 11.1. Market Analysis, Insights and Forecast - by Type
- 12. Competitive Analysis
- 12.1. Company Profiles
- 12.1.1 Clariant
- 12.1.1.1. Company Overview
- 12.1.1.2. Products
- 12.1.1.3. Company Financials
- 12.1.1.4. SWOT Analysis
- 12.1.2 Air Products and Chemicals Inc
- 12.1.2.1. Company Overview
- 12.1.2.2. Products
- 12.1.2.3. Company Financials
- 12.1.2.4. SWOT Analysis
- 12.1.3 Solvay
- 12.1.3.1. Company Overview
- 12.1.3.2. Products
- 12.1.3.3. Company Financials
- 12.1.3.4. SWOT Analysis
- 12.1.4 INEOS
- 12.1.4.1. Company Overview
- 12.1.4.2. Products
- 12.1.4.3. Company Financials
- 12.1.4.4. SWOT Analysis
- 12.1.5 LyondellBasell Industries N V
- 12.1.5.1. Company Overview
- 12.1.5.2. Products
- 12.1.5.3. Company Financials
- 12.1.5.4. SWOT Analysis
- 12.1.6 Celanese Corporation
- 12.1.6.1. Company Overview
- 12.1.6.2. Products
- 12.1.6.3. Company Financials
- 12.1.6.4. SWOT Analysis
- 12.1.7 Alkyl Amines Chemicals Limited
- 12.1.7.1. Company Overview
- 12.1.7.2. Products
- 12.1.7.3. Company Financials
- 12.1.7.4. SWOT Analysis
- 12.1.8 INVISTA
- 12.1.8.1. Company Overview
- 12.1.8.2. Products
- 12.1.8.3. Company Financials
- 12.1.8.4. SWOT Analysis
- 12.1.9 Kemipex
- 12.1.9.1. Company Overview
- 12.1.9.2. Products
- 12.1.9.3. Company Financials
- 12.1.9.4. SWOT Analysis
- 12.1.10 BASF SE
- 12.1.10.1. Company Overview
- 12.1.10.2. Products
- 12.1.10.3. Company Financials
- 12.1.10.4. SWOT Analysis
- 12.1.11 Arkema Group
- 12.1.11.1. Company Overview
- 12.1.11.2. Products
- 12.1.11.3. Company Financials
- 12.1.11.4. SWOT Analysis
- 12.1.12 Huntsman International LLC
- 12.1.12.1. Company Overview
- 12.1.12.2. Products
- 12.1.12.3. Company Financials
- 12.1.12.4. SWOT Analysis
- 12.1.13 SABIC
- 12.1.13.1. Company Overview
- 12.1.13.2. Products
- 12.1.13.3. Company Financials
- 12.1.13.4. SWOT Analysis
- 12.1.14 Akzo Nobel N V
- 12.1.14.1. Company Overview
- 12.1.14.2. Products
- 12.1.14.3. Company Financials
- 12.1.14.4. SWOT Analysis
- 12.1.15 Daicel Corporation
- 12.1.15.1. Company Overview
- 12.1.15.2. Products
- 12.1.15.3. Company Financials
- 12.1.15.4. SWOT Analysis
- 12.1.16 Mitsubishi Gas Chemical Company Inc
- 12.1.16.1. Company Overview
- 12.1.16.2. Products
- 12.1.16.3. Company Financials
- 12.1.16.4. SWOT Analysis
- 12.1.17 DowDuPont
- 12.1.17.1. Company Overview
- 12.1.17.2. Products
- 12.1.17.3. Company Financials
- 12.1.17.4. SWOT Analysis
- 12.1.18 Tosoh Corporation*List Not Exhaustive
- 12.1.18.1. Company Overview
- 12.1.18.2. Products
- 12.1.18.3. Company Financials
- 12.1.18.4. SWOT Analysis
- 12.1.1 Clariant
- 12.2. Market Entropy
- 12.2.1 Company's Key Areas Served
- 12.2.2 Recent Developments
- 12.3. Company Market Share Analysis 2025
- 12.3.1 Top 5 Companies Market Share Analysis
- 12.3.2 Top 3 Companies Market Share Analysis
- 12.4. List of Potential Customers
- 13. Research Methodology
List of Figures
- Figure 1: Global Amines Market Revenue Breakdown (Million, %) by Region 2025 & 2033
- Figure 2: Global Amines Market Volume Breakdown (K Tons, %) by Region 2025 & 2033
- Figure 3: Asia Pacific Amines Market Revenue (Million), by Type 2025 & 2033
- Figure 4: Asia Pacific Amines Market Volume (K Tons), by Type 2025 & 2033
- Figure 5: Asia Pacific Amines Market Revenue Share (%), by Type 2025 & 2033
- Figure 6: Asia Pacific Amines Market Volume Share (%), by Type 2025 & 2033
- Figure 7: Asia Pacific Amines Market Revenue (Million), by End-use 2025 & 2033
- Figure 8: Asia Pacific Amines Market Volume (K Tons), by End-use 2025 & 2033
- Figure 9: Asia Pacific Amines Market Revenue Share (%), by End-use 2025 & 2033
- Figure 10: Asia Pacific Amines Market Volume Share (%), by End-use 2025 & 2033
- Figure 11: Asia Pacific Amines Market Revenue (Million), by Country 2025 & 2033
- Figure 12: Asia Pacific Amines Market Volume (K Tons), by Country 2025 & 2033
- Figure 13: Asia Pacific Amines Market Revenue Share (%), by Country 2025 & 2033
- Figure 14: Asia Pacific Amines Market Volume Share (%), by Country 2025 & 2033
- Figure 15: North America Amines Market Revenue (Million), by Type 2025 & 2033
- Figure 16: North America Amines Market Volume (K Tons), by Type 2025 & 2033
- Figure 17: North America Amines Market Revenue Share (%), by Type 2025 & 2033
- Figure 18: North America Amines Market Volume Share (%), by Type 2025 & 2033
- Figure 19: North America Amines Market Revenue (Million), by End-use 2025 & 2033
- Figure 20: North America Amines Market Volume (K Tons), by End-use 2025 & 2033
- Figure 21: North America Amines Market Revenue Share (%), by End-use 2025 & 2033
- Figure 22: North America Amines Market Volume Share (%), by End-use 2025 & 2033
- Figure 23: North America Amines Market Revenue (Million), by Country 2025 & 2033
- Figure 24: North America Amines Market Volume (K Tons), by Country 2025 & 2033
- Figure 25: North America Amines Market Revenue Share (%), by Country 2025 & 2033
- Figure 26: North America Amines Market Volume Share (%), by Country 2025 & 2033
- Figure 27: Europe Amines Market Revenue (Million), by Type 2025 & 2033
- Figure 28: Europe Amines Market Volume (K Tons), by Type 2025 & 2033
- Figure 29: Europe Amines Market Revenue Share (%), by Type 2025 & 2033
- Figure 30: Europe Amines Market Volume Share (%), by Type 2025 & 2033
- Figure 31: Europe Amines Market Revenue (Million), by End-use 2025 & 2033
- Figure 32: Europe Amines Market Volume (K Tons), by End-use 2025 & 2033
- Figure 33: Europe Amines Market Revenue Share (%), by End-use 2025 & 2033
- Figure 34: Europe Amines Market Volume Share (%), by End-use 2025 & 2033
- Figure 35: Europe Amines Market Revenue (Million), by Country 2025 & 2033
- Figure 36: Europe Amines Market Volume (K Tons), by Country 2025 & 2033
- Figure 37: Europe Amines Market Revenue Share (%), by Country 2025 & 2033
- Figure 38: Europe Amines Market Volume Share (%), by Country 2025 & 2033
- Figure 39: South America Amines Market Revenue (Million), by Type 2025 & 2033
- Figure 40: South America Amines Market Volume (K Tons), by Type 2025 & 2033
- Figure 41: South America Amines Market Revenue Share (%), by Type 2025 & 2033
- Figure 42: South America Amines Market Volume Share (%), by Type 2025 & 2033
- Figure 43: South America Amines Market Revenue (Million), by End-use 2025 & 2033
- Figure 44: South America Amines Market Volume (K Tons), by End-use 2025 & 2033
- Figure 45: South America Amines Market Revenue Share (%), by End-use 2025 & 2033
- Figure 46: South America Amines Market Volume Share (%), by End-use 2025 & 2033
- Figure 47: South America Amines Market Revenue (Million), by Country 2025 & 2033
- Figure 48: South America Amines Market Volume (K Tons), by Country 2025 & 2033
- Figure 49: South America Amines Market Revenue Share (%), by Country 2025 & 2033
- Figure 50: South America Amines Market Volume Share (%), by Country 2025 & 2033
- Figure 51: Middle East and Africa Amines Market Revenue (Million), by Type 2025 & 2033
- Figure 52: Middle East and Africa Amines Market Volume (K Tons), by Type 2025 & 2033
- Figure 53: Middle East and Africa Amines Market Revenue Share (%), by Type 2025 & 2033
- Figure 54: Middle East and Africa Amines Market Volume Share (%), by Type 2025 & 2033
- Figure 55: Middle East and Africa Amines Market Revenue (Million), by End-use 2025 & 2033
- Figure 56: Middle East and Africa Amines Market Volume (K Tons), by End-use 2025 & 2033
- Figure 57: Middle East and Africa Amines Market Revenue Share (%), by End-use 2025 & 2033
- Figure 58: Middle East and Africa Amines Market Volume Share (%), by End-use 2025 & 2033
- Figure 59: Middle East and Africa Amines Market Revenue (Million), by Country 2025 & 2033
- Figure 60: Middle East and Africa Amines Market Volume (K Tons), by Country 2025 & 2033
- Figure 61: Middle East and Africa Amines Market Revenue Share (%), by Country 2025 & 2033
- Figure 62: Middle East and Africa Amines Market Volume Share (%), by Country 2025 & 2033
List of Tables
- Table 1: Global Amines Market Revenue Million Forecast, by Type 2020 & 2033
- Table 2: Global Amines Market Volume K Tons Forecast, by Type 2020 & 2033
- Table 3: Global Amines Market Revenue Million Forecast, by End-use 2020 & 2033
- Table 4: Global Amines Market Volume K Tons Forecast, by End-use 2020 & 2033
- Table 5: Global Amines Market Revenue Million Forecast, by Region 2020 & 2033
- Table 6: Global Amines Market Volume K Tons Forecast, by Region 2020 & 2033
- Table 7: Global Amines Market Revenue Million Forecast, by Type 2020 & 2033
- Table 8: Global Amines Market Volume K Tons Forecast, by Type 2020 & 2033
- Table 9: Global Amines Market Revenue Million Forecast, by End-use 2020 & 2033
- Table 10: Global Amines Market Volume K Tons Forecast, by End-use 2020 & 2033
- Table 11: Global Amines Market Revenue Million Forecast, by Country 2020 & 2033
- Table 12: Global Amines Market Volume K Tons Forecast, by Country 2020 & 2033
- Table 13: China Amines Market Revenue (Million) Forecast, by Application 2020 & 2033
- Table 14: China Amines Market Volume (K Tons) Forecast, by Application 2020 & 2033
- Table 15: India Amines Market Revenue (Million) Forecast, by Application 2020 & 2033
- Table 16: India Amines Market Volume (K Tons) Forecast, by Application 2020 & 2033
- Table 17: Japan Amines Market Revenue (Million) Forecast, by Application 2020 & 2033
- Table 18: Japan Amines Market Volume (K Tons) Forecast, by Application 2020 & 2033
- Table 19: South Korea Amines Market Revenue (Million) Forecast, by Application 2020 & 2033
- Table 20: South Korea Amines Market Volume (K Tons) Forecast, by Application 2020 & 2033
- Table 21: Australia and New Zealand Amines Market Revenue (Million) Forecast, by Application 2020 & 2033
- Table 22: Australia and New Zealand Amines Market Volume (K Tons) Forecast, by Application 2020 & 2033
- Table 23: Rest of Asia Pacific Amines Market Revenue (Million) Forecast, by Application 2020 & 2033
- Table 24: Rest of Asia Pacific Amines Market Volume (K Tons) Forecast, by Application 2020 & 2033
- Table 25: Global Amines Market Revenue Million Forecast, by Type 2020 & 2033
- Table 26: Global Amines Market Volume K Tons Forecast, by Type 2020 & 2033
- Table 27: Global Amines Market Revenue Million Forecast, by End-use 2020 & 2033
- Table 28: Global Amines Market Volume K Tons Forecast, by End-use 2020 & 2033
- Table 29: Global Amines Market Revenue Million Forecast, by Country 2020 & 2033
- Table 30: Global Amines Market Volume K Tons Forecast, by Country 2020 & 2033
- Table 31: United States Amines Market Revenue (Million) Forecast, by Application 2020 & 2033
- Table 32: United States Amines Market Volume (K Tons) Forecast, by Application 2020 & 2033
- Table 33: Canada Amines Market Revenue (Million) Forecast, by Application 2020 & 2033
- Table 34: Canada Amines Market Volume (K Tons) Forecast, by Application 2020 & 2033
- Table 35: Mexico Amines Market Revenue (Million) Forecast, by Application 2020 & 2033
- Table 36: Mexico Amines Market Volume (K Tons) Forecast, by Application 2020 & 2033
- Table 37: Global Amines Market Revenue Million Forecast, by Type 2020 & 2033
- Table 38: Global Amines Market Volume K Tons Forecast, by Type 2020 & 2033
- Table 39: Global Amines Market Revenue Million Forecast, by End-use 2020 & 2033
- Table 40: Global Amines Market Volume K Tons Forecast, by End-use 2020 & 2033
- Table 41: Global Amines Market Revenue Million Forecast, by Country 2020 & 2033
- Table 42: Global Amines Market Volume K Tons Forecast, by Country 2020 & 2033
- Table 43: Germany Amines Market Revenue (Million) Forecast, by Application 2020 & 2033
- Table 44: Germany Amines Market Volume (K Tons) Forecast, by Application 2020 & 2033
- Table 45: United Kingdom Amines Market Revenue (Million) Forecast, by Application 2020 & 2033
- Table 46: United Kingdom Amines Market Volume (K Tons) Forecast, by Application 2020 & 2033
- Table 47: Italy Amines Market Revenue (Million) Forecast, by Application 2020 & 2033
- Table 48: Italy Amines Market Volume (K Tons) Forecast, by Application 2020 & 2033
- Table 49: France Amines Market Revenue (Million) Forecast, by Application 2020 & 2033
- Table 50: France Amines Market Volume (K Tons) Forecast, by Application 2020 & 2033
- Table 51: Rest of Europe Amines Market Revenue (Million) Forecast, by Application 2020 & 2033
- Table 52: Rest of Europe Amines Market Volume (K Tons) Forecast, by Application 2020 & 2033
- Table 53: Global Amines Market Revenue Million Forecast, by Type 2020 & 2033
- Table 54: Global Amines Market Volume K Tons Forecast, by Type 2020 & 2033
- Table 55: Global Amines Market Revenue Million Forecast, by End-use 2020 & 2033
- Table 56: Global Amines Market Volume K Tons Forecast, by End-use 2020 & 2033
- Table 57: Global Amines Market Revenue Million Forecast, by Country 2020 & 2033
- Table 58: Global Amines Market Volume K Tons Forecast, by Country 2020 & 2033
- Table 59: Brazil Amines Market Revenue (Million) Forecast, by Application 2020 & 2033
- Table 60: Brazil Amines Market Volume (K Tons) Forecast, by Application 2020 & 2033
- Table 61: Argentina Amines Market Revenue (Million) Forecast, by Application 2020 & 2033
- Table 62: Argentina Amines Market Volume (K Tons) Forecast, by Application 2020 & 2033
- Table 63: Rest of South America Amines Market Revenue (Million) Forecast, by Application 2020 & 2033
- Table 64: Rest of South America Amines Market Volume (K Tons) Forecast, by Application 2020 & 2033
- Table 65: Global Amines Market Revenue Million Forecast, by Type 2020 & 2033
- Table 66: Global Amines Market Volume K Tons Forecast, by Type 2020 & 2033
- Table 67: Global Amines Market Revenue Million Forecast, by End-use 2020 & 2033
- Table 68: Global Amines Market Volume K Tons Forecast, by End-use 2020 & 2033
- Table 69: Global Amines Market Revenue Million Forecast, by Country 2020 & 2033
- Table 70: Global Amines Market Volume K Tons Forecast, by Country 2020 & 2033
- Table 71: Saudi Arabia Amines Market Revenue (Million) Forecast, by Application 2020 & 2033
- Table 72: Saudi Arabia Amines Market Volume (K Tons) Forecast, by Application 2020 & 2033
- Table 73: South Africa Amines Market Revenue (Million) Forecast, by Application 2020 & 2033
- Table 74: South Africa Amines Market Volume (K Tons) Forecast, by Application 2020 & 2033
- Table 75: Rest of Middle East and Africa Amines Market Revenue (Million) Forecast, by Application 2020 & 2033
- Table 76: Rest of Middle East and Africa Amines Market Volume (K Tons) Forecast, by Application 2020 & 2033
Frequently Asked Questions
1. What is the projected Compound Annual Growth Rate (CAGR) of the Amines Market?
The projected CAGR is approximately 4.75%.
2. Which companies are prominent players in the Amines Market?
Key companies in the market include Clariant, Air Products and Chemicals Inc, Solvay, INEOS, LyondellBasell Industries N V, Celanese Corporation, Alkyl Amines Chemicals Limited, INVISTA, Kemipex, BASF SE, Arkema Group, Huntsman International LLC, SABIC, Akzo Nobel N V, Daicel Corporation, Mitsubishi Gas Chemical Company Inc, DowDuPont, Tosoh Corporation*List Not Exhaustive.
3. What are the main segments of the Amines Market?
The market segments include Type, End-use.
4. Can you provide details about the market size?
The market size is estimated to be USD 15.42 Million as of 2022.
5. What are some drivers contributing to market growth?
; Growing Demand for Personal Care Products from Asia-Pacific; Accelerating Demand for Pesticides from Developing Countries; Increasing Demand and Usage in Construction Sector.
6. What are the notable trends driving market growth?
Increasing Demand form Pharmaceutical Industry.
7. Are there any restraints impacting market growth?
; Rising Consumption of Wood-free Products; Increasing Usage of Bio-Based Products for Agriculture in Developed Countries.
8. Can you provide examples of recent developments in the market?
In 2022, LyondellBasell announced the expansion of its amine plant in China to meet growing demand for amines in the Asia-Pacific region.
9. What pricing options are available for accessing the report?
Pricing options include single-user, multi-user, and enterprise licenses priced at USD 4750, USD 5250, and USD 8750 respectively.
10. Is the market size provided in terms of value or volume?
The market size is provided in terms of value, measured in Million and volume, measured in K Tons.
11. Are there any specific market keywords associated with the report?
Yes, the market keyword associated with the report is "Amines Market," which aids in identifying and referencing the specific market segment covered.
12. How do I determine which pricing option suits my needs best?
The pricing options vary based on user requirements and access needs. Individual users may opt for single-user licenses, while businesses requiring broader access may choose multi-user or enterprise licenses for cost-effective access to the report.
13. Are there any additional resources or data provided in the Amines Market report?
While the report offers comprehensive insights, it's advisable to review the specific contents or supplementary materials provided to ascertain if additional resources or data are available.
14. How can I stay updated on further developments or reports in the Amines Market?
To stay informed about further developments, trends, and reports in the Amines Market, consider subscribing to industry newsletters, following relevant companies and organizations, or regularly checking reputable industry news sources and publications.
Methodology
Step 1 - Identification of Relevant Samples Size from Population Database


Step 2 - Approaches for Defining Global Market Size (Value, Volume* & Price*)

Note*: In applicable scenarios
Step 3 - Data Sources
Primary Research
- Web Analytics
- Survey Reports
- Research Institute
- Latest Research Reports
- Opinion Leaders
Secondary Research
- Annual Reports
- White Paper
- Latest Press Release
- Industry Association
- Paid Database
- Investor Presentations

Step 4 - Data Triangulation
Involves using different sources of information in order to increase the validity of a study
These sources are likely to be stakeholders in a program - participants, other researchers, program staff, other community members, and so on.
Then we put all data in single framework & apply various statistical tools to find out the dynamic on the market.
During the analysis stage, feedback from the stakeholder groups would be compared to determine areas of agreement as well as areas of divergence