

Key Insights
The amphibious aircraft market is poised for significant expansion, driven by the escalating demand for versatile aircraft capable of seamless land and water operations. This dynamic sector is projected to achieve a Compound Annual Growth Rate (CAGR) of 9.89%, reaching a substantial market size of 283.79 million by the base year 2025. Key growth catalysts include the critical need for enhanced search and rescue capabilities, effective coastal surveillance, and comprehensive environmental monitoring, particularly in water-rich regions with underdeveloped infrastructure. The burgeoning popularity of amphibious aircraft for tourism and recreational pursuits, such as scenic seaplane tours and sport fishing, also significantly fuels market expansion. Analysis of market segmentation indicates a dominant share for civilian applications, spanning tourism, cargo transport, and disaster relief efforts. While piston engine aircraft currently represent a larger market segment, turboprop engines are anticipated to experience accelerated growth owing to their superior performance and efficiency for longer-range missions. Industry leaders are committed to continuous innovation, focusing on enhancing aircraft performance, safety, and operational efficiency, thereby fostering a competitive environment and driving market growth. Geographically, North America and the Asia-Pacific region are expected to exhibit robust growth, propelled by substantial government investments in infrastructure and aviation development.
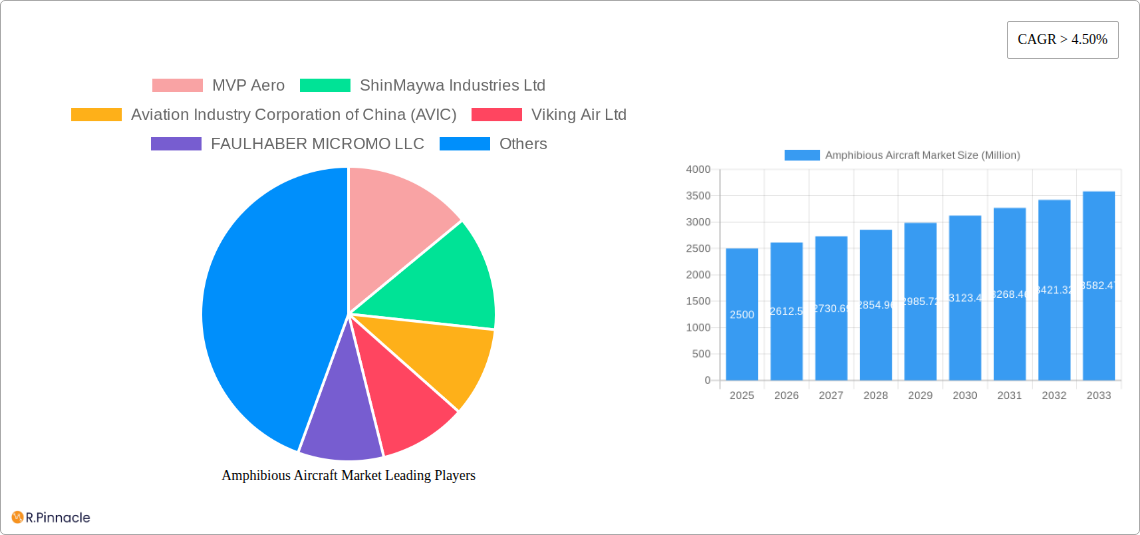
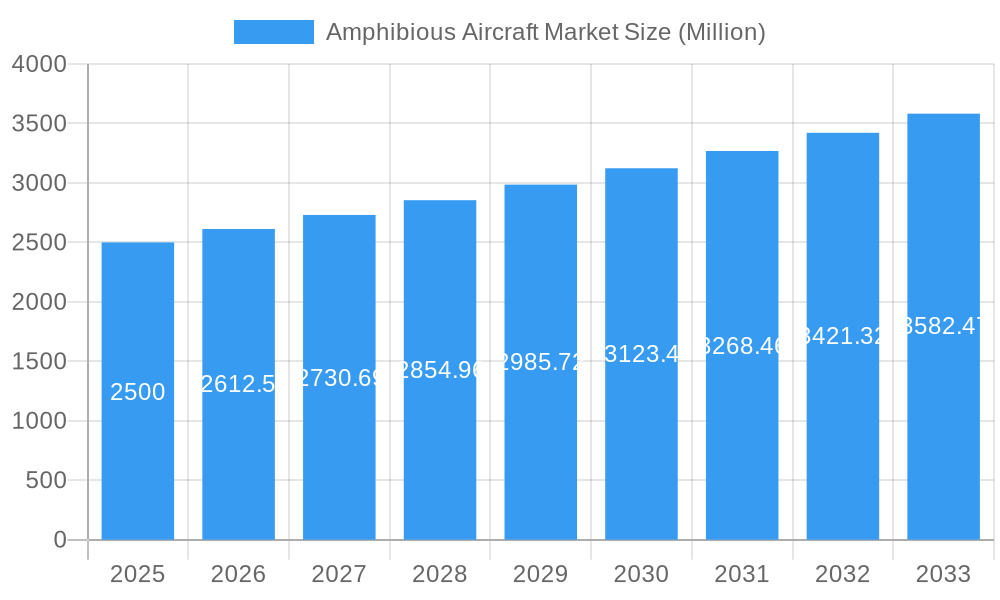
Amphibious Aircraft Market Market Size (In Million)
The competitive arena comprises a blend of seasoned industry veterans and innovative new entrants. Established corporations, such as Aviation Industry Corporation of China (AVIC) and Viking Air Ltd., leverage their extensive experience and diverse product offerings. Conversely, emerging companies are strategically targeting niche markets and specialized applications. Market expansion is tempered by certain restraints, including the considerable initial capital outlay for acquiring and maintaining amphibious aircraft, stringent regulatory compliance, and the necessity for specialized operational infrastructure, such as suitable water landing sites and dedicated maintenance facilities. Nevertheless, ongoing technological advancements and increasing market demand are anticipated to alleviate these challenges. The continuous evolution of advanced materials, more fuel-efficient propulsion systems, and enhanced safety features are pivotal factors that will shape the market's future trajectory, contributing to an overwhelmingly positive outlook for the amphibious aircraft industry. This growth trajectory is further supported by governmental initiatives aimed at promoting sustainable and efficient transportation solutions.
Amphibious Aircraft Market Company Market Share
Amphibious Aircraft Market Report: 2019-2033 Forecast
This comprehensive report provides a detailed analysis of the global amphibious aircraft market, offering invaluable insights for industry professionals, investors, and strategic decision-makers. Covering the period from 2019 to 2033, with a focus on 2025, this report unveils market dynamics, competitive landscapes, and future growth trajectories. Leveraging rigorous research and data-driven analysis, this report is an essential resource for navigating the complexities of this dynamic sector.
Amphibious Aircraft Market Structure & Innovation Trends
The amphibious aircraft market exhibits a moderately concentrated structure, with key players like MVP Aero, ShinMaywa Industries Ltd, and Aviation Industry Corporation of China (AVIC) holding significant market share (estimated at xx% combined in 2025). Innovation is driven by advancements in materials science (lighter, stronger composites), engine technology (more fuel-efficient turboprops), and avionics (enhanced navigation and safety systems). Regulatory frameworks, particularly those concerning safety and environmental impact, significantly influence market growth. Product substitutes, such as helicopters for certain applications, pose a competitive challenge. The end-user demographic is diverse, encompassing civilian, military, and commercial sectors. M&A activity has been moderate, with recent deals totaling an estimated xx Million in 2024, primarily focused on consolidation and technological acquisition. Market share fluctuations are influenced by factors such as product innovation cycles, government procurement policies, and economic conditions.
Amphibious Aircraft Market Dynamics & Trends
The amphibious aircraft market is projected to experience a CAGR of xx% during the forecast period (2025-2033), driven primarily by increasing demand from civilian and military sectors. Growth is fueled by the rising need for efficient transportation in remote and water-bound regions, coupled with escalating tourism and search and rescue operations. Technological disruptions, such as the development of hybrid-electric propulsion systems, are poised to reshape the market landscape. Consumer preferences are shifting toward improved safety features, enhanced comfort, and greater fuel efficiency. Competitive dynamics are characterized by intense rivalry among established players and the emergence of new entrants with innovative technologies. Market penetration of amphibious aircraft remains relatively low compared to traditional fixed-wing aircraft; however, this is expected to increase with advancements in technology and infrastructure.
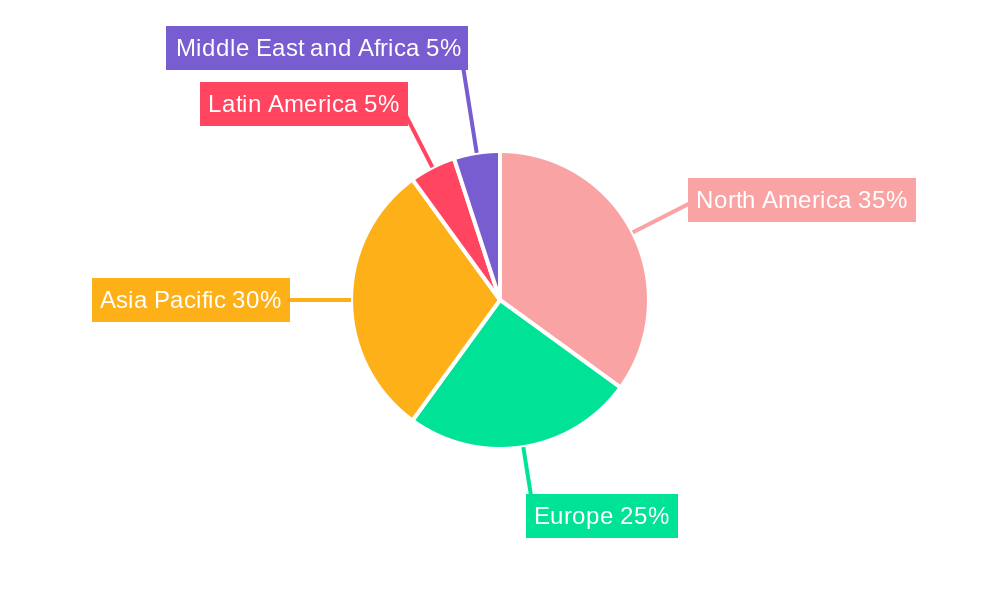
Dominant Regions & Segments in Amphibious Aircraft Market
The North American region currently holds a dominant position in the amphibious aircraft market, driven by strong demand from civilian and military sectors. This dominance is supported by robust infrastructure, favorable regulatory frameworks, and a higher per capita income leading to increased recreational use.
Key Drivers in North America: Strong domestic demand, robust aviation infrastructure, high disposable income for recreational purposes, supportive government policies for aviation development.
Civilian Segment: This segment is projected to witness the highest growth rate over the forecast period, driven by expanding tourism and recreational activities in coastal regions and remote areas.
Turboprop Engine Segment: Turboprop engines dominate the market due to their efficiency and cost-effectiveness, especially for larger amphibious aircraft.
The Asia-Pacific region is expected to show significant growth during the forecast period due to increased infrastructure development, rising tourism, and the growing need for search and rescue operations in remote areas. Europe also holds a substantial share of the market.
Amphibious Aircraft Market Product Innovations
Recent innovations include advancements in lightweight materials, improved engine efficiency, and enhanced avionics systems, leading to safer, faster, and more fuel-efficient amphibious aircraft. These innovations are improving the market fit of amphibious aircraft for diverse applications, ranging from personal transportation to search and rescue operations, thus increasing the overall market attractiveness.
Report Scope & Segmentation Analysis
This report segments the amphibious aircraft market by application (civilian and military) and engine type (piston and turboprop).
By Application: The civilian segment is anticipated to grow at a faster rate than the military segment due to increasing tourism and recreational activities. Competitive dynamics are distinct in each segment, with the military sector involving significant government contracts.
By Engine: The turboprop segment holds a larger market share compared to the piston engine segment because of the advantages in terms of power, speed, and range. However, piston engine-powered amphibious aircraft still play a significant role in specific niche markets due to lower initial costs.
Key Drivers of Amphibious Aircraft Market Growth
The market is driven by increasing demand for efficient transportation in remote and water-bound areas, growing tourism, rising military budgets in several regions, technological advancements resulting in higher safety, efficiency, and lower operational costs and governmental initiatives to improve infrastructure in remote locations.
Challenges in the Amphibious Aircraft Market Sector
Challenges include high initial investment costs, stringent regulatory requirements, limitations in infrastructure, and the availability of skilled maintenance personnel. The reliance on specialized materials and components creates vulnerability to supply chain disruptions. The competitive landscape also presents significant challenges.
Emerging Opportunities in Amphibious Aircraft Market
Emerging opportunities lie in the development of hybrid-electric and fully electric amphibious aircraft, alongside expanding into new markets, particularly in developing economies experiencing increased tourism and infrastructure investment. New materials and manufacturing technologies offer possibilities for cost reduction and performance enhancement.
Leading Players in the Amphibious Aircraft Market Market
- MVP Aero
- ShinMaywa Industries Ltd
- Aviation Industry Corporation of China (AVIC)
- Viking Air Ltd
- FAULHABER MICROMO LLC
- Atol Avion
- Vickers Aircraft Company Limited
- LISA Airplanes
- United Aircraft Corporation
- Equator Aircraft AS
- Flywhale Aircraft GmbH & Co KG
- Aero Adventure LLC
- Seawings International
- ICON Aircraft Inc
Key Developments in Amphibious Aircraft Market Industry
- July 2024: MVP Aero announces successful test flight of its new hybrid-electric amphibious aircraft prototype.
- October 2023: Viking Air completes a major contract with a government agency for a large order of amphibious aircraft.
- March 2022: ShinMaywa Industries Ltd announces an investment in research and development of advanced materials for amphibious aircraft construction.
Future Outlook for Amphibious Aircraft Market Market
The future outlook for the amphibious aircraft market is positive, driven by continued technological innovation, expanding applications across various sectors, and increasing demand from developing economies. The market is poised for significant growth, especially with the adoption of sustainable technologies such as hybrid-electric propulsion systems. Strategic partnerships and investments in research and development will play a crucial role in shaping the future landscape of this dynamic sector.
Amphibious Aircraft Market Segmentation
- 1. Production Analysis
- 2. Consumption Analysis
- 3. Import Market Analysis (Value & Volume)
- 4. Export Market Analysis (Value & Volume)
- 5. Price Trend Analysis
Amphibious Aircraft Market Segmentation By Geography
-
1. North America
- 1.1. United States
- 1.2. Canada
- 1.3. Mexico
-
2. South America
- 2.1. Brazil
- 2.2. Argentina
- 2.3. Rest of South America
-
3. Europe
- 3.1. United Kingdom
- 3.2. Germany
- 3.3. France
- 3.4. Italy
- 3.5. Spain
- 3.6. Russia
- 3.7. Benelux
- 3.8. Nordics
- 3.9. Rest of Europe
-
4. Middle East & Africa
- 4.1. Turkey
- 4.2. Israel
- 4.3. GCC
- 4.4. North Africa
- 4.5. South Africa
- 4.6. Rest of Middle East & Africa
-
5. Asia Pacific
- 5.1. China
- 5.2. India
- 5.3. Japan
- 5.4. South Korea
- 5.5. ASEAN
- 5.6. Oceania
- 5.7. Rest of Asia Pacific
Amphibious Aircraft Market Regional Market Share
Geographic Coverage of Amphibious Aircraft Market
Amphibious Aircraft Market REPORT HIGHLIGHTS
| Aspects | Details |
|---|---|
| Study Period | 2020-2034 |
| Base Year | 2025 |
| Estimated Year | 2026 |
| Forecast Period | 2026-2034 |
| Historical Period | 2020-2025 |
| Growth Rate | CAGR of 9.89% from 2020-2034 |
| Segmentation |
|
Table of Contents
- 1. Introduction
- 1.1. Research Scope
- 1.2. Market Segmentation
- 1.3. Research Objective
- 1.4. Definitions and Assumptions
- 2. Executive Summary
- 2.1. Market Snapshot
- 3. Market Dynamics
- 3.1. Market Drivers
- 3.2. Market Restrains
- 3.3. Market Trends
- 3.4. Market Opportunities
- 4. Market Factor Analysis
- 4.1. Porters Five Forces
- 4.1.1. Bargaining Power of Suppliers
- 4.1.2. Bargaining Power of Buyers
- 4.1.3. Threat of New Entrants
- 4.1.4. Threat of Substitutes
- 4.1.5. Competitive Rivalry
- 4.2. PESTEL analysis
- 4.3. BCG Analysis
- 4.3.1. Stars (High Growth, High Market Share)
- 4.3.2. Cash Cows (Low Growth, High Market Share)
- 4.3.3. Question Mark (High Growth, Low Market Share)
- 4.3.4. Dogs (Low Growth, Low Market Share)
- 4.4. Ansoff Matrix Analysis
- 4.5. Supply Chain Analysis
- 4.6. Regulatory Landscape
- 4.7. Current Market Potential and Opportunity Assessment (TAM–SAM–SOM Framework)
- 4.8. PRI Analyst Note
- 4.1. Porters Five Forces
- 5. Market Analysis, Insights and Forecast 2021-2033
- 5.1. Market Analysis, Insights and Forecast - by Production Analysis
- 5.2. Market Analysis, Insights and Forecast - by Consumption Analysis
- 5.3. Market Analysis, Insights and Forecast - by Import Market Analysis (Value & Volume)
- 5.4. Market Analysis, Insights and Forecast - by Export Market Analysis (Value & Volume)
- 5.5. Market Analysis, Insights and Forecast - by Price Trend Analysis
- 5.6. Market Analysis, Insights and Forecast - by Region
- 5.6.1. North America
- 5.6.2. South America
- 5.6.3. Europe
- 5.6.4. Middle East & Africa
- 5.6.5. Asia Pacific
- 6. Global Amphibious Aircraft Market Analysis, Insights and Forecast, 2021-2033
- 6.1. Market Analysis, Insights and Forecast - by Production Analysis
- 6.2. Market Analysis, Insights and Forecast - by Consumption Analysis
- 6.3. Market Analysis, Insights and Forecast - by Import Market Analysis (Value & Volume)
- 6.4. Market Analysis, Insights and Forecast - by Export Market Analysis (Value & Volume)
- 6.5. Market Analysis, Insights and Forecast - by Price Trend Analysis
- 7. North America Amphibious Aircraft Market Analysis, Insights and Forecast, 2020-2032
- 7.1. Market Analysis, Insights and Forecast - by Production Analysis
- 7.2. Market Analysis, Insights and Forecast - by Consumption Analysis
- 7.3. Market Analysis, Insights and Forecast - by Import Market Analysis (Value & Volume)
- 7.4. Market Analysis, Insights and Forecast - by Export Market Analysis (Value & Volume)
- 7.5. Market Analysis, Insights and Forecast - by Price Trend Analysis
- 8. South America Amphibious Aircraft Market Analysis, Insights and Forecast, 2020-2032
- 8.1. Market Analysis, Insights and Forecast - by Production Analysis
- 8.2. Market Analysis, Insights and Forecast - by Consumption Analysis
- 8.3. Market Analysis, Insights and Forecast - by Import Market Analysis (Value & Volume)
- 8.4. Market Analysis, Insights and Forecast - by Export Market Analysis (Value & Volume)
- 8.5. Market Analysis, Insights and Forecast - by Price Trend Analysis
- 9. Europe Amphibious Aircraft Market Analysis, Insights and Forecast, 2020-2032
- 9.1. Market Analysis, Insights and Forecast - by Production Analysis
- 9.2. Market Analysis, Insights and Forecast - by Consumption Analysis
- 9.3. Market Analysis, Insights and Forecast - by Import Market Analysis (Value & Volume)
- 9.4. Market Analysis, Insights and Forecast - by Export Market Analysis (Value & Volume)
- 9.5. Market Analysis, Insights and Forecast - by Price Trend Analysis
- 10. Middle East & Africa Amphibious Aircraft Market Analysis, Insights and Forecast, 2020-2032
- 10.1. Market Analysis, Insights and Forecast - by Production Analysis
- 10.2. Market Analysis, Insights and Forecast - by Consumption Analysis
- 10.3. Market Analysis, Insights and Forecast - by Import Market Analysis (Value & Volume)
- 10.4. Market Analysis, Insights and Forecast - by Export Market Analysis (Value & Volume)
- 10.5. Market Analysis, Insights and Forecast - by Price Trend Analysis
- 11. Asia Pacific Amphibious Aircraft Market Analysis, Insights and Forecast, 2020-2032
- 11.1. Market Analysis, Insights and Forecast - by Production Analysis
- 11.2. Market Analysis, Insights and Forecast - by Consumption Analysis
- 11.3. Market Analysis, Insights and Forecast - by Import Market Analysis (Value & Volume)
- 11.4. Market Analysis, Insights and Forecast - by Export Market Analysis (Value & Volume)
- 11.5. Market Analysis, Insights and Forecast - by Price Trend Analysis
- 12. Competitive Analysis
- 12.1. Company Profiles
- 12.1.1 MVP Aero
- 12.1.1.1. Company Overview
- 12.1.1.2. Products
- 12.1.1.3. Company Financials
- 12.1.1.4. SWOT Analysis
- 12.1.2 ShinMaywa Industries Ltd
- 12.1.2.1. Company Overview
- 12.1.2.2. Products
- 12.1.2.3. Company Financials
- 12.1.2.4. SWOT Analysis
- 12.1.3 Aviation Industry Corporation of China (AVIC)
- 12.1.3.1. Company Overview
- 12.1.3.2. Products
- 12.1.3.3. Company Financials
- 12.1.3.4. SWOT Analysis
- 12.1.4 Viking Air Ltd
- 12.1.4.1. Company Overview
- 12.1.4.2. Products
- 12.1.4.3. Company Financials
- 12.1.4.4. SWOT Analysis
- 12.1.5 FAULHABER MICROMO LLC
- 12.1.5.1. Company Overview
- 12.1.5.2. Products
- 12.1.5.3. Company Financials
- 12.1.5.4. SWOT Analysis
- 12.1.6 Atol Avion
- 12.1.6.1. Company Overview
- 12.1.6.2. Products
- 12.1.6.3. Company Financials
- 12.1.6.4. SWOT Analysis
- 12.1.7 Vickers Aircraft Company Limited
- 12.1.7.1. Company Overview
- 12.1.7.2. Products
- 12.1.7.3. Company Financials
- 12.1.7.4. SWOT Analysis
- 12.1.8 LISA Airplanes
- 12.1.8.1. Company Overview
- 12.1.8.2. Products
- 12.1.8.3. Company Financials
- 12.1.8.4. SWOT Analysis
- 12.1.9 United Aircraft Corporation
- 12.1.9.1. Company Overview
- 12.1.9.2. Products
- 12.1.9.3. Company Financials
- 12.1.9.4. SWOT Analysis
- 12.1.10 Equator Aircraft AS
- 12.1.10.1. Company Overview
- 12.1.10.2. Products
- 12.1.10.3. Company Financials
- 12.1.10.4. SWOT Analysis
- 12.1.11 Flywhale Aircraft GmbH & Co KG
- 12.1.11.1. Company Overview
- 12.1.11.2. Products
- 12.1.11.3. Company Financials
- 12.1.11.4. SWOT Analysis
- 12.1.12 Aero Adventure LLC
- 12.1.12.1. Company Overview
- 12.1.12.2. Products
- 12.1.12.3. Company Financials
- 12.1.12.4. SWOT Analysis
- 12.1.13 Seawings International
- 12.1.13.1. Company Overview
- 12.1.13.2. Products
- 12.1.13.3. Company Financials
- 12.1.13.4. SWOT Analysis
- 12.1.14 ICON Aircraft Inc
- 12.1.14.1. Company Overview
- 12.1.14.2. Products
- 12.1.14.3. Company Financials
- 12.1.14.4. SWOT Analysis
- 12.1.1 MVP Aero
- 12.2. Market Entropy
- 12.2.1 Company's Key Areas Served
- 12.2.2 Recent Developments
- 12.3. Company Market Share Analysis 2025
- 12.3.1 Top 5 Companies Market Share Analysis
- 12.3.2 Top 3 Companies Market Share Analysis
- 12.4. List of Potential Customers
- 13. Research Methodology
List of Figures
- Figure 1: Global Amphibious Aircraft Market Revenue Breakdown (million, %) by Region 2025 & 2033
- Figure 2: North America Amphibious Aircraft Market Revenue (million), by Production Analysis 2025 & 2033
- Figure 3: North America Amphibious Aircraft Market Revenue Share (%), by Production Analysis 2025 & 2033
- Figure 4: North America Amphibious Aircraft Market Revenue (million), by Consumption Analysis 2025 & 2033
- Figure 5: North America Amphibious Aircraft Market Revenue Share (%), by Consumption Analysis 2025 & 2033
- Figure 6: North America Amphibious Aircraft Market Revenue (million), by Import Market Analysis (Value & Volume) 2025 & 2033
- Figure 7: North America Amphibious Aircraft Market Revenue Share (%), by Import Market Analysis (Value & Volume) 2025 & 2033
- Figure 8: North America Amphibious Aircraft Market Revenue (million), by Export Market Analysis (Value & Volume) 2025 & 2033
- Figure 9: North America Amphibious Aircraft Market Revenue Share (%), by Export Market Analysis (Value & Volume) 2025 & 2033
- Figure 10: North America Amphibious Aircraft Market Revenue (million), by Price Trend Analysis 2025 & 2033
- Figure 11: North America Amphibious Aircraft Market Revenue Share (%), by Price Trend Analysis 2025 & 2033
- Figure 12: North America Amphibious Aircraft Market Revenue (million), by Country 2025 & 2033
- Figure 13: North America Amphibious Aircraft Market Revenue Share (%), by Country 2025 & 2033
- Figure 14: South America Amphibious Aircraft Market Revenue (million), by Production Analysis 2025 & 2033
- Figure 15: South America Amphibious Aircraft Market Revenue Share (%), by Production Analysis 2025 & 2033
- Figure 16: South America Amphibious Aircraft Market Revenue (million), by Consumption Analysis 2025 & 2033
- Figure 17: South America Amphibious Aircraft Market Revenue Share (%), by Consumption Analysis 2025 & 2033
- Figure 18: South America Amphibious Aircraft Market Revenue (million), by Import Market Analysis (Value & Volume) 2025 & 2033
- Figure 19: South America Amphibious Aircraft Market Revenue Share (%), by Import Market Analysis (Value & Volume) 2025 & 2033
- Figure 20: South America Amphibious Aircraft Market Revenue (million), by Export Market Analysis (Value & Volume) 2025 & 2033
- Figure 21: South America Amphibious Aircraft Market Revenue Share (%), by Export Market Analysis (Value & Volume) 2025 & 2033
- Figure 22: South America Amphibious Aircraft Market Revenue (million), by Price Trend Analysis 2025 & 2033
- Figure 23: South America Amphibious Aircraft Market Revenue Share (%), by Price Trend Analysis 2025 & 2033
- Figure 24: South America Amphibious Aircraft Market Revenue (million), by Country 2025 & 2033
- Figure 25: South America Amphibious Aircraft Market Revenue Share (%), by Country 2025 & 2033
- Figure 26: Europe Amphibious Aircraft Market Revenue (million), by Production Analysis 2025 & 2033
- Figure 27: Europe Amphibious Aircraft Market Revenue Share (%), by Production Analysis 2025 & 2033
- Figure 28: Europe Amphibious Aircraft Market Revenue (million), by Consumption Analysis 2025 & 2033
- Figure 29: Europe Amphibious Aircraft Market Revenue Share (%), by Consumption Analysis 2025 & 2033
- Figure 30: Europe Amphibious Aircraft Market Revenue (million), by Import Market Analysis (Value & Volume) 2025 & 2033
- Figure 31: Europe Amphibious Aircraft Market Revenue Share (%), by Import Market Analysis (Value & Volume) 2025 & 2033
- Figure 32: Europe Amphibious Aircraft Market Revenue (million), by Export Market Analysis (Value & Volume) 2025 & 2033
- Figure 33: Europe Amphibious Aircraft Market Revenue Share (%), by Export Market Analysis (Value & Volume) 2025 & 2033
- Figure 34: Europe Amphibious Aircraft Market Revenue (million), by Price Trend Analysis 2025 & 2033
- Figure 35: Europe Amphibious Aircraft Market Revenue Share (%), by Price Trend Analysis 2025 & 2033
- Figure 36: Europe Amphibious Aircraft Market Revenue (million), by Country 2025 & 2033
- Figure 37: Europe Amphibious Aircraft Market Revenue Share (%), by Country 2025 & 2033
- Figure 38: Middle East & Africa Amphibious Aircraft Market Revenue (million), by Production Analysis 2025 & 2033
- Figure 39: Middle East & Africa Amphibious Aircraft Market Revenue Share (%), by Production Analysis 2025 & 2033
- Figure 40: Middle East & Africa Amphibious Aircraft Market Revenue (million), by Consumption Analysis 2025 & 2033
- Figure 41: Middle East & Africa Amphibious Aircraft Market Revenue Share (%), by Consumption Analysis 2025 & 2033
- Figure 42: Middle East & Africa Amphibious Aircraft Market Revenue (million), by Import Market Analysis (Value & Volume) 2025 & 2033
- Figure 43: Middle East & Africa Amphibious Aircraft Market Revenue Share (%), by Import Market Analysis (Value & Volume) 2025 & 2033
- Figure 44: Middle East & Africa Amphibious Aircraft Market Revenue (million), by Export Market Analysis (Value & Volume) 2025 & 2033
- Figure 45: Middle East & Africa Amphibious Aircraft Market Revenue Share (%), by Export Market Analysis (Value & Volume) 2025 & 2033
- Figure 46: Middle East & Africa Amphibious Aircraft Market Revenue (million), by Price Trend Analysis 2025 & 2033
- Figure 47: Middle East & Africa Amphibious Aircraft Market Revenue Share (%), by Price Trend Analysis 2025 & 2033
- Figure 48: Middle East & Africa Amphibious Aircraft Market Revenue (million), by Country 2025 & 2033
- Figure 49: Middle East & Africa Amphibious Aircraft Market Revenue Share (%), by Country 2025 & 2033
- Figure 50: Asia Pacific Amphibious Aircraft Market Revenue (million), by Production Analysis 2025 & 2033
- Figure 51: Asia Pacific Amphibious Aircraft Market Revenue Share (%), by Production Analysis 2025 & 2033
- Figure 52: Asia Pacific Amphibious Aircraft Market Revenue (million), by Consumption Analysis 2025 & 2033
- Figure 53: Asia Pacific Amphibious Aircraft Market Revenue Share (%), by Consumption Analysis 2025 & 2033
- Figure 54: Asia Pacific Amphibious Aircraft Market Revenue (million), by Import Market Analysis (Value & Volume) 2025 & 2033
- Figure 55: Asia Pacific Amphibious Aircraft Market Revenue Share (%), by Import Market Analysis (Value & Volume) 2025 & 2033
- Figure 56: Asia Pacific Amphibious Aircraft Market Revenue (million), by Export Market Analysis (Value & Volume) 2025 & 2033
- Figure 57: Asia Pacific Amphibious Aircraft Market Revenue Share (%), by Export Market Analysis (Value & Volume) 2025 & 2033
- Figure 58: Asia Pacific Amphibious Aircraft Market Revenue (million), by Price Trend Analysis 2025 & 2033
- Figure 59: Asia Pacific Amphibious Aircraft Market Revenue Share (%), by Price Trend Analysis 2025 & 2033
- Figure 60: Asia Pacific Amphibious Aircraft Market Revenue (million), by Country 2025 & 2033
- Figure 61: Asia Pacific Amphibious Aircraft Market Revenue Share (%), by Country 2025 & 2033
List of Tables
- Table 1: Global Amphibious Aircraft Market Revenue million Forecast, by Production Analysis 2020 & 2033
- Table 2: Global Amphibious Aircraft Market Revenue million Forecast, by Consumption Analysis 2020 & 2033
- Table 3: Global Amphibious Aircraft Market Revenue million Forecast, by Import Market Analysis (Value & Volume) 2020 & 2033
- Table 4: Global Amphibious Aircraft Market Revenue million Forecast, by Export Market Analysis (Value & Volume) 2020 & 2033
- Table 5: Global Amphibious Aircraft Market Revenue million Forecast, by Price Trend Analysis 2020 & 2033
- Table 6: Global Amphibious Aircraft Market Revenue million Forecast, by Region 2020 & 2033
- Table 7: Global Amphibious Aircraft Market Revenue million Forecast, by Production Analysis 2020 & 2033
- Table 8: Global Amphibious Aircraft Market Revenue million Forecast, by Consumption Analysis 2020 & 2033
- Table 9: Global Amphibious Aircraft Market Revenue million Forecast, by Import Market Analysis (Value & Volume) 2020 & 2033
- Table 10: Global Amphibious Aircraft Market Revenue million Forecast, by Export Market Analysis (Value & Volume) 2020 & 2033
- Table 11: Global Amphibious Aircraft Market Revenue million Forecast, by Price Trend Analysis 2020 & 2033
- Table 12: Global Amphibious Aircraft Market Revenue million Forecast, by Country 2020 & 2033
- Table 13: United States Amphibious Aircraft Market Revenue (million) Forecast, by Application 2020 & 2033
- Table 14: Canada Amphibious Aircraft Market Revenue (million) Forecast, by Application 2020 & 2033
- Table 15: Mexico Amphibious Aircraft Market Revenue (million) Forecast, by Application 2020 & 2033
- Table 16: Global Amphibious Aircraft Market Revenue million Forecast, by Production Analysis 2020 & 2033
- Table 17: Global Amphibious Aircraft Market Revenue million Forecast, by Consumption Analysis 2020 & 2033
- Table 18: Global Amphibious Aircraft Market Revenue million Forecast, by Import Market Analysis (Value & Volume) 2020 & 2033
- Table 19: Global Amphibious Aircraft Market Revenue million Forecast, by Export Market Analysis (Value & Volume) 2020 & 2033
- Table 20: Global Amphibious Aircraft Market Revenue million Forecast, by Price Trend Analysis 2020 & 2033
- Table 21: Global Amphibious Aircraft Market Revenue million Forecast, by Country 2020 & 2033
- Table 22: Brazil Amphibious Aircraft Market Revenue (million) Forecast, by Application 2020 & 2033
- Table 23: Argentina Amphibious Aircraft Market Revenue (million) Forecast, by Application 2020 & 2033
- Table 24: Rest of South America Amphibious Aircraft Market Revenue (million) Forecast, by Application 2020 & 2033
- Table 25: Global Amphibious Aircraft Market Revenue million Forecast, by Production Analysis 2020 & 2033
- Table 26: Global Amphibious Aircraft Market Revenue million Forecast, by Consumption Analysis 2020 & 2033
- Table 27: Global Amphibious Aircraft Market Revenue million Forecast, by Import Market Analysis (Value & Volume) 2020 & 2033
- Table 28: Global Amphibious Aircraft Market Revenue million Forecast, by Export Market Analysis (Value & Volume) 2020 & 2033
- Table 29: Global Amphibious Aircraft Market Revenue million Forecast, by Price Trend Analysis 2020 & 2033
- Table 30: Global Amphibious Aircraft Market Revenue million Forecast, by Country 2020 & 2033
- Table 31: United Kingdom Amphibious Aircraft Market Revenue (million) Forecast, by Application 2020 & 2033
- Table 32: Germany Amphibious Aircraft Market Revenue (million) Forecast, by Application 2020 & 2033
- Table 33: France Amphibious Aircraft Market Revenue (million) Forecast, by Application 2020 & 2033
- Table 34: Italy Amphibious Aircraft Market Revenue (million) Forecast, by Application 2020 & 2033
- Table 35: Spain Amphibious Aircraft Market Revenue (million) Forecast, by Application 2020 & 2033
- Table 36: Russia Amphibious Aircraft Market Revenue (million) Forecast, by Application 2020 & 2033
- Table 37: Benelux Amphibious Aircraft Market Revenue (million) Forecast, by Application 2020 & 2033
- Table 38: Nordics Amphibious Aircraft Market Revenue (million) Forecast, by Application 2020 & 2033
- Table 39: Rest of Europe Amphibious Aircraft Market Revenue (million) Forecast, by Application 2020 & 2033
- Table 40: Global Amphibious Aircraft Market Revenue million Forecast, by Production Analysis 2020 & 2033
- Table 41: Global Amphibious Aircraft Market Revenue million Forecast, by Consumption Analysis 2020 & 2033
- Table 42: Global Amphibious Aircraft Market Revenue million Forecast, by Import Market Analysis (Value & Volume) 2020 & 2033
- Table 43: Global Amphibious Aircraft Market Revenue million Forecast, by Export Market Analysis (Value & Volume) 2020 & 2033
- Table 44: Global Amphibious Aircraft Market Revenue million Forecast, by Price Trend Analysis 2020 & 2033
- Table 45: Global Amphibious Aircraft Market Revenue million Forecast, by Country 2020 & 2033
- Table 46: Turkey Amphibious Aircraft Market Revenue (million) Forecast, by Application 2020 & 2033
- Table 47: Israel Amphibious Aircraft Market Revenue (million) Forecast, by Application 2020 & 2033
- Table 48: GCC Amphibious Aircraft Market Revenue (million) Forecast, by Application 2020 & 2033
- Table 49: North Africa Amphibious Aircraft Market Revenue (million) Forecast, by Application 2020 & 2033
- Table 50: South Africa Amphibious Aircraft Market Revenue (million) Forecast, by Application 2020 & 2033
- Table 51: Rest of Middle East & Africa Amphibious Aircraft Market Revenue (million) Forecast, by Application 2020 & 2033
- Table 52: Global Amphibious Aircraft Market Revenue million Forecast, by Production Analysis 2020 & 2033
- Table 53: Global Amphibious Aircraft Market Revenue million Forecast, by Consumption Analysis 2020 & 2033
- Table 54: Global Amphibious Aircraft Market Revenue million Forecast, by Import Market Analysis (Value & Volume) 2020 & 2033
- Table 55: Global Amphibious Aircraft Market Revenue million Forecast, by Export Market Analysis (Value & Volume) 2020 & 2033
- Table 56: Global Amphibious Aircraft Market Revenue million Forecast, by Price Trend Analysis 2020 & 2033
- Table 57: Global Amphibious Aircraft Market Revenue million Forecast, by Country 2020 & 2033
- Table 58: China Amphibious Aircraft Market Revenue (million) Forecast, by Application 2020 & 2033
- Table 59: India Amphibious Aircraft Market Revenue (million) Forecast, by Application 2020 & 2033
- Table 60: Japan Amphibious Aircraft Market Revenue (million) Forecast, by Application 2020 & 2033
- Table 61: South Korea Amphibious Aircraft Market Revenue (million) Forecast, by Application 2020 & 2033
- Table 62: ASEAN Amphibious Aircraft Market Revenue (million) Forecast, by Application 2020 & 2033
- Table 63: Oceania Amphibious Aircraft Market Revenue (million) Forecast, by Application 2020 & 2033
- Table 64: Rest of Asia Pacific Amphibious Aircraft Market Revenue (million) Forecast, by Application 2020 & 2033
Frequently Asked Questions
1. What is the projected Compound Annual Growth Rate (CAGR) of the Amphibious Aircraft Market?
The projected CAGR is approximately 9.89%.
2. Which companies are prominent players in the Amphibious Aircraft Market?
Key companies in the market include MVP Aero, ShinMaywa Industries Ltd, Aviation Industry Corporation of China (AVIC), Viking Air Ltd, FAULHABER MICROMO LLC, Atol Avion, Vickers Aircraft Company Limited, LISA Airplanes, United Aircraft Corporation, Equator Aircraft AS, Flywhale Aircraft GmbH & Co KG, Aero Adventure LLC, Seawings International, ICON Aircraft Inc.
3. What are the main segments of the Amphibious Aircraft Market?
The market segments include Production Analysis, Consumption Analysis, Import Market Analysis (Value & Volume), Export Market Analysis (Value & Volume), Price Trend Analysis.
4. Can you provide details about the market size?
The market size is estimated to be USD 283.79 million as of 2022.
5. What are some drivers contributing to market growth?
Increase in Internet of Things (IoT) and Autonomous Systems; Rise in Demand for Military and Defense Satellite Communication Solutions.
6. What are the notable trends driving market growth?
Military Segment of the Market is Expected to Witness Decent Growth Rate During the Forecast Period.
7. Are there any restraints impacting market growth?
Cybersecurity Threats to Satellite Communication; Interference in Transmission of Data.
8. Can you provide examples of recent developments in the market?
N/A
9. What pricing options are available for accessing the report?
Pricing options include single-user, multi-user, and enterprise licenses priced at USD 4750, USD 5250, and USD 8750 respectively.
10. Is the market size provided in terms of value or volume?
The market size is provided in terms of value, measured in million.
11. Are there any specific market keywords associated with the report?
Yes, the market keyword associated with the report is "Amphibious Aircraft Market," which aids in identifying and referencing the specific market segment covered.
12. How do I determine which pricing option suits my needs best?
The pricing options vary based on user requirements and access needs. Individual users may opt for single-user licenses, while businesses requiring broader access may choose multi-user or enterprise licenses for cost-effective access to the report.
13. Are there any additional resources or data provided in the Amphibious Aircraft Market report?
While the report offers comprehensive insights, it's advisable to review the specific contents or supplementary materials provided to ascertain if additional resources or data are available.
14. How can I stay updated on further developments or reports in the Amphibious Aircraft Market?
To stay informed about further developments, trends, and reports in the Amphibious Aircraft Market, consider subscribing to industry newsletters, following relevant companies and organizations, or regularly checking reputable industry news sources and publications.
Methodology
Step 1 - Identification of Relevant Samples Size from Population Database


Step 2 - Approaches for Defining Global Market Size (Value, Volume* & Price*)

Note*: In applicable scenarios
Step 3 - Data Sources
Primary Research
- Web Analytics
- Survey Reports
- Research Institute
- Latest Research Reports
- Opinion Leaders
Secondary Research
- Annual Reports
- White Paper
- Latest Press Release
- Industry Association
- Paid Database
- Investor Presentations

Step 4 - Data Triangulation
Involves using different sources of information in order to increase the validity of a study
These sources are likely to be stakeholders in a program - participants, other researchers, program staff, other community members, and so on.
Then we put all data in single framework & apply various statistical tools to find out the dynamic on the market.
During the analysis stage, feedback from the stakeholder groups would be compared to determine areas of agreement as well as areas of divergence