
Key Insights
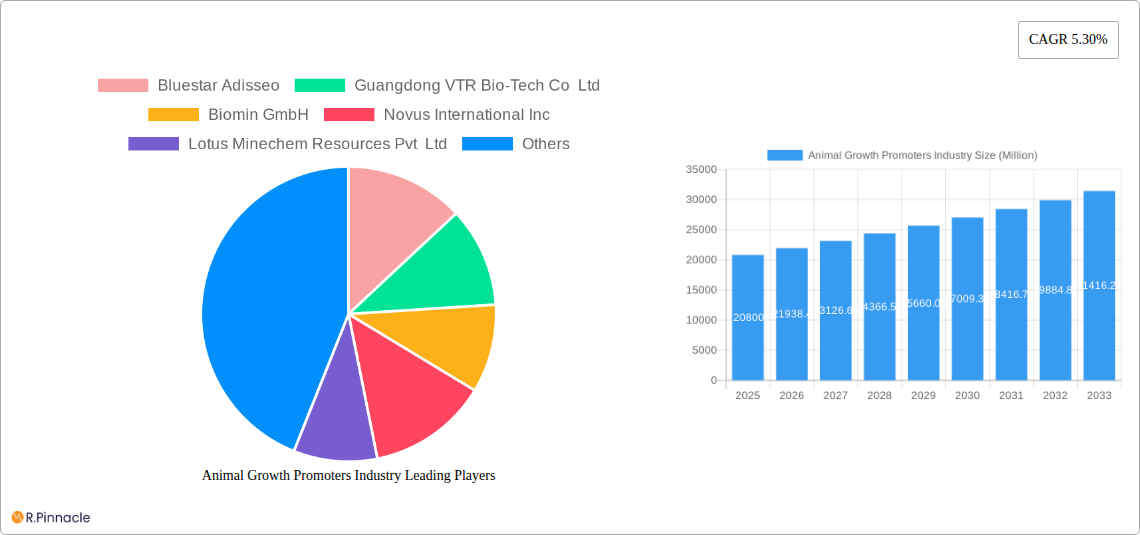
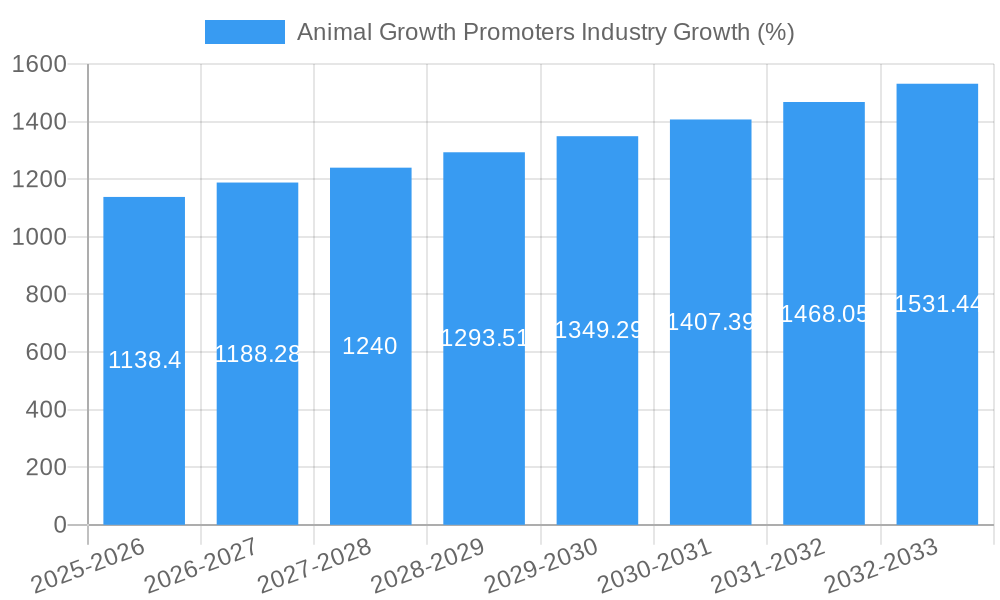
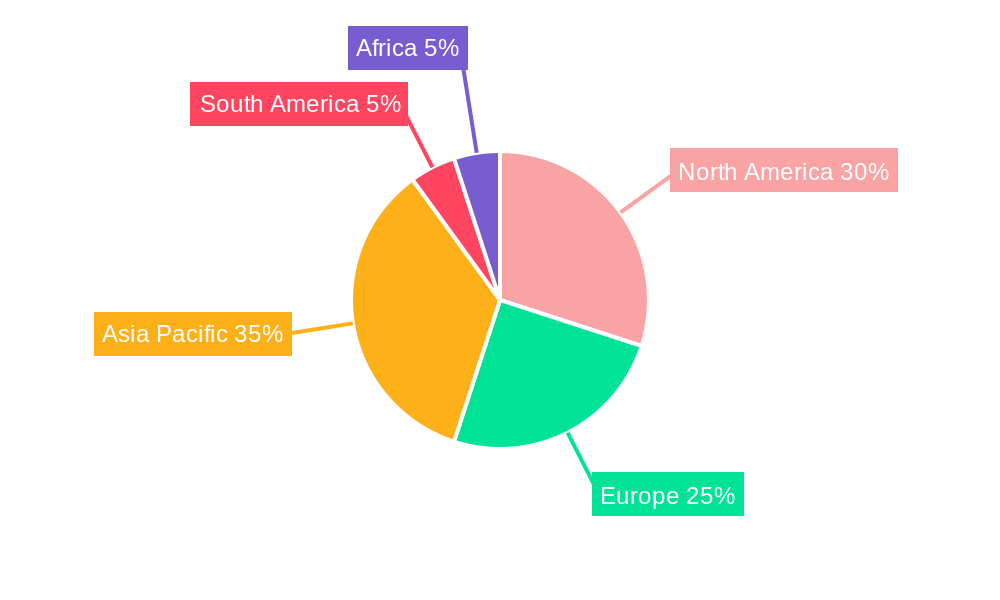
The global animal growth promoters market, valued at $20.80 billion in 2025, is projected to experience robust growth, driven by the increasing demand for animal protein globally and the rising focus on improving livestock productivity and feed efficiency. A compound annual growth rate (CAGR) of 5.3% is anticipated from 2025 to 2033, indicating a significant expansion of the market. Key drivers include the growing global population and rising per capita meat consumption, particularly in developing economies. Furthermore, advancements in animal nutrition and the development of novel, more effective growth promoters, such as advanced probiotics and prebiotics tailored to specific animal species, are fueling market expansion. Stringent regulations regarding the use of antibiotics as growth promoters in certain regions are also prompting the shift toward alternative solutions within the market. The market is segmented by animal type (ruminants, poultry, swine, aquaculture, others) and product type (probiotics, prebiotics, phytogenics, acidifiers, others). Poultry and swine segments are currently leading the market, while the aquaculture segment is anticipated to experience significant growth due to the increasing demand for seafood. The North American and European markets currently hold a substantial market share, but Asia-Pacific is expected to witness rapid growth driven by increasing livestock production in countries like China and India.
Market restraints include concerns regarding the potential long-term effects of some growth promoters on animal health and the environment, leading to stricter regulatory scrutiny and consumer demand for sustainably produced animal products. Fluctuations in raw material prices and the economic climate also influence market dynamics. The competitive landscape is characterized by the presence of numerous established players, including multinational corporations and specialized companies, constantly innovating and expanding their product portfolios to cater to the evolving needs of the animal agriculture industry. This competitive landscape drives the development of high-quality, cost-effective products and fuels further market growth through increased product availability and customer choice.
Animal Growth Promoters Market Report: 2019-2033
This comprehensive report provides an in-depth analysis of the Animal Growth Promoters (AGP) industry, offering invaluable insights for industry professionals, investors, and strategic decision-makers. With a study period spanning 2019-2033, a base year of 2025, and a forecast period of 2025-2033, this report illuminates the market's current state and future trajectory. The global market is projected to reach xx Million by 2033, exhibiting a robust CAGR of xx% during the forecast period.
Animal Growth Promoters Industry Market Structure & Innovation Trends
The Animal Growth Promoters market is moderately concentrated, with key players like Bluestar Adisseo, BASF SE, and DSM holding significant market share, estimated collectively at xx%. However, numerous smaller players contribute to the market's dynamism. Innovation is driven by increasing demand for sustainable and efficient animal production practices, coupled with stringent regulations regarding antibiotic use. Key innovation areas include the development of novel probiotics, prebiotics, and phytogenics, along with advancements in acidifier formulations. M&A activity has been relatively moderate in recent years, with deal values totaling approximately xx Million over the past five years, primarily focused on consolidating market share and expanding product portfolios. The industry is also witnessing the emergence of product substitutes, such as natural feed additives, driven by growing consumer preference for naturally raised livestock and aquaculture products. End-user demographics show a strong emphasis on large-scale commercial farms and integrated aquaculture operations.
Animal Growth Promoters Industry Market Dynamics & Trends
The AGP market's growth is primarily driven by the rising global demand for animal protein, fueled by population growth and increasing per capita consumption in developing economies. Technological advancements in feed formulation and animal nutrition management are also contributing to market expansion. This includes the development of precision feeding technologies and data-driven approaches to optimizing animal health and growth. Consumer preferences toward healthier and ethically sourced animal products are creating demand for natural and sustainable AGPs. This is impacting market dynamics by driving investment in research and development of alternative solutions, and affecting the adoption of specific product types. Competitive dynamics are characterized by intense rivalry among established players and the emergence of new entrants offering innovative products. The market penetration of probiotics and phytogenics is steadily increasing, while the use of antibiotics is declining due to growing regulatory pressure. The market is expected to experience a CAGR of xx% from 2025 to 2033, reaching a market value of xx Million.
Dominant Regions & Segments in Animal Growth Promoters Industry
The Poultry segment currently dominates the Animal Growth Promoters market, accounting for approximately xx% of the total market value in 2025. This is followed by the Swine and Ruminant segments. Geographically, North America and Europe hold significant market share, due to the high concentration of advanced animal farming practices and stringent regulations. However, the Asia-Pacific region is projected to exhibit the highest growth rate during the forecast period, driven by expanding livestock production and increasing investments in the agricultural sector.
- Key Drivers for Poultry Segment Dominance: High poultry meat consumption, intensive farming practices, and strong focus on feed efficiency.
- Key Drivers for North America/Europe Dominance: Advanced animal husbandry techniques, stringent regulatory frameworks, and high consumer awareness of animal health.
- Key Drivers for Asia-Pacific Growth: Rapid economic growth, rising middle-class incomes, expanding livestock populations, and increasing investments in modern farming infrastructure.
Detailed analysis reveals that the probiotics segment within the product type category demonstrates significant growth potential, driven by consumer preference for natural products.
Animal Growth Promoters Industry Product Innovations
Recent product innovations focus on enhancing the efficacy and sustainability of AGPs. This includes the development of novel probiotic strains with improved resilience and effectiveness in diverse animal species and feeding systems. Advanced prebiotic formulations enhance gut health and nutrient absorption. Phytogenic products are gaining traction due to their natural origin and beneficial effects on animal performance and immune function. These developments are responding to market demands for safe and environmentally friendly solutions, while improving overall efficiency in animal production.
Report Scope & Segmentation Analysis
This report segments the AGP market by animal type (Ruminant, Poultry, Swine, Aquaculture, Other Animal Types) and product type (Probiotics, Prebiotics, Phytogenics, Acidifiers, Other Types). Each segment is analyzed in detail, providing insights into its market size, growth projections, competitive landscape, and key drivers. For instance, the ruminant segment shows steady growth, driven by the increasing demand for dairy and meat products. The aquaculture segment is experiencing rapid expansion due to growing global seafood consumption. Within product types, probiotics are gaining popularity due to their health benefits and sustainability. The prebiotics market is expanding due to its synergistic effects with probiotics.
Key Drivers of Animal Growth Promoters Industry Growth
The growth of the AGP industry is driven by several factors: the rising global demand for animal protein; increasing consumer awareness of animal health and welfare; technological advancements in animal nutrition and feed formulation; the growing adoption of sustainable and environmentally friendly animal farming practices; and supportive government policies and investments in the agricultural sector.
Challenges in the Animal Growth Promoters Industry Sector
The AGP industry faces several challenges: stringent regulatory requirements regarding the use of certain additives; fluctuations in raw material prices; increasing competition from alternative feed additives; and potential supply chain disruptions due to geopolitical factors. These factors can impact profitability and market growth.
Emerging Opportunities in Animal Growth Promoters Industry
The AGP industry presents numerous emerging opportunities. The growing demand for sustainable and eco-friendly products presents a significant opportunity for companies focusing on natural and organically sourced AGPs. Moreover, the development and commercialization of precision feeding technologies and data-driven approaches are expected to enhance the efficiency and efficacy of AGP utilization, driving further market expansion.
Leading Players in the Animal Growth Promoters Industry Market
- Bluestar Adisseo
- Guangdong VTR Bio-Tech Co Ltd
- Biomin GmbH
- Novus International Inc
- Lotus Minechem Resources Pvt Ltd
- Kemin Industries
- Chr Hansen A/S
- BASF SE
- DSM
- Alltech Inc
- Dupont De Nemours Inc
- Cargill Inc
- Novozymes A/S
- Elanco Animal Health Incorporated
- Zoetis Inc
Key Developments in Animal Growth Promoters Industry Industry
- 2022 Q4: Launch of a new probiotic blend by Chr Hansen A/S for poultry.
- 2023 Q1: Acquisition of a smaller AGP producer by DSM.
- 2023 Q3: Regulatory approval of a novel phytogenic additive by a major player. (Further details unavailable, xx)
Future Outlook for Animal Growth Promoters Industry Market
The future of the AGP market looks promising. The continuing rise in global meat consumption and the increasing focus on sustainable and efficient animal production are expected to drive significant growth. The development of innovative products with improved efficacy and environmental sustainability will be crucial for success in this dynamic market. Strategic partnerships and investments in research and development will play a significant role in shaping the future of the AGP industry.
Animal Growth Promoters Industry Segmentation
-
1. Type
- 1.1. Probiotics
- 1.2. Prebiotics
- 1.3. Phytogenics
- 1.4. Acidifiers
- 1.5. Other Types
-
2. Animal Type
- 2.1. Ruminant
- 2.2. Poultry
- 2.3. Swine
- 2.4. Aquaculture
- 2.5. Other Animal Types
Animal Growth Promoters Industry Segmentation By Geography
-
1. North America
- 1.1. United States
- 1.2. Canada
- 1.3. Mexico
- 1.4. Rest of North America
-
2. Europe
- 2.1. Germany
- 2.2. United Kingdom
- 2.3. France
- 2.4. Russia
- 2.5. Spain
- 2.6. Rest of Europe
-
3. Asia Pacific
- 3.1. China
- 3.2. Japan
- 3.3. India
- 3.4. Australia
- 3.5. Rest of Asia Pacific
-
4. South America
- 4.1. Brazil
- 4.2. Argentina
- 4.3. Rest of South America
-
5. Africa
- 5.1. South Africa
- 5.2. Rest of Africa
Animal Growth Promoters Industry REPORT HIGHLIGHTS
| Aspects | Details |
|---|---|
| Study Period | 2019-2033 |
| Base Year | 2024 |
| Estimated Year | 2025 |
| Forecast Period | 2025-2033 |
| Historical Period | 2019-2024 |
| Growth Rate | CAGR of 5.30% from 2019-2033 |
| Segmentation |
|
Table of Contents
- 1. Introduction
- 1.1. Research Scope
- 1.2. Market Segmentation
- 1.3. Research Methodology
- 1.4. Definitions and Assumptions
- 2. Executive Summary
- 2.1. Introduction
- 3. Market Dynamics
- 3.1. Introduction
- 3.2. Market Drivers
- 3.2.1. Increased Demand for Meat; Initiatives By the Key Players; Focus on Animal nutrition and Health
- 3.3. Market Restrains
- 3.3.1. Shift Toward Vegan- Based Diet; Changing Raw Material Prices and Strict Government Rules to Restrict Market Growth
- 3.4. Market Trends
- 3.4.1. The Rise in Demand for Meat Boosting the Market
- 4. Market Factor Analysis
- 4.1. Porters Five Forces
- 4.2. Supply/Value Chain
- 4.3. PESTEL analysis
- 4.4. Market Entropy
- 4.5. Patent/Trademark Analysis
- 5. Global Animal Growth Promoters Industry Analysis, Insights and Forecast, 2019-2031
- 5.1. Market Analysis, Insights and Forecast - by Type
- 5.1.1. Probiotics
- 5.1.2. Prebiotics
- 5.1.3. Phytogenics
- 5.1.4. Acidifiers
- 5.1.5. Other Types
- 5.2. Market Analysis, Insights and Forecast - by Animal Type
- 5.2.1. Ruminant
- 5.2.2. Poultry
- 5.2.3. Swine
- 5.2.4. Aquaculture
- 5.2.5. Other Animal Types
- 5.3. Market Analysis, Insights and Forecast - by Region
- 5.3.1. North America
- 5.3.2. Europe
- 5.3.3. Asia Pacific
- 5.3.4. South America
- 5.3.5. Africa
- 5.1. Market Analysis, Insights and Forecast - by Type
- 6. North America Animal Growth Promoters Industry Analysis, Insights and Forecast, 2019-2031
- 6.1. Market Analysis, Insights and Forecast - by Type
- 6.1.1. Probiotics
- 6.1.2. Prebiotics
- 6.1.3. Phytogenics
- 6.1.4. Acidifiers
- 6.1.5. Other Types
- 6.2. Market Analysis, Insights and Forecast - by Animal Type
- 6.2.1. Ruminant
- 6.2.2. Poultry
- 6.2.3. Swine
- 6.2.4. Aquaculture
- 6.2.5. Other Animal Types
- 6.1. Market Analysis, Insights and Forecast - by Type
- 7. Europe Animal Growth Promoters Industry Analysis, Insights and Forecast, 2019-2031
- 7.1. Market Analysis, Insights and Forecast - by Type
- 7.1.1. Probiotics
- 7.1.2. Prebiotics
- 7.1.3. Phytogenics
- 7.1.4. Acidifiers
- 7.1.5. Other Types
- 7.2. Market Analysis, Insights and Forecast - by Animal Type
- 7.2.1. Ruminant
- 7.2.2. Poultry
- 7.2.3. Swine
- 7.2.4. Aquaculture
- 7.2.5. Other Animal Types
- 7.1. Market Analysis, Insights and Forecast - by Type
- 8. Asia Pacific Animal Growth Promoters Industry Analysis, Insights and Forecast, 2019-2031
- 8.1. Market Analysis, Insights and Forecast - by Type
- 8.1.1. Probiotics
- 8.1.2. Prebiotics
- 8.1.3. Phytogenics
- 8.1.4. Acidifiers
- 8.1.5. Other Types
- 8.2. Market Analysis, Insights and Forecast - by Animal Type
- 8.2.1. Ruminant
- 8.2.2. Poultry
- 8.2.3. Swine
- 8.2.4. Aquaculture
- 8.2.5. Other Animal Types
- 8.1. Market Analysis, Insights and Forecast - by Type
- 9. South America Animal Growth Promoters Industry Analysis, Insights and Forecast, 2019-2031
- 9.1. Market Analysis, Insights and Forecast - by Type
- 9.1.1. Probiotics
- 9.1.2. Prebiotics
- 9.1.3. Phytogenics
- 9.1.4. Acidifiers
- 9.1.5. Other Types
- 9.2. Market Analysis, Insights and Forecast - by Animal Type
- 9.2.1. Ruminant
- 9.2.2. Poultry
- 9.2.3. Swine
- 9.2.4. Aquaculture
- 9.2.5. Other Animal Types
- 9.1. Market Analysis, Insights and Forecast - by Type
- 10. Africa Animal Growth Promoters Industry Analysis, Insights and Forecast, 2019-2031
- 10.1. Market Analysis, Insights and Forecast - by Type
- 10.1.1. Probiotics
- 10.1.2. Prebiotics
- 10.1.3. Phytogenics
- 10.1.4. Acidifiers
- 10.1.5. Other Types
- 10.2. Market Analysis, Insights and Forecast - by Animal Type
- 10.2.1. Ruminant
- 10.2.2. Poultry
- 10.2.3. Swine
- 10.2.4. Aquaculture
- 10.2.5. Other Animal Types
- 10.1. Market Analysis, Insights and Forecast - by Type
- 11. North America Animal Growth Promoters Industry Analysis, Insights and Forecast, 2019-2031
- 11.1. Market Analysis, Insights and Forecast - By Country/Sub-region
- 11.1.1 United States
- 11.1.2 Canada
- 11.1.3 Mexico
- 11.1.4 Rest of North America
- 12. Europe Animal Growth Promoters Industry Analysis, Insights and Forecast, 2019-2031
- 12.1. Market Analysis, Insights and Forecast - By Country/Sub-region
- 12.1.1 Germany
- 12.1.2 United Kingdom
- 12.1.3 France
- 12.1.4 Russia
- 12.1.5 Spain
- 12.1.6 Rest of Europe
- 13. Asia Pacific Animal Growth Promoters Industry Analysis, Insights and Forecast, 2019-2031
- 13.1. Market Analysis, Insights and Forecast - By Country/Sub-region
- 13.1.1 China
- 13.1.2 Japan
- 13.1.3 India
- 13.1.4 Australia
- 13.1.5 Rest of Asia Pacific
- 14. South America Animal Growth Promoters Industry Analysis, Insights and Forecast, 2019-2031
- 14.1. Market Analysis, Insights and Forecast - By Country/Sub-region
- 14.1.1 Brazil
- 14.1.2 Argentina
- 14.1.3 Rest of South America
- 15. Africa Animal Growth Promoters Industry Analysis, Insights and Forecast, 2019-2031
- 15.1. Market Analysis, Insights and Forecast - By Country/Sub-region
- 15.1.1 South Africa
- 15.1.2 Rest of Africa
- 16. Competitive Analysis
- 16.1. Global Market Share Analysis 2024
- 16.2. Company Profiles
- 16.2.1 Bluestar Adisseo
- 16.2.1.1. Overview
- 16.2.1.2. Products
- 16.2.1.3. SWOT Analysis
- 16.2.1.4. Recent Developments
- 16.2.1.5. Financials (Based on Availability)
- 16.2.2 Guangdong VTR Bio-Tech Co Ltd
- 16.2.2.1. Overview
- 16.2.2.2. Products
- 16.2.2.3. SWOT Analysis
- 16.2.2.4. Recent Developments
- 16.2.2.5. Financials (Based on Availability)
- 16.2.3 Biomin GmbH
- 16.2.3.1. Overview
- 16.2.3.2. Products
- 16.2.3.3. SWOT Analysis
- 16.2.3.4. Recent Developments
- 16.2.3.5. Financials (Based on Availability)
- 16.2.4 Novus International Inc
- 16.2.4.1. Overview
- 16.2.4.2. Products
- 16.2.4.3. SWOT Analysis
- 16.2.4.4. Recent Developments
- 16.2.4.5. Financials (Based on Availability)
- 16.2.5 Lotus Minechem Resources Pvt Ltd
- 16.2.5.1. Overview
- 16.2.5.2. Products
- 16.2.5.3. SWOT Analysis
- 16.2.5.4. Recent Developments
- 16.2.5.5. Financials (Based on Availability)
- 16.2.6 Kemin Industries
- 16.2.6.1. Overview
- 16.2.6.2. Products
- 16.2.6.3. SWOT Analysis
- 16.2.6.4. Recent Developments
- 16.2.6.5. Financials (Based on Availability)
- 16.2.7 Chr Hansen A/
- 16.2.7.1. Overview
- 16.2.7.2. Products
- 16.2.7.3. SWOT Analysis
- 16.2.7.4. Recent Developments
- 16.2.7.5. Financials (Based on Availability)
- 16.2.8 BASF SE
- 16.2.8.1. Overview
- 16.2.8.2. Products
- 16.2.8.3. SWOT Analysis
- 16.2.8.4. Recent Developments
- 16.2.8.5. Financials (Based on Availability)
- 16.2.9 DSM
- 16.2.9.1. Overview
- 16.2.9.2. Products
- 16.2.9.3. SWOT Analysis
- 16.2.9.4. Recent Developments
- 16.2.9.5. Financials (Based on Availability)
- 16.2.10 Alltech Inc
- 16.2.10.1. Overview
- 16.2.10.2. Products
- 16.2.10.3. SWOT Analysis
- 16.2.10.4. Recent Developments
- 16.2.10.5. Financials (Based on Availability)
- 16.2.11 Dupont De Nemours Inc
- 16.2.11.1. Overview
- 16.2.11.2. Products
- 16.2.11.3. SWOT Analysis
- 16.2.11.4. Recent Developments
- 16.2.11.5. Financials (Based on Availability)
- 16.2.12 Cargill Inc
- 16.2.12.1. Overview
- 16.2.12.2. Products
- 16.2.12.3. SWOT Analysis
- 16.2.12.4. Recent Developments
- 16.2.12.5. Financials (Based on Availability)
- 16.2.13 Novozymes A/S
- 16.2.13.1. Overview
- 16.2.13.2. Products
- 16.2.13.3. SWOT Analysis
- 16.2.13.4. Recent Developments
- 16.2.13.5. Financials (Based on Availability)
- 16.2.14 Elanco Animal Health Incorporated
- 16.2.14.1. Overview
- 16.2.14.2. Products
- 16.2.14.3. SWOT Analysis
- 16.2.14.4. Recent Developments
- 16.2.14.5. Financials (Based on Availability)
- 16.2.15 Zoetis Inc
- 16.2.15.1. Overview
- 16.2.15.2. Products
- 16.2.15.3. SWOT Analysis
- 16.2.15.4. Recent Developments
- 16.2.15.5. Financials (Based on Availability)
- 16.2.1 Bluestar Adisseo
List of Figures
- Figure 1: Global Animal Growth Promoters Industry Revenue Breakdown (Million, %) by Region 2024 & 2032
- Figure 2: North America Animal Growth Promoters Industry Revenue (Million), by Country 2024 & 2032
- Figure 3: North America Animal Growth Promoters Industry Revenue Share (%), by Country 2024 & 2032
- Figure 4: Europe Animal Growth Promoters Industry Revenue (Million), by Country 2024 & 2032
- Figure 5: Europe Animal Growth Promoters Industry Revenue Share (%), by Country 2024 & 2032
- Figure 6: Asia Pacific Animal Growth Promoters Industry Revenue (Million), by Country 2024 & 2032
- Figure 7: Asia Pacific Animal Growth Promoters Industry Revenue Share (%), by Country 2024 & 2032
- Figure 8: South America Animal Growth Promoters Industry Revenue (Million), by Country 2024 & 2032
- Figure 9: South America Animal Growth Promoters Industry Revenue Share (%), by Country 2024 & 2032
- Figure 10: Africa Animal Growth Promoters Industry Revenue (Million), by Country 2024 & 2032
- Figure 11: Africa Animal Growth Promoters Industry Revenue Share (%), by Country 2024 & 2032
- Figure 12: North America Animal Growth Promoters Industry Revenue (Million), by Type 2024 & 2032
- Figure 13: North America Animal Growth Promoters Industry Revenue Share (%), by Type 2024 & 2032
- Figure 14: North America Animal Growth Promoters Industry Revenue (Million), by Animal Type 2024 & 2032
- Figure 15: North America Animal Growth Promoters Industry Revenue Share (%), by Animal Type 2024 & 2032
- Figure 16: North America Animal Growth Promoters Industry Revenue (Million), by Country 2024 & 2032
- Figure 17: North America Animal Growth Promoters Industry Revenue Share (%), by Country 2024 & 2032
- Figure 18: Europe Animal Growth Promoters Industry Revenue (Million), by Type 2024 & 2032
- Figure 19: Europe Animal Growth Promoters Industry Revenue Share (%), by Type 2024 & 2032
- Figure 20: Europe Animal Growth Promoters Industry Revenue (Million), by Animal Type 2024 & 2032
- Figure 21: Europe Animal Growth Promoters Industry Revenue Share (%), by Animal Type 2024 & 2032
- Figure 22: Europe Animal Growth Promoters Industry Revenue (Million), by Country 2024 & 2032
- Figure 23: Europe Animal Growth Promoters Industry Revenue Share (%), by Country 2024 & 2032
- Figure 24: Asia Pacific Animal Growth Promoters Industry Revenue (Million), by Type 2024 & 2032
- Figure 25: Asia Pacific Animal Growth Promoters Industry Revenue Share (%), by Type 2024 & 2032
- Figure 26: Asia Pacific Animal Growth Promoters Industry Revenue (Million), by Animal Type 2024 & 2032
- Figure 27: Asia Pacific Animal Growth Promoters Industry Revenue Share (%), by Animal Type 2024 & 2032
- Figure 28: Asia Pacific Animal Growth Promoters Industry Revenue (Million), by Country 2024 & 2032
- Figure 29: Asia Pacific Animal Growth Promoters Industry Revenue Share (%), by Country 2024 & 2032
- Figure 30: South America Animal Growth Promoters Industry Revenue (Million), by Type 2024 & 2032
- Figure 31: South America Animal Growth Promoters Industry Revenue Share (%), by Type 2024 & 2032
- Figure 32: South America Animal Growth Promoters Industry Revenue (Million), by Animal Type 2024 & 2032
- Figure 33: South America Animal Growth Promoters Industry Revenue Share (%), by Animal Type 2024 & 2032
- Figure 34: South America Animal Growth Promoters Industry Revenue (Million), by Country 2024 & 2032
- Figure 35: South America Animal Growth Promoters Industry Revenue Share (%), by Country 2024 & 2032
- Figure 36: Africa Animal Growth Promoters Industry Revenue (Million), by Type 2024 & 2032
- Figure 37: Africa Animal Growth Promoters Industry Revenue Share (%), by Type 2024 & 2032
- Figure 38: Africa Animal Growth Promoters Industry Revenue (Million), by Animal Type 2024 & 2032
- Figure 39: Africa Animal Growth Promoters Industry Revenue Share (%), by Animal Type 2024 & 2032
- Figure 40: Africa Animal Growth Promoters Industry Revenue (Million), by Country 2024 & 2032
- Figure 41: Africa Animal Growth Promoters Industry Revenue Share (%), by Country 2024 & 2032
List of Tables
- Table 1: Global Animal Growth Promoters Industry Revenue Million Forecast, by Region 2019 & 2032
- Table 2: Global Animal Growth Promoters Industry Revenue Million Forecast, by Type 2019 & 2032
- Table 3: Global Animal Growth Promoters Industry Revenue Million Forecast, by Animal Type 2019 & 2032
- Table 4: Global Animal Growth Promoters Industry Revenue Million Forecast, by Region 2019 & 2032
- Table 5: Global Animal Growth Promoters Industry Revenue Million Forecast, by Country 2019 & 2032
- Table 6: United States Animal Growth Promoters Industry Revenue (Million) Forecast, by Application 2019 & 2032
- Table 7: Canada Animal Growth Promoters Industry Revenue (Million) Forecast, by Application 2019 & 2032
- Table 8: Mexico Animal Growth Promoters Industry Revenue (Million) Forecast, by Application 2019 & 2032
- Table 9: Rest of North America Animal Growth Promoters Industry Revenue (Million) Forecast, by Application 2019 & 2032
- Table 10: Global Animal Growth Promoters Industry Revenue Million Forecast, by Country 2019 & 2032
- Table 11: Germany Animal Growth Promoters Industry Revenue (Million) Forecast, by Application 2019 & 2032
- Table 12: United Kingdom Animal Growth Promoters Industry Revenue (Million) Forecast, by Application 2019 & 2032
- Table 13: France Animal Growth Promoters Industry Revenue (Million) Forecast, by Application 2019 & 2032
- Table 14: Russia Animal Growth Promoters Industry Revenue (Million) Forecast, by Application 2019 & 2032
- Table 15: Spain Animal Growth Promoters Industry Revenue (Million) Forecast, by Application 2019 & 2032
- Table 16: Rest of Europe Animal Growth Promoters Industry Revenue (Million) Forecast, by Application 2019 & 2032
- Table 17: Global Animal Growth Promoters Industry Revenue Million Forecast, by Country 2019 & 2032
- Table 18: China Animal Growth Promoters Industry Revenue (Million) Forecast, by Application 2019 & 2032
- Table 19: Japan Animal Growth Promoters Industry Revenue (Million) Forecast, by Application 2019 & 2032
- Table 20: India Animal Growth Promoters Industry Revenue (Million) Forecast, by Application 2019 & 2032
- Table 21: Australia Animal Growth Promoters Industry Revenue (Million) Forecast, by Application 2019 & 2032
- Table 22: Rest of Asia Pacific Animal Growth Promoters Industry Revenue (Million) Forecast, by Application 2019 & 2032
- Table 23: Global Animal Growth Promoters Industry Revenue Million Forecast, by Country 2019 & 2032
- Table 24: Brazil Animal Growth Promoters Industry Revenue (Million) Forecast, by Application 2019 & 2032
- Table 25: Argentina Animal Growth Promoters Industry Revenue (Million) Forecast, by Application 2019 & 2032
- Table 26: Rest of South America Animal Growth Promoters Industry Revenue (Million) Forecast, by Application 2019 & 2032
- Table 27: Global Animal Growth Promoters Industry Revenue Million Forecast, by Country 2019 & 2032
- Table 28: South Africa Animal Growth Promoters Industry Revenue (Million) Forecast, by Application 2019 & 2032
- Table 29: Rest of Africa Animal Growth Promoters Industry Revenue (Million) Forecast, by Application 2019 & 2032
- Table 30: Global Animal Growth Promoters Industry Revenue Million Forecast, by Type 2019 & 2032
- Table 31: Global Animal Growth Promoters Industry Revenue Million Forecast, by Animal Type 2019 & 2032
- Table 32: Global Animal Growth Promoters Industry Revenue Million Forecast, by Country 2019 & 2032
- Table 33: United States Animal Growth Promoters Industry Revenue (Million) Forecast, by Application 2019 & 2032
- Table 34: Canada Animal Growth Promoters Industry Revenue (Million) Forecast, by Application 2019 & 2032
- Table 35: Mexico Animal Growth Promoters Industry Revenue (Million) Forecast, by Application 2019 & 2032
- Table 36: Rest of North America Animal Growth Promoters Industry Revenue (Million) Forecast, by Application 2019 & 2032
- Table 37: Global Animal Growth Promoters Industry Revenue Million Forecast, by Type 2019 & 2032
- Table 38: Global Animal Growth Promoters Industry Revenue Million Forecast, by Animal Type 2019 & 2032
- Table 39: Global Animal Growth Promoters Industry Revenue Million Forecast, by Country 2019 & 2032
- Table 40: Germany Animal Growth Promoters Industry Revenue (Million) Forecast, by Application 2019 & 2032
- Table 41: United Kingdom Animal Growth Promoters Industry Revenue (Million) Forecast, by Application 2019 & 2032
- Table 42: France Animal Growth Promoters Industry Revenue (Million) Forecast, by Application 2019 & 2032
- Table 43: Russia Animal Growth Promoters Industry Revenue (Million) Forecast, by Application 2019 & 2032
- Table 44: Spain Animal Growth Promoters Industry Revenue (Million) Forecast, by Application 2019 & 2032
- Table 45: Rest of Europe Animal Growth Promoters Industry Revenue (Million) Forecast, by Application 2019 & 2032
- Table 46: Global Animal Growth Promoters Industry Revenue Million Forecast, by Type 2019 & 2032
- Table 47: Global Animal Growth Promoters Industry Revenue Million Forecast, by Animal Type 2019 & 2032
- Table 48: Global Animal Growth Promoters Industry Revenue Million Forecast, by Country 2019 & 2032
- Table 49: China Animal Growth Promoters Industry Revenue (Million) Forecast, by Application 2019 & 2032
- Table 50: Japan Animal Growth Promoters Industry Revenue (Million) Forecast, by Application 2019 & 2032
- Table 51: India Animal Growth Promoters Industry Revenue (Million) Forecast, by Application 2019 & 2032
- Table 52: Australia Animal Growth Promoters Industry Revenue (Million) Forecast, by Application 2019 & 2032
- Table 53: Rest of Asia Pacific Animal Growth Promoters Industry Revenue (Million) Forecast, by Application 2019 & 2032
- Table 54: Global Animal Growth Promoters Industry Revenue Million Forecast, by Type 2019 & 2032
- Table 55: Global Animal Growth Promoters Industry Revenue Million Forecast, by Animal Type 2019 & 2032
- Table 56: Global Animal Growth Promoters Industry Revenue Million Forecast, by Country 2019 & 2032
- Table 57: Brazil Animal Growth Promoters Industry Revenue (Million) Forecast, by Application 2019 & 2032
- Table 58: Argentina Animal Growth Promoters Industry Revenue (Million) Forecast, by Application 2019 & 2032
- Table 59: Rest of South America Animal Growth Promoters Industry Revenue (Million) Forecast, by Application 2019 & 2032
- Table 60: Global Animal Growth Promoters Industry Revenue Million Forecast, by Type 2019 & 2032
- Table 61: Global Animal Growth Promoters Industry Revenue Million Forecast, by Animal Type 2019 & 2032
- Table 62: Global Animal Growth Promoters Industry Revenue Million Forecast, by Country 2019 & 2032
- Table 63: South Africa Animal Growth Promoters Industry Revenue (Million) Forecast, by Application 2019 & 2032
- Table 64: Rest of Africa Animal Growth Promoters Industry Revenue (Million) Forecast, by Application 2019 & 2032
Frequently Asked Questions
1. What is the projected Compound Annual Growth Rate (CAGR) of the Animal Growth Promoters Industry?
The projected CAGR is approximately 5.30%.
2. Which companies are prominent players in the Animal Growth Promoters Industry?
Key companies in the market include Bluestar Adisseo, Guangdong VTR Bio-Tech Co Ltd, Biomin GmbH, Novus International Inc, Lotus Minechem Resources Pvt Ltd, Kemin Industries, Chr Hansen A/, BASF SE, DSM, Alltech Inc, Dupont De Nemours Inc, Cargill Inc, Novozymes A/S, Elanco Animal Health Incorporated, Zoetis Inc.
3. What are the main segments of the Animal Growth Promoters Industry?
The market segments include Type, Animal Type.
4. Can you provide details about the market size?
The market size is estimated to be USD 20.80 Million as of 2022.
5. What are some drivers contributing to market growth?
Increased Demand for Meat; Initiatives By the Key Players; Focus on Animal nutrition and Health.
6. What are the notable trends driving market growth?
The Rise in Demand for Meat Boosting the Market.
7. Are there any restraints impacting market growth?
Shift Toward Vegan- Based Diet; Changing Raw Material Prices and Strict Government Rules to Restrict Market Growth.
8. Can you provide examples of recent developments in the market?
N/A
9. What pricing options are available for accessing the report?
Pricing options include single-user, multi-user, and enterprise licenses priced at USD 4750, USD 5250, and USD 8750 respectively.
10. Is the market size provided in terms of value or volume?
The market size is provided in terms of value, measured in Million.
11. Are there any specific market keywords associated with the report?
Yes, the market keyword associated with the report is "Animal Growth Promoters Industry," which aids in identifying and referencing the specific market segment covered.
12. How do I determine which pricing option suits my needs best?
The pricing options vary based on user requirements and access needs. Individual users may opt for single-user licenses, while businesses requiring broader access may choose multi-user or enterprise licenses for cost-effective access to the report.
13. Are there any additional resources or data provided in the Animal Growth Promoters Industry report?
While the report offers comprehensive insights, it's advisable to review the specific contents or supplementary materials provided to ascertain if additional resources or data are available.
14. How can I stay updated on further developments or reports in the Animal Growth Promoters Industry?
To stay informed about further developments, trends, and reports in the Animal Growth Promoters Industry, consider subscribing to industry newsletters, following relevant companies and organizations, or regularly checking reputable industry news sources and publications.
Methodology
Step 1 - Identification of Relevant Samples Size from Population Database


Step 2 - Approaches for Defining Global Market Size (Value, Volume* & Price*)

Note*: In applicable scenarios
Step 3 - Data Sources
Primary Research
- Web Analytics
- Survey Reports
- Research Institute
- Latest Research Reports
- Opinion Leaders
Secondary Research
- Annual Reports
- White Paper
- Latest Press Release
- Industry Association
- Paid Database
- Investor Presentations

Step 4 - Data Triangulation
Involves using different sources of information in order to increase the validity of a study
These sources are likely to be stakeholders in a program - participants, other researchers, program staff, other community members, and so on.
Then we put all data in single framework & apply various statistical tools to find out the dynamic on the market.
During the analysis stage, feedback from the stakeholder groups would be compared to determine areas of agreement as well as areas of divergence


