

Key Insights
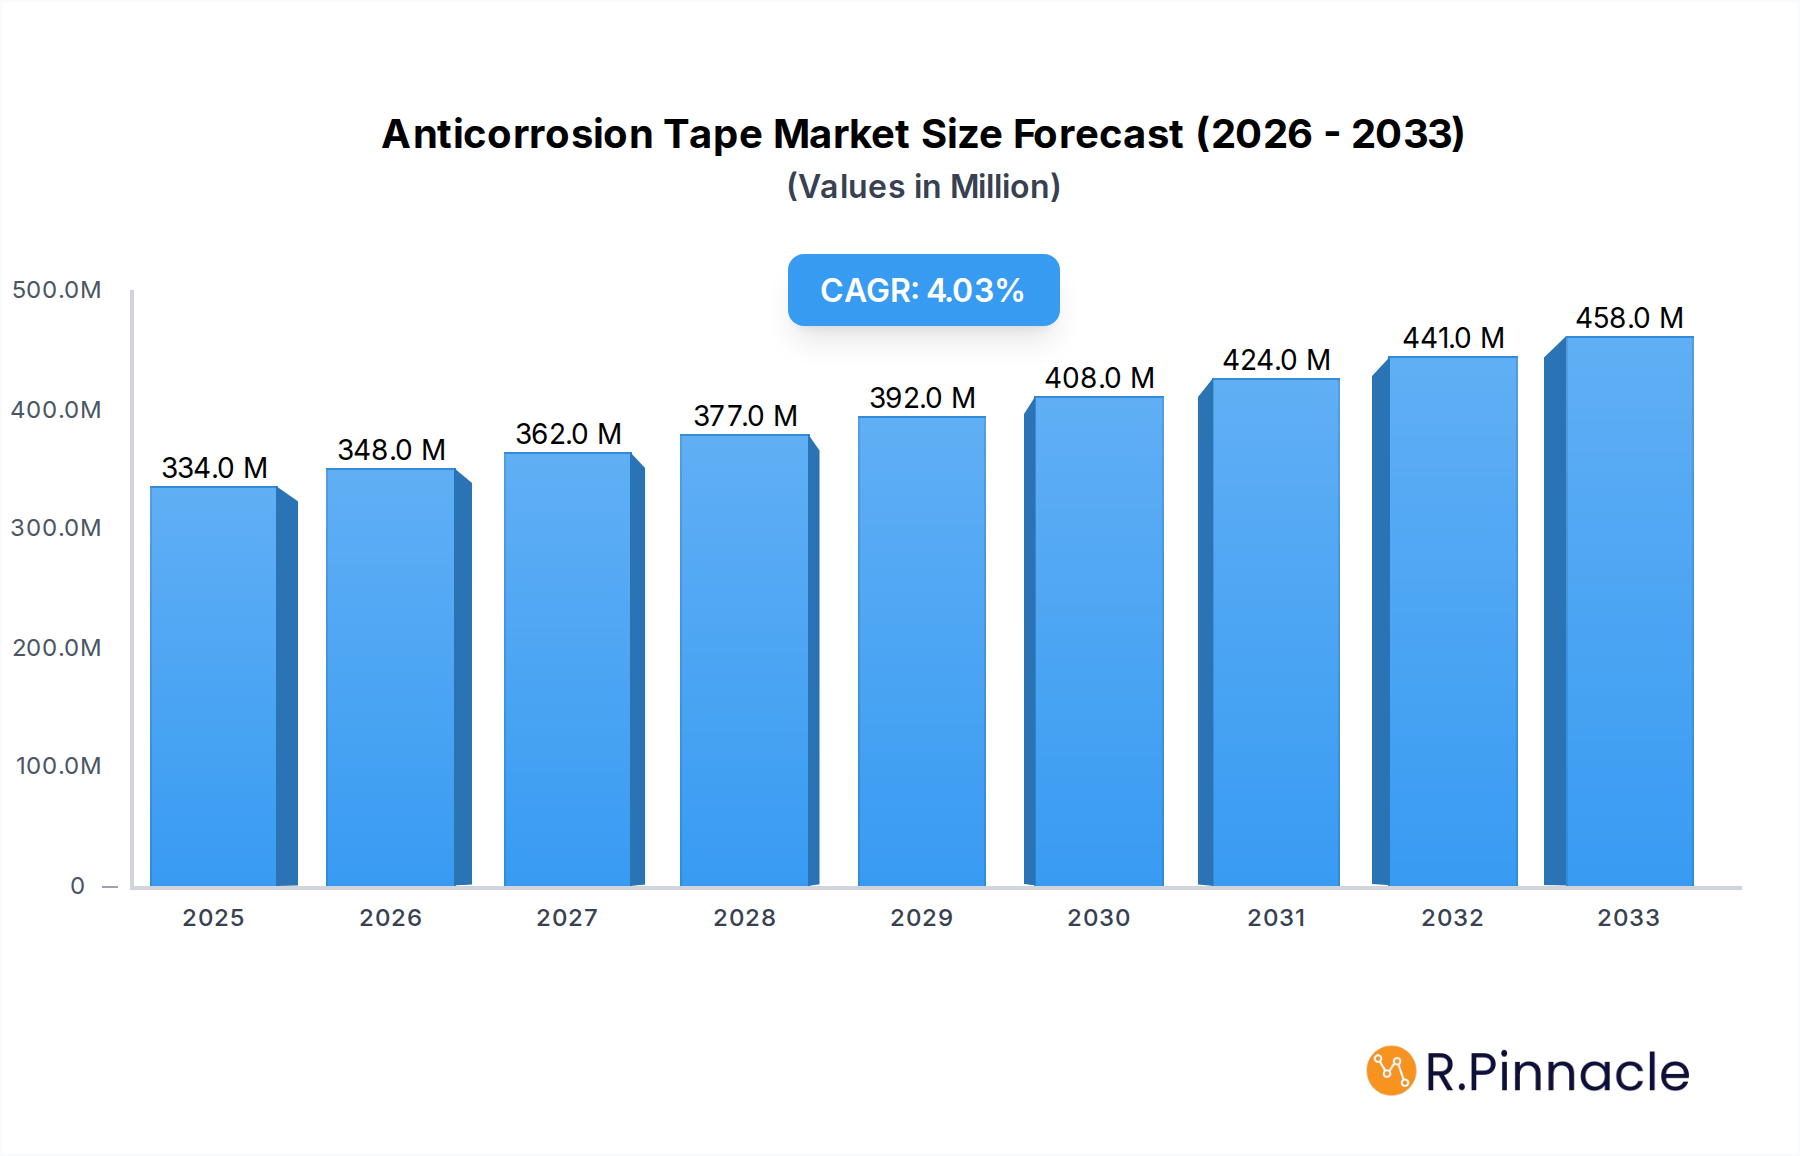
The global Anticorrosion Tape market is poised for robust expansion, projected to reach USD 334 million by 2025 and grow at a Compound Annual Growth Rate (CAGR) of 4.2% through 2033. This healthy growth trajectory is primarily fueled by the escalating demand for effective corrosion protection solutions across a multitude of industries, most notably the oil and gas sector, which relies heavily on these tapes for pipeline integrity and longevity. The chemical industry also presents a significant driver, with increasing investments in infrastructure and the need to safeguard processing equipment from harsh chemical environments. Furthermore, the water supply industry is increasingly adopting anticorrosion tapes for its extensive network of pipes, ensuring water quality and minimizing costly repairs due to corrosion. The rising awareness of the economic and environmental impact of corrosion is compelling industries worldwide to invest in preventative measures, directly bolstering the demand for advanced anticorrosion tape solutions.

Anticorrosion Tape Market Size (In Million)
Several key trends are shaping the anticorrosion tape market. The development of advanced polymer-based formulations offering superior adhesion, flexibility, and resistance to extreme temperatures and chemicals is a significant innovation. These advanced materials are increasingly replacing traditional petrolatum-based tapes in demanding applications. The market is also witnessing a growing preference for sustainable and eco-friendly anticorrosion solutions, prompting manufacturers to explore bio-based materials and more environmentally conscious production processes. However, the market faces certain restraints, including the high initial cost of advanced anticorrosion tapes and the fluctuating prices of raw materials, which can impact profitability and adoption rates. Despite these challenges, the continuous need for infrastructure maintenance and the growing emphasis on asset protection are expected to drive sustained market growth in the forecast period.
Anticorrosion Tape Company Market Share
This comprehensive report offers an in-depth analysis of the global Anticorrosion Tape market, spanning the historical period of 2019–2024, the base year of 2025, and extending through the forecast period of 2025–2033. It delves into market structure, dynamics, regional dominance, product innovations, and future outlook, providing actionable insights for industry professionals and stakeholders. The report meticulously segments the market by Application (Oil and Gas Industry, Chemical Industry, Water Supply Industry, Others) and by Type (Petrolatum-Based, Polymer Based, Others), offering granular market data and projections.
Anticorrosion Tape Market Structure & Innovation Trends
The Anticorrosion Tape market exhibits a moderate to high level of concentration, with several key players holding significant market share. Innovation is a crucial driver, fueled by advancements in polymer science, adhesive technologies, and material durability, leading to the development of tapes with enhanced performance characteristics, such as superior adhesion, broader temperature resistance, and increased chemical inertness. Regulatory frameworks, primarily focused on environmental safety and material compliance in critical infrastructure projects, play a vital role in shaping product development and market entry. While direct product substitutes are limited, alternative corrosion protection methods such as coatings and cathodic protection can be considered competitive. End-user demographics are primarily concentrated within industrial sectors requiring long-term asset protection. Mergers and acquisitions (M&A) activities, with estimated deal values in the millions, are observed as companies seek to expand their product portfolios, geographical reach, and technological capabilities to gain competitive advantages and consolidate market positions.
Anticorrosion Tape Market Dynamics & Trends
The global Anticorrosion Tape market is poised for robust growth, driven by escalating investments in aging infrastructure across the Oil and Gas Industry, Chemical Industry, and Water Supply Industry. The increasing demand for durable and reliable corrosion protection solutions to extend the lifespan of critical assets, coupled with stringent regulatory requirements for asset integrity and safety, are key market accelerators. Technological disruptions are centered on the development of advanced polymer-based tapes offering superior performance in harsh environments and specialized applications. Consumer preferences are shifting towards eco-friendly and sustainable tape solutions, prompting manufacturers to invest in research and development for bio-based or recyclable materials. The competitive landscape is characterized by a mix of established global players and regional manufacturers, engaging in fierce competition through product innovation, strategic partnerships, and competitive pricing. Market penetration is steadily increasing as awareness of the benefits of anticorrosion tapes grows across various industrial sectors. The estimated Compound Annual Growth Rate (CAGR) for the market is projected to be around 7.5%, signifying a healthy expansion trajectory throughout the forecast period. The total market size is expected to reach approximately 5,000 million by the end of the forecast period, driven by these dynamic factors.
Dominant Regions & Segments in Anticorrosion Tape
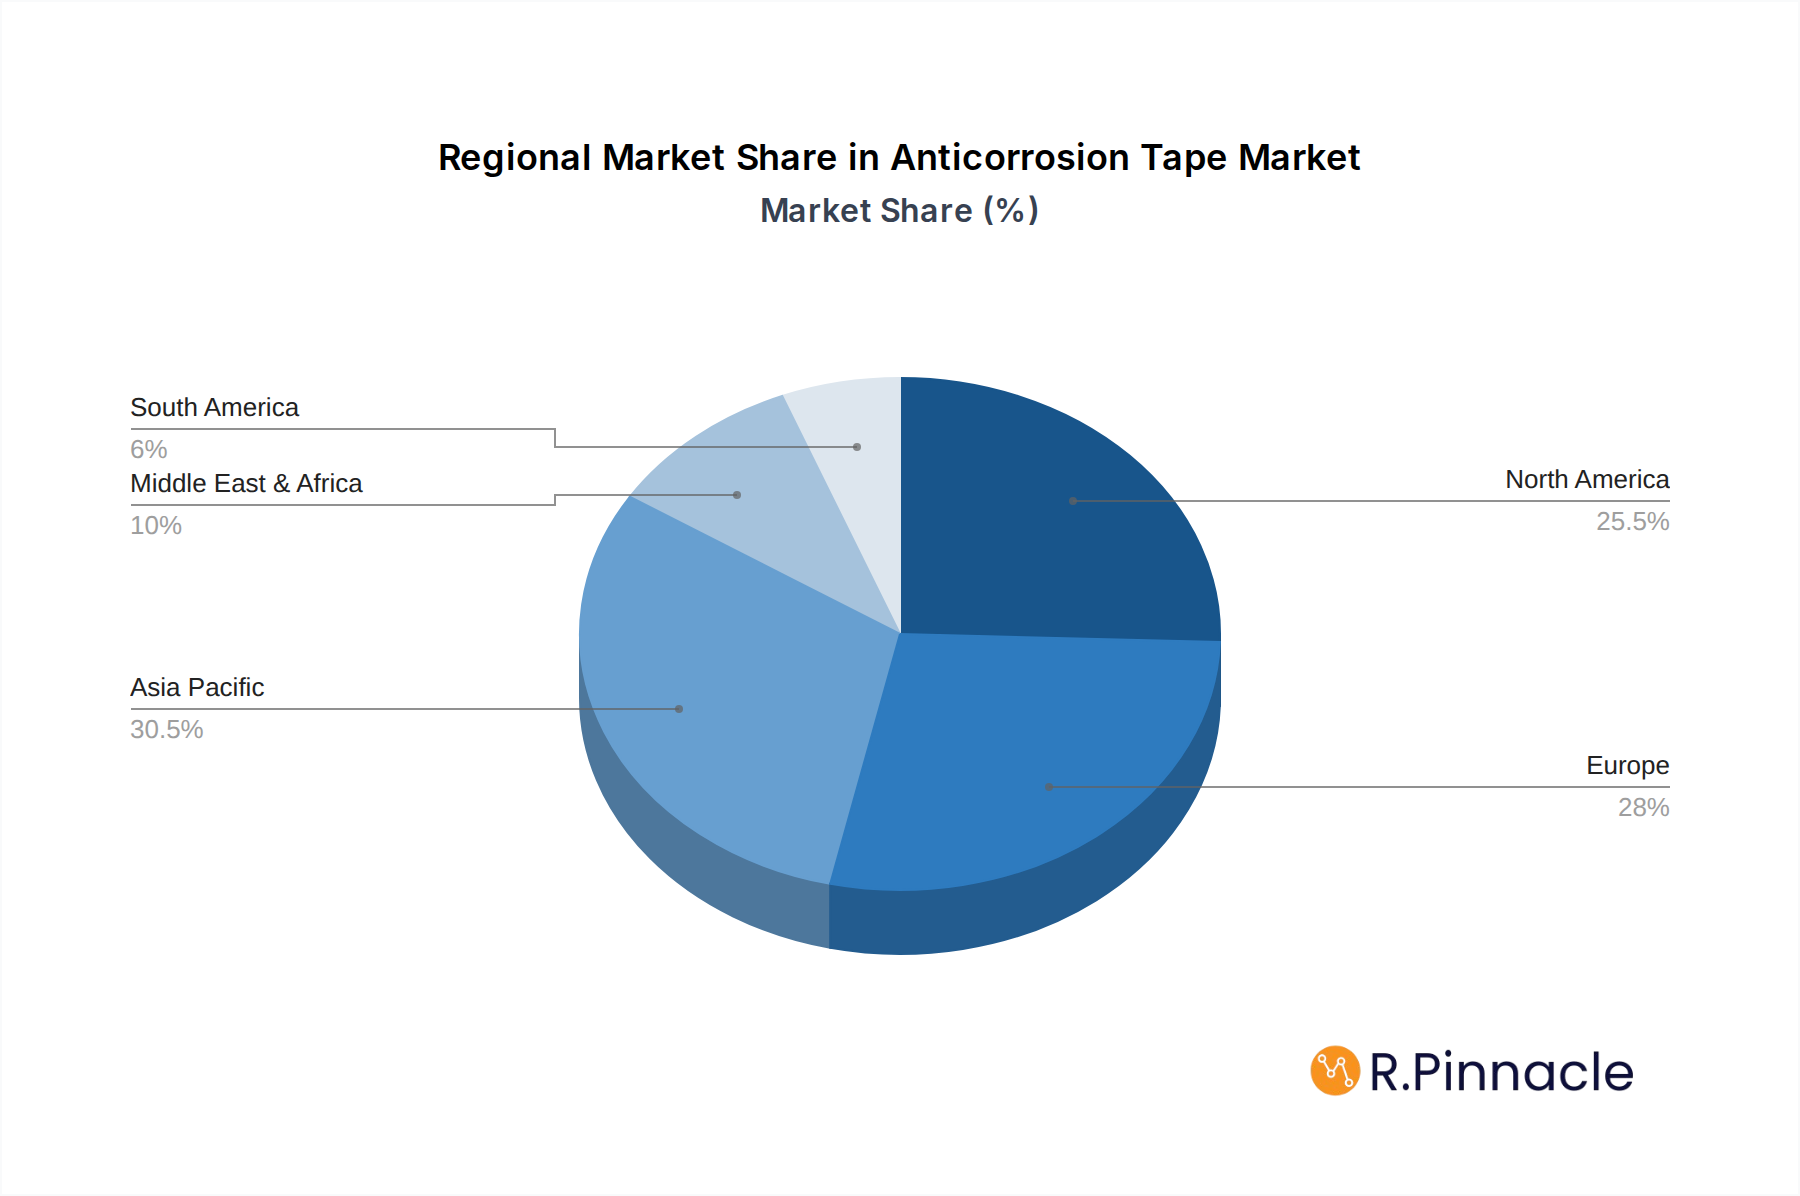
North America currently dominates the Anticorrosion Tape market, driven by extensive investments in the Oil and Gas Industry, coupled with a mature Chemical Industry and robust infrastructure development in the Water Supply Industry. Stringent environmental regulations and a high emphasis on asset longevity in these sectors further bolster demand for high-performance anticorrosion tapes. The United States, with its vast energy reserves and extensive pipeline network, represents a significant market within the region. Key drivers for this dominance include substantial government spending on infrastructure upgrades, a strong industrial base, and the presence of major end-users in critical sectors.
Application: The Oil and Gas Industry remains the largest application segment, accounting for approximately 55% of the market share. This is due to the critical need for corrosion protection in pipelines, storage tanks, and offshore structures exposed to harsh environments. The Chemical Industry follows with a market share of roughly 25%, driven by the need to protect equipment from corrosive chemicals. The Water Supply Industry accounts for approximately 15%, with increasing focus on maintaining the integrity of water pipelines to prevent contamination and leakage. "Others" constitute the remaining 5%, encompassing sectors like marine, industrial construction, and power generation.
Type: Petrolatum-Based tapes hold a significant market share of around 40%, known for their excellent water resistance and ease of application, particularly in buried pipelines. Polymer Based tapes are rapidly gaining traction, holding approximately 50% of the market share. These advanced tapes offer superior mechanical strength, chemical resistance, and UV stability, making them suitable for demanding applications and newer infrastructure projects. "Others," including specialized formulations, represent the remaining 10%.
Economic policies supporting infrastructure development and energy exploration in regions like North America and the Middle East are pivotal. Furthermore, technological adoption rates and the availability of skilled labor for application also contribute to regional market leadership.
Anticorrosion Tape Product Innovations
Anticorrosion tape product innovations are heavily focused on enhancing performance and sustainability. Recent developments include the introduction of self-healing tapes that can repair minor damages, extending their service life. Advanced polymer-based formulations offer improved resistance to extreme temperatures, UV radiation, and aggressive chemicals, making them ideal for challenging environments like offshore oil rigs and chemical processing plants. The development of tapes with integrated corrosion inhibitors and superior adhesion properties further strengthens their competitive advantage in applications where long-term asset protection is paramount.
Report Scope & Segmentation Analysis
This report provides a granular analysis of the Anticorrosion Tape market, segmented by Application and Type.
Application: Oil and Gas Industry: This segment, projected to grow at a CAGR of 7.8%, encompasses pipelines, storage tanks, and offshore structures. Market size is estimated at 2,200 million in 2025, driven by ongoing exploration and infrastructure maintenance.
Application: Chemical Industry: With a projected CAGR of 7.0%, this segment includes reactors, storage vessels, and piping systems exposed to corrosive chemicals. Market size is estimated at 1,125 million in 2025.
Application: Water Supply Industry: This segment, expected to grow at a CAGR of 6.5%, focuses on water mains, treatment plants, and reservoirs. Market size is estimated at 675 million in 2025, with increasing emphasis on infrastructure renewal.
Application: Others: This segment, with a projected CAGR of 6.0%, covers diverse applications in marine, construction, and power generation, estimated at 225 million in 2025.
Type: Petrolatum-Based: This segment, with a projected CAGR of 5.5%, is characterized by its cost-effectiveness and proven performance, estimated at 1,800 million in 2025.
Type: Polymer Based: This segment, projected to grow at a CAGR of 8.5%, represents the fastest-growing category due to its superior performance and durability, estimated at 2,500 million in 2025.
Type: Others: This segment, with a projected CAGR of 6.0%, includes specialized tapes and formulations, estimated at 450 million in 2025.
Key Drivers of Anticorrosion Tape Growth
The growth of the Anticorrosion Tape market is primarily propelled by several key factors. Firstly, increasing global investments in infrastructure development, particularly in the Oil and Gas, Chemical, and Water Supply industries, necessitate robust corrosion protection solutions. Secondly, stringent regulations and standards mandating asset integrity and safety in these critical sectors are driving the adoption of high-performance anticorrosion tapes. Thirdly, technological advancements in material science are leading to the development of more durable, efficient, and environmentally friendly tape products, catering to evolving industry needs. The rising awareness of the long-term cost savings associated with preventing corrosion-induced damage further fuels market expansion.
Challenges in the Anticorrosion Tape Sector
Despite its growth trajectory, the Anticorrosion Tape sector faces several challenges. Intense price competition among manufacturers, especially for standard petrolatum-based tapes, can squeeze profit margins. Fluctuations in raw material prices, such as petroleum-based chemicals and polymers, can impact production costs and pricing strategies. The emergence of alternative corrosion protection technologies, while not always a direct substitute, presents a competitive pressure. Furthermore, the need for specialized application training and equipment for certain advanced tape systems can limit their widespread adoption in less developed markets. Regulatory hurdles related to environmental impact and material certification in some regions can also slow down market entry and product rollout.
Emerging Opportunities in Anticorrosion Tape
Emerging opportunities in the Anticorrosion Tape market lie in the development of sustainable and eco-friendly tape solutions, catering to growing environmental consciousness among consumers and industries. The expansion of renewable energy infrastructure, such as solar farms and wind turbines, presents new application areas for anticorrosion tapes. Furthermore, the increasing demand for protective tapes in specialized sectors like marine, aerospace, and medical equipment manufacturing opens up niche market segments. The integration of smart functionalities, such as embedded sensors for real-time monitoring of coating integrity, represents a significant technological frontier and a lucrative opportunity for innovation.
Leading Players in the Anticorrosion Tape Market
- Polyken
- Nitto
- Sam Hwan Anti-Corrosion Industrial
- Innovative Manufacturing
- 3M
- Scapa
- Denso
- PSI Products
- DEHN SOHNE
- Jining Xunda Pipe Coating Materials
- Ningbo Ideal Anti-corrosion Material
- Shandong Quanmin Plastic
- Dasheng Heat Shrinkable Material
- Zhongyide
- Hs-well
Key Developments in Anticorrosion Tape Industry
- 2023/04: 3M launched a new line of advanced polymer-based anticorrosion tapes with enhanced UV resistance and self-adhering properties.
- 2022/11: Polyken introduced a sustainable petrolatum-based tape formulation with a reduced environmental footprint.
- 2022/07: Nitto announced the acquisition of a smaller competitor, expanding its product portfolio in specialty tapes.
- 2021/09: Scapa unveiled a new high-temperature resistant anticorrosion tape designed for demanding industrial applications.
- 2021/03: Denso expanded its manufacturing capacity to meet the growing demand from the Oil and Gas Industry.
Future Outlook for Anticorrosion Tape Market
The future outlook for the Anticorrosion Tape market is exceptionally positive, driven by sustained demand from critical infrastructure sectors and an ongoing emphasis on asset protection and longevity. Growth accelerators include the increasing adoption of advanced polymer-based tapes offering superior performance and the development of more environmentally sustainable solutions. The market will likely witness further consolidation through strategic M&A activities as companies aim to enhance their competitive positioning and technological capabilities. Emerging applications in renewable energy and specialized industrial sectors present significant untapped potential, promising continued expansion and innovation in the years to come.
Anticorrosion Tape Segmentation
-
1. Application
- 1.1. Oil and Gas Industry
- 1.2. Chemical Industry
- 1.3. Water Supply Industry
- 1.4. Others
-
2. Types
- 2.1. Petrolatum-Based
- 2.2. Polymer Based
- 2.3. Others
Anticorrosion Tape Segmentation By Geography
-
1. North America
- 1.1. United States
- 1.2. Canada
- 1.3. Mexico
-
2. South America
- 2.1. Brazil
- 2.2. Argentina
- 2.3. Rest of South America
-
3. Europe
- 3.1. United Kingdom
- 3.2. Germany
- 3.3. France
- 3.4. Italy
- 3.5. Spain
- 3.6. Russia
- 3.7. Benelux
- 3.8. Nordics
- 3.9. Rest of Europe
-
4. Middle East & Africa
- 4.1. Turkey
- 4.2. Israel
- 4.3. GCC
- 4.4. North Africa
- 4.5. South Africa
- 4.6. Rest of Middle East & Africa
-
5. Asia Pacific
- 5.1. China
- 5.2. India
- 5.3. Japan
- 5.4. South Korea
- 5.5. ASEAN
- 5.6. Oceania
- 5.7. Rest of Asia Pacific
Anticorrosion Tape Regional Market Share
Geographic Coverage of Anticorrosion Tape
Anticorrosion Tape REPORT HIGHLIGHTS
| Aspects | Details |
|---|---|
| Study Period | 2020-2034 |
| Base Year | 2025 |
| Estimated Year | 2026 |
| Forecast Period | 2026-2034 |
| Historical Period | 2020-2025 |
| Growth Rate | CAGR of 4.2% from 2020-2034 |
| Segmentation |
|
Table of Contents
- 1. Introduction
- 1.1. Research Scope
- 1.2. Market Segmentation
- 1.3. Research Methodology
- 1.4. Definitions and Assumptions
- 2. Executive Summary
- 2.1. Introduction
- 3. Market Dynamics
- 3.1. Introduction
- 3.2. Market Drivers
- 3.3. Market Restrains
- 3.4. Market Trends
- 4. Market Factor Analysis
- 4.1. Porters Five Forces
- 4.2. Supply/Value Chain
- 4.3. PESTEL analysis
- 4.4. Market Entropy
- 4.5. Patent/Trademark Analysis
- 5. Global Anticorrosion Tape Analysis, Insights and Forecast, 2020-2032
- 5.1. Market Analysis, Insights and Forecast - by Application
- 5.1.1. Oil and Gas Industry
- 5.1.2. Chemical Industry
- 5.1.3. Water Supply Industry
- 5.1.4. Others
- 5.2. Market Analysis, Insights and Forecast - by Types
- 5.2.1. Petrolatum-Based
- 5.2.2. Polymer Based
- 5.2.3. Others
- 5.3. Market Analysis, Insights and Forecast - by Region
- 5.3.1. North America
- 5.3.2. South America
- 5.3.3. Europe
- 5.3.4. Middle East & Africa
- 5.3.5. Asia Pacific
- 5.1. Market Analysis, Insights and Forecast - by Application
- 6. North America Anticorrosion Tape Analysis, Insights and Forecast, 2020-2032
- 6.1. Market Analysis, Insights and Forecast - by Application
- 6.1.1. Oil and Gas Industry
- 6.1.2. Chemical Industry
- 6.1.3. Water Supply Industry
- 6.1.4. Others
- 6.2. Market Analysis, Insights and Forecast - by Types
- 6.2.1. Petrolatum-Based
- 6.2.2. Polymer Based
- 6.2.3. Others
- 6.1. Market Analysis, Insights and Forecast - by Application
- 7. South America Anticorrosion Tape Analysis, Insights and Forecast, 2020-2032
- 7.1. Market Analysis, Insights and Forecast - by Application
- 7.1.1. Oil and Gas Industry
- 7.1.2. Chemical Industry
- 7.1.3. Water Supply Industry
- 7.1.4. Others
- 7.2. Market Analysis, Insights and Forecast - by Types
- 7.2.1. Petrolatum-Based
- 7.2.2. Polymer Based
- 7.2.3. Others
- 7.1. Market Analysis, Insights and Forecast - by Application
- 8. Europe Anticorrosion Tape Analysis, Insights and Forecast, 2020-2032
- 8.1. Market Analysis, Insights and Forecast - by Application
- 8.1.1. Oil and Gas Industry
- 8.1.2. Chemical Industry
- 8.1.3. Water Supply Industry
- 8.1.4. Others
- 8.2. Market Analysis, Insights and Forecast - by Types
- 8.2.1. Petrolatum-Based
- 8.2.2. Polymer Based
- 8.2.3. Others
- 8.1. Market Analysis, Insights and Forecast - by Application
- 9. Middle East & Africa Anticorrosion Tape Analysis, Insights and Forecast, 2020-2032
- 9.1. Market Analysis, Insights and Forecast - by Application
- 9.1.1. Oil and Gas Industry
- 9.1.2. Chemical Industry
- 9.1.3. Water Supply Industry
- 9.1.4. Others
- 9.2. Market Analysis, Insights and Forecast - by Types
- 9.2.1. Petrolatum-Based
- 9.2.2. Polymer Based
- 9.2.3. Others
- 9.1. Market Analysis, Insights and Forecast - by Application
- 10. Asia Pacific Anticorrosion Tape Analysis, Insights and Forecast, 2020-2032
- 10.1. Market Analysis, Insights and Forecast - by Application
- 10.1.1. Oil and Gas Industry
- 10.1.2. Chemical Industry
- 10.1.3. Water Supply Industry
- 10.1.4. Others
- 10.2. Market Analysis, Insights and Forecast - by Types
- 10.2.1. Petrolatum-Based
- 10.2.2. Polymer Based
- 10.2.3. Others
- 10.1. Market Analysis, Insights and Forecast - by Application
- 11. Competitive Analysis
- 11.1. Global Market Share Analysis 2025
- 11.2. Company Profiles
- 11.2.1 Polyken
- 11.2.1.1. Overview
- 11.2.1.2. Products
- 11.2.1.3. SWOT Analysis
- 11.2.1.4. Recent Developments
- 11.2.1.5. Financials (Based on Availability)
- 11.2.2 Nitto
- 11.2.2.1. Overview
- 11.2.2.2. Products
- 11.2.2.3. SWOT Analysis
- 11.2.2.4. Recent Developments
- 11.2.2.5. Financials (Based on Availability)
- 11.2.3 Sam Hwan Anti-Corrosion Industrial
- 11.2.3.1. Overview
- 11.2.3.2. Products
- 11.2.3.3. SWOT Analysis
- 11.2.3.4. Recent Developments
- 11.2.3.5. Financials (Based on Availability)
- 11.2.4 Innovative Manufacturing
- 11.2.4.1. Overview
- 11.2.4.2. Products
- 11.2.4.3. SWOT Analysis
- 11.2.4.4. Recent Developments
- 11.2.4.5. Financials (Based on Availability)
- 11.2.5 3M
- 11.2.5.1. Overview
- 11.2.5.2. Products
- 11.2.5.3. SWOT Analysis
- 11.2.5.4. Recent Developments
- 11.2.5.5. Financials (Based on Availability)
- 11.2.6 Scapa
- 11.2.6.1. Overview
- 11.2.6.2. Products
- 11.2.6.3. SWOT Analysis
- 11.2.6.4. Recent Developments
- 11.2.6.5. Financials (Based on Availability)
- 11.2.7 Denso
- 11.2.7.1. Overview
- 11.2.7.2. Products
- 11.2.7.3. SWOT Analysis
- 11.2.7.4. Recent Developments
- 11.2.7.5. Financials (Based on Availability)
- 11.2.8 PSI Products
- 11.2.8.1. Overview
- 11.2.8.2. Products
- 11.2.8.3. SWOT Analysis
- 11.2.8.4. Recent Developments
- 11.2.8.5. Financials (Based on Availability)
- 11.2.9 DEHN SOHNE
- 11.2.9.1. Overview
- 11.2.9.2. Products
- 11.2.9.3. SWOT Analysis
- 11.2.9.4. Recent Developments
- 11.2.9.5. Financials (Based on Availability)
- 11.2.10 Jining Xunda Pipe Coating Materials
- 11.2.10.1. Overview
- 11.2.10.2. Products
- 11.2.10.3. SWOT Analysis
- 11.2.10.4. Recent Developments
- 11.2.10.5. Financials (Based on Availability)
- 11.2.11 Ningbo Ideal Anti-corrosion Material
- 11.2.11.1. Overview
- 11.2.11.2. Products
- 11.2.11.3. SWOT Analysis
- 11.2.11.4. Recent Developments
- 11.2.11.5. Financials (Based on Availability)
- 11.2.12 Shandong Quanmin Plastic
- 11.2.12.1. Overview
- 11.2.12.2. Products
- 11.2.12.3. SWOT Analysis
- 11.2.12.4. Recent Developments
- 11.2.12.5. Financials (Based on Availability)
- 11.2.13 Dasheng Heat Shrinkable Material
- 11.2.13.1. Overview
- 11.2.13.2. Products
- 11.2.13.3. SWOT Analysis
- 11.2.13.4. Recent Developments
- 11.2.13.5. Financials (Based on Availability)
- 11.2.14 Zhongyide
- 11.2.14.1. Overview
- 11.2.14.2. Products
- 11.2.14.3. SWOT Analysis
- 11.2.14.4. Recent Developments
- 11.2.14.5. Financials (Based on Availability)
- 11.2.15 Hs-well
- 11.2.15.1. Overview
- 11.2.15.2. Products
- 11.2.15.3. SWOT Analysis
- 11.2.15.4. Recent Developments
- 11.2.15.5. Financials (Based on Availability)
- 11.2.1 Polyken
List of Figures
- Figure 1: Global Anticorrosion Tape Revenue Breakdown (undefined, %) by Region 2025 & 2033
- Figure 2: Global Anticorrosion Tape Volume Breakdown (K, %) by Region 2025 & 2033
- Figure 3: North America Anticorrosion Tape Revenue (undefined), by Application 2025 & 2033
- Figure 4: North America Anticorrosion Tape Volume (K), by Application 2025 & 2033
- Figure 5: North America Anticorrosion Tape Revenue Share (%), by Application 2025 & 2033
- Figure 6: North America Anticorrosion Tape Volume Share (%), by Application 2025 & 2033
- Figure 7: North America Anticorrosion Tape Revenue (undefined), by Types 2025 & 2033
- Figure 8: North America Anticorrosion Tape Volume (K), by Types 2025 & 2033
- Figure 9: North America Anticorrosion Tape Revenue Share (%), by Types 2025 & 2033
- Figure 10: North America Anticorrosion Tape Volume Share (%), by Types 2025 & 2033
- Figure 11: North America Anticorrosion Tape Revenue (undefined), by Country 2025 & 2033
- Figure 12: North America Anticorrosion Tape Volume (K), by Country 2025 & 2033
- Figure 13: North America Anticorrosion Tape Revenue Share (%), by Country 2025 & 2033
- Figure 14: North America Anticorrosion Tape Volume Share (%), by Country 2025 & 2033
- Figure 15: South America Anticorrosion Tape Revenue (undefined), by Application 2025 & 2033
- Figure 16: South America Anticorrosion Tape Volume (K), by Application 2025 & 2033
- Figure 17: South America Anticorrosion Tape Revenue Share (%), by Application 2025 & 2033
- Figure 18: South America Anticorrosion Tape Volume Share (%), by Application 2025 & 2033
- Figure 19: South America Anticorrosion Tape Revenue (undefined), by Types 2025 & 2033
- Figure 20: South America Anticorrosion Tape Volume (K), by Types 2025 & 2033
- Figure 21: South America Anticorrosion Tape Revenue Share (%), by Types 2025 & 2033
- Figure 22: South America Anticorrosion Tape Volume Share (%), by Types 2025 & 2033
- Figure 23: South America Anticorrosion Tape Revenue (undefined), by Country 2025 & 2033
- Figure 24: South America Anticorrosion Tape Volume (K), by Country 2025 & 2033
- Figure 25: South America Anticorrosion Tape Revenue Share (%), by Country 2025 & 2033
- Figure 26: South America Anticorrosion Tape Volume Share (%), by Country 2025 & 2033
- Figure 27: Europe Anticorrosion Tape Revenue (undefined), by Application 2025 & 2033
- Figure 28: Europe Anticorrosion Tape Volume (K), by Application 2025 & 2033
- Figure 29: Europe Anticorrosion Tape Revenue Share (%), by Application 2025 & 2033
- Figure 30: Europe Anticorrosion Tape Volume Share (%), by Application 2025 & 2033
- Figure 31: Europe Anticorrosion Tape Revenue (undefined), by Types 2025 & 2033
- Figure 32: Europe Anticorrosion Tape Volume (K), by Types 2025 & 2033
- Figure 33: Europe Anticorrosion Tape Revenue Share (%), by Types 2025 & 2033
- Figure 34: Europe Anticorrosion Tape Volume Share (%), by Types 2025 & 2033
- Figure 35: Europe Anticorrosion Tape Revenue (undefined), by Country 2025 & 2033
- Figure 36: Europe Anticorrosion Tape Volume (K), by Country 2025 & 2033
- Figure 37: Europe Anticorrosion Tape Revenue Share (%), by Country 2025 & 2033
- Figure 38: Europe Anticorrosion Tape Volume Share (%), by Country 2025 & 2033
- Figure 39: Middle East & Africa Anticorrosion Tape Revenue (undefined), by Application 2025 & 2033
- Figure 40: Middle East & Africa Anticorrosion Tape Volume (K), by Application 2025 & 2033
- Figure 41: Middle East & Africa Anticorrosion Tape Revenue Share (%), by Application 2025 & 2033
- Figure 42: Middle East & Africa Anticorrosion Tape Volume Share (%), by Application 2025 & 2033
- Figure 43: Middle East & Africa Anticorrosion Tape Revenue (undefined), by Types 2025 & 2033
- Figure 44: Middle East & Africa Anticorrosion Tape Volume (K), by Types 2025 & 2033
- Figure 45: Middle East & Africa Anticorrosion Tape Revenue Share (%), by Types 2025 & 2033
- Figure 46: Middle East & Africa Anticorrosion Tape Volume Share (%), by Types 2025 & 2033
- Figure 47: Middle East & Africa Anticorrosion Tape Revenue (undefined), by Country 2025 & 2033
- Figure 48: Middle East & Africa Anticorrosion Tape Volume (K), by Country 2025 & 2033
- Figure 49: Middle East & Africa Anticorrosion Tape Revenue Share (%), by Country 2025 & 2033
- Figure 50: Middle East & Africa Anticorrosion Tape Volume Share (%), by Country 2025 & 2033
- Figure 51: Asia Pacific Anticorrosion Tape Revenue (undefined), by Application 2025 & 2033
- Figure 52: Asia Pacific Anticorrosion Tape Volume (K), by Application 2025 & 2033
- Figure 53: Asia Pacific Anticorrosion Tape Revenue Share (%), by Application 2025 & 2033
- Figure 54: Asia Pacific Anticorrosion Tape Volume Share (%), by Application 2025 & 2033
- Figure 55: Asia Pacific Anticorrosion Tape Revenue (undefined), by Types 2025 & 2033
- Figure 56: Asia Pacific Anticorrosion Tape Volume (K), by Types 2025 & 2033
- Figure 57: Asia Pacific Anticorrosion Tape Revenue Share (%), by Types 2025 & 2033
- Figure 58: Asia Pacific Anticorrosion Tape Volume Share (%), by Types 2025 & 2033
- Figure 59: Asia Pacific Anticorrosion Tape Revenue (undefined), by Country 2025 & 2033
- Figure 60: Asia Pacific Anticorrosion Tape Volume (K), by Country 2025 & 2033
- Figure 61: Asia Pacific Anticorrosion Tape Revenue Share (%), by Country 2025 & 2033
- Figure 62: Asia Pacific Anticorrosion Tape Volume Share (%), by Country 2025 & 2033
List of Tables
- Table 1: Global Anticorrosion Tape Revenue undefined Forecast, by Application 2020 & 2033
- Table 2: Global Anticorrosion Tape Volume K Forecast, by Application 2020 & 2033
- Table 3: Global Anticorrosion Tape Revenue undefined Forecast, by Types 2020 & 2033
- Table 4: Global Anticorrosion Tape Volume K Forecast, by Types 2020 & 2033
- Table 5: Global Anticorrosion Tape Revenue undefined Forecast, by Region 2020 & 2033
- Table 6: Global Anticorrosion Tape Volume K Forecast, by Region 2020 & 2033
- Table 7: Global Anticorrosion Tape Revenue undefined Forecast, by Application 2020 & 2033
- Table 8: Global Anticorrosion Tape Volume K Forecast, by Application 2020 & 2033
- Table 9: Global Anticorrosion Tape Revenue undefined Forecast, by Types 2020 & 2033
- Table 10: Global Anticorrosion Tape Volume K Forecast, by Types 2020 & 2033
- Table 11: Global Anticorrosion Tape Revenue undefined Forecast, by Country 2020 & 2033
- Table 12: Global Anticorrosion Tape Volume K Forecast, by Country 2020 & 2033
- Table 13: United States Anticorrosion Tape Revenue (undefined) Forecast, by Application 2020 & 2033
- Table 14: United States Anticorrosion Tape Volume (K) Forecast, by Application 2020 & 2033
- Table 15: Canada Anticorrosion Tape Revenue (undefined) Forecast, by Application 2020 & 2033
- Table 16: Canada Anticorrosion Tape Volume (K) Forecast, by Application 2020 & 2033
- Table 17: Mexico Anticorrosion Tape Revenue (undefined) Forecast, by Application 2020 & 2033
- Table 18: Mexico Anticorrosion Tape Volume (K) Forecast, by Application 2020 & 2033
- Table 19: Global Anticorrosion Tape Revenue undefined Forecast, by Application 2020 & 2033
- Table 20: Global Anticorrosion Tape Volume K Forecast, by Application 2020 & 2033
- Table 21: Global Anticorrosion Tape Revenue undefined Forecast, by Types 2020 & 2033
- Table 22: Global Anticorrosion Tape Volume K Forecast, by Types 2020 & 2033
- Table 23: Global Anticorrosion Tape Revenue undefined Forecast, by Country 2020 & 2033
- Table 24: Global Anticorrosion Tape Volume K Forecast, by Country 2020 & 2033
- Table 25: Brazil Anticorrosion Tape Revenue (undefined) Forecast, by Application 2020 & 2033
- Table 26: Brazil Anticorrosion Tape Volume (K) Forecast, by Application 2020 & 2033
- Table 27: Argentina Anticorrosion Tape Revenue (undefined) Forecast, by Application 2020 & 2033
- Table 28: Argentina Anticorrosion Tape Volume (K) Forecast, by Application 2020 & 2033
- Table 29: Rest of South America Anticorrosion Tape Revenue (undefined) Forecast, by Application 2020 & 2033
- Table 30: Rest of South America Anticorrosion Tape Volume (K) Forecast, by Application 2020 & 2033
- Table 31: Global Anticorrosion Tape Revenue undefined Forecast, by Application 2020 & 2033
- Table 32: Global Anticorrosion Tape Volume K Forecast, by Application 2020 & 2033
- Table 33: Global Anticorrosion Tape Revenue undefined Forecast, by Types 2020 & 2033
- Table 34: Global Anticorrosion Tape Volume K Forecast, by Types 2020 & 2033
- Table 35: Global Anticorrosion Tape Revenue undefined Forecast, by Country 2020 & 2033
- Table 36: Global Anticorrosion Tape Volume K Forecast, by Country 2020 & 2033
- Table 37: United Kingdom Anticorrosion Tape Revenue (undefined) Forecast, by Application 2020 & 2033
- Table 38: United Kingdom Anticorrosion Tape Volume (K) Forecast, by Application 2020 & 2033
- Table 39: Germany Anticorrosion Tape Revenue (undefined) Forecast, by Application 2020 & 2033
- Table 40: Germany Anticorrosion Tape Volume (K) Forecast, by Application 2020 & 2033
- Table 41: France Anticorrosion Tape Revenue (undefined) Forecast, by Application 2020 & 2033
- Table 42: France Anticorrosion Tape Volume (K) Forecast, by Application 2020 & 2033
- Table 43: Italy Anticorrosion Tape Revenue (undefined) Forecast, by Application 2020 & 2033
- Table 44: Italy Anticorrosion Tape Volume (K) Forecast, by Application 2020 & 2033
- Table 45: Spain Anticorrosion Tape Revenue (undefined) Forecast, by Application 2020 & 2033
- Table 46: Spain Anticorrosion Tape Volume (K) Forecast, by Application 2020 & 2033
- Table 47: Russia Anticorrosion Tape Revenue (undefined) Forecast, by Application 2020 & 2033
- Table 48: Russia Anticorrosion Tape Volume (K) Forecast, by Application 2020 & 2033
- Table 49: Benelux Anticorrosion Tape Revenue (undefined) Forecast, by Application 2020 & 2033
- Table 50: Benelux Anticorrosion Tape Volume (K) Forecast, by Application 2020 & 2033
- Table 51: Nordics Anticorrosion Tape Revenue (undefined) Forecast, by Application 2020 & 2033
- Table 52: Nordics Anticorrosion Tape Volume (K) Forecast, by Application 2020 & 2033
- Table 53: Rest of Europe Anticorrosion Tape Revenue (undefined) Forecast, by Application 2020 & 2033
- Table 54: Rest of Europe Anticorrosion Tape Volume (K) Forecast, by Application 2020 & 2033
- Table 55: Global Anticorrosion Tape Revenue undefined Forecast, by Application 2020 & 2033
- Table 56: Global Anticorrosion Tape Volume K Forecast, by Application 2020 & 2033
- Table 57: Global Anticorrosion Tape Revenue undefined Forecast, by Types 2020 & 2033
- Table 58: Global Anticorrosion Tape Volume K Forecast, by Types 2020 & 2033
- Table 59: Global Anticorrosion Tape Revenue undefined Forecast, by Country 2020 & 2033
- Table 60: Global Anticorrosion Tape Volume K Forecast, by Country 2020 & 2033
- Table 61: Turkey Anticorrosion Tape Revenue (undefined) Forecast, by Application 2020 & 2033
- Table 62: Turkey Anticorrosion Tape Volume (K) Forecast, by Application 2020 & 2033
- Table 63: Israel Anticorrosion Tape Revenue (undefined) Forecast, by Application 2020 & 2033
- Table 64: Israel Anticorrosion Tape Volume (K) Forecast, by Application 2020 & 2033
- Table 65: GCC Anticorrosion Tape Revenue (undefined) Forecast, by Application 2020 & 2033
- Table 66: GCC Anticorrosion Tape Volume (K) Forecast, by Application 2020 & 2033
- Table 67: North Africa Anticorrosion Tape Revenue (undefined) Forecast, by Application 2020 & 2033
- Table 68: North Africa Anticorrosion Tape Volume (K) Forecast, by Application 2020 & 2033
- Table 69: South Africa Anticorrosion Tape Revenue (undefined) Forecast, by Application 2020 & 2033
- Table 70: South Africa Anticorrosion Tape Volume (K) Forecast, by Application 2020 & 2033
- Table 71: Rest of Middle East & Africa Anticorrosion Tape Revenue (undefined) Forecast, by Application 2020 & 2033
- Table 72: Rest of Middle East & Africa Anticorrosion Tape Volume (K) Forecast, by Application 2020 & 2033
- Table 73: Global Anticorrosion Tape Revenue undefined Forecast, by Application 2020 & 2033
- Table 74: Global Anticorrosion Tape Volume K Forecast, by Application 2020 & 2033
- Table 75: Global Anticorrosion Tape Revenue undefined Forecast, by Types 2020 & 2033
- Table 76: Global Anticorrosion Tape Volume K Forecast, by Types 2020 & 2033
- Table 77: Global Anticorrosion Tape Revenue undefined Forecast, by Country 2020 & 2033
- Table 78: Global Anticorrosion Tape Volume K Forecast, by Country 2020 & 2033
- Table 79: China Anticorrosion Tape Revenue (undefined) Forecast, by Application 2020 & 2033
- Table 80: China Anticorrosion Tape Volume (K) Forecast, by Application 2020 & 2033
- Table 81: India Anticorrosion Tape Revenue (undefined) Forecast, by Application 2020 & 2033
- Table 82: India Anticorrosion Tape Volume (K) Forecast, by Application 2020 & 2033
- Table 83: Japan Anticorrosion Tape Revenue (undefined) Forecast, by Application 2020 & 2033
- Table 84: Japan Anticorrosion Tape Volume (K) Forecast, by Application 2020 & 2033
- Table 85: South Korea Anticorrosion Tape Revenue (undefined) Forecast, by Application 2020 & 2033
- Table 86: South Korea Anticorrosion Tape Volume (K) Forecast, by Application 2020 & 2033
- Table 87: ASEAN Anticorrosion Tape Revenue (undefined) Forecast, by Application 2020 & 2033
- Table 88: ASEAN Anticorrosion Tape Volume (K) Forecast, by Application 2020 & 2033
- Table 89: Oceania Anticorrosion Tape Revenue (undefined) Forecast, by Application 2020 & 2033
- Table 90: Oceania Anticorrosion Tape Volume (K) Forecast, by Application 2020 & 2033
- Table 91: Rest of Asia Pacific Anticorrosion Tape Revenue (undefined) Forecast, by Application 2020 & 2033
- Table 92: Rest of Asia Pacific Anticorrosion Tape Volume (K) Forecast, by Application 2020 & 2033
Frequently Asked Questions
1. What is the projected Compound Annual Growth Rate (CAGR) of the Anticorrosion Tape?
The projected CAGR is approximately 4.2%.
2. Which companies are prominent players in the Anticorrosion Tape?
Key companies in the market include Polyken, Nitto, Sam Hwan Anti-Corrosion Industrial, Innovative Manufacturing, 3M, Scapa, Denso, PSI Products, DEHN SOHNE, Jining Xunda Pipe Coating Materials, Ningbo Ideal Anti-corrosion Material, Shandong Quanmin Plastic, Dasheng Heat Shrinkable Material, Zhongyide, Hs-well.
3. What are the main segments of the Anticorrosion Tape?
The market segments include Application, Types.
4. Can you provide details about the market size?
The market size is estimated to be USD XXX N/A as of 2022.
5. What are some drivers contributing to market growth?
N/A
6. What are the notable trends driving market growth?
N/A
7. Are there any restraints impacting market growth?
N/A
8. Can you provide examples of recent developments in the market?
N/A
9. What pricing options are available for accessing the report?
Pricing options include single-user, multi-user, and enterprise licenses priced at USD 3950.00, USD 5925.00, and USD 7900.00 respectively.
10. Is the market size provided in terms of value or volume?
The market size is provided in terms of value, measured in N/A and volume, measured in K.
11. Are there any specific market keywords associated with the report?
Yes, the market keyword associated with the report is "Anticorrosion Tape," which aids in identifying and referencing the specific market segment covered.
12. How do I determine which pricing option suits my needs best?
The pricing options vary based on user requirements and access needs. Individual users may opt for single-user licenses, while businesses requiring broader access may choose multi-user or enterprise licenses for cost-effective access to the report.
13. Are there any additional resources or data provided in the Anticorrosion Tape report?
While the report offers comprehensive insights, it's advisable to review the specific contents or supplementary materials provided to ascertain if additional resources or data are available.
14. How can I stay updated on further developments or reports in the Anticorrosion Tape?
To stay informed about further developments, trends, and reports in the Anticorrosion Tape, consider subscribing to industry newsletters, following relevant companies and organizations, or regularly checking reputable industry news sources and publications.
Methodology
Step 1 - Identification of Relevant Samples Size from Population Database


Step 2 - Approaches for Defining Global Market Size (Value, Volume* & Price*)

Note*: In applicable scenarios
Step 3 - Data Sources
Primary Research
- Web Analytics
- Survey Reports
- Research Institute
- Latest Research Reports
- Opinion Leaders
Secondary Research
- Annual Reports
- White Paper
- Latest Press Release
- Industry Association
- Paid Database
- Investor Presentations

Step 4 - Data Triangulation
Involves using different sources of information in order to increase the validity of a study
These sources are likely to be stakeholders in a program - participants, other researchers, program staff, other community members, and so on.
Then we put all data in single framework & apply various statistical tools to find out the dynamic on the market.
During the analysis stage, feedback from the stakeholder groups would be compared to determine areas of agreement as well as areas of divergence