
Key Insights
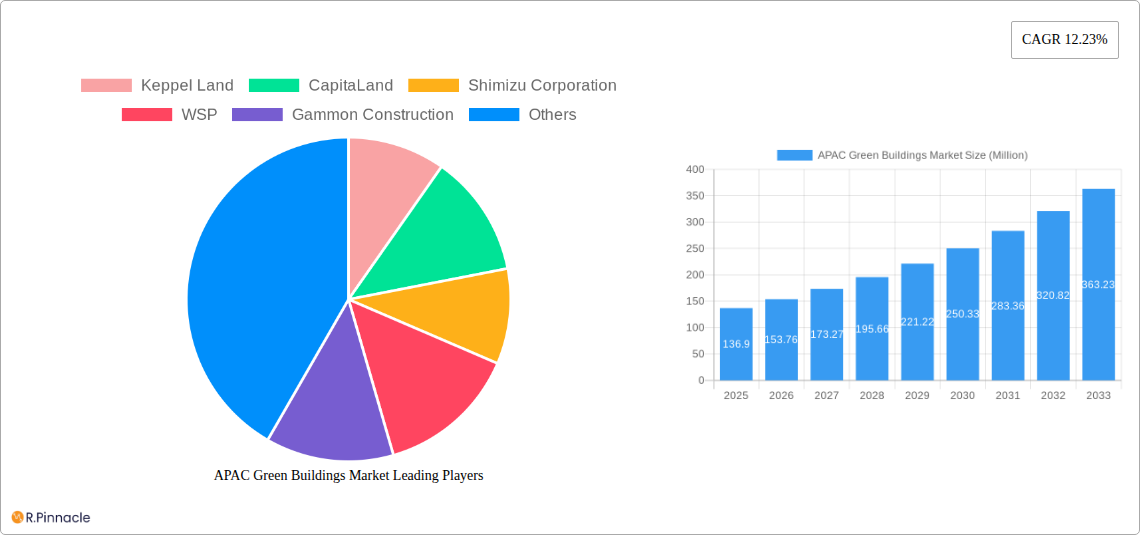
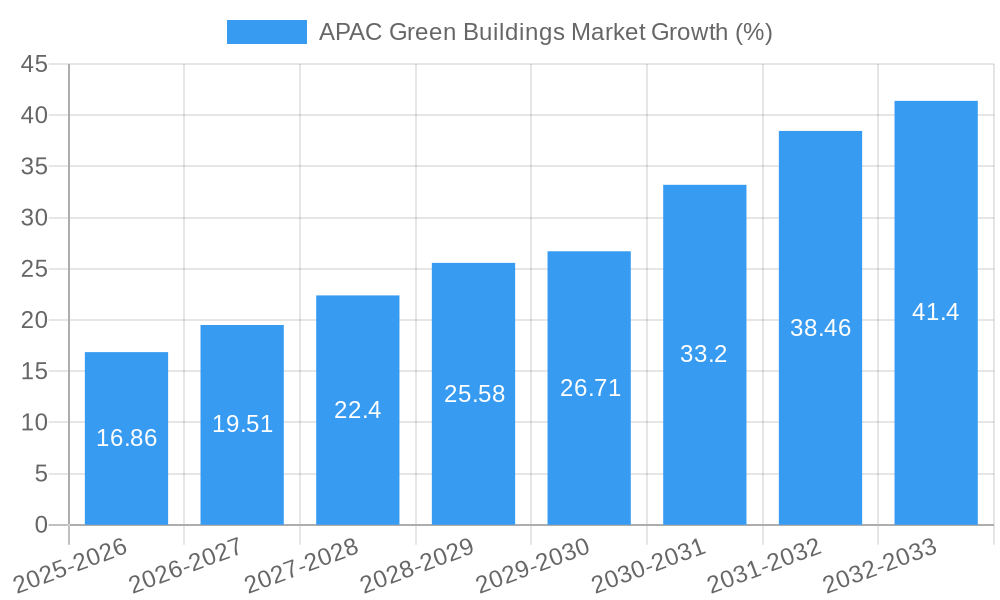
The APAC green building market is experiencing robust growth, projected to reach a market size of $136.90 million in 2025 and maintain a Compound Annual Growth Rate (CAGR) of 12.23% from 2025 to 2033. Several key drivers fuel this expansion. Increasing government regulations promoting sustainable construction practices across countries like China, Japan, India, and Australia are significantly impacting the market. Furthermore, growing awareness among consumers and businesses regarding environmental sustainability and the associated long-term cost savings of green buildings are boosting demand. Technological advancements in green building materials and construction techniques, such as improved insulation, energy-efficient HVAC systems, and renewable energy integration, are also contributing to market expansion. The market is segmented by product type (exterior, interior, and other products including building and solar systems) and end-user (residential, office, retail, institutional, and other). The residential segment currently holds a significant market share, driven by increasing disposable incomes and a preference for eco-friendly housing. However, the office and institutional segments are anticipated to witness substantial growth in the coming years, fueled by corporate sustainability initiatives and government investments in green infrastructure. Key players like Keppel Land, CapitaLand, Shimizu Corporation, and others are actively shaping the market landscape through innovative projects and strategic partnerships.
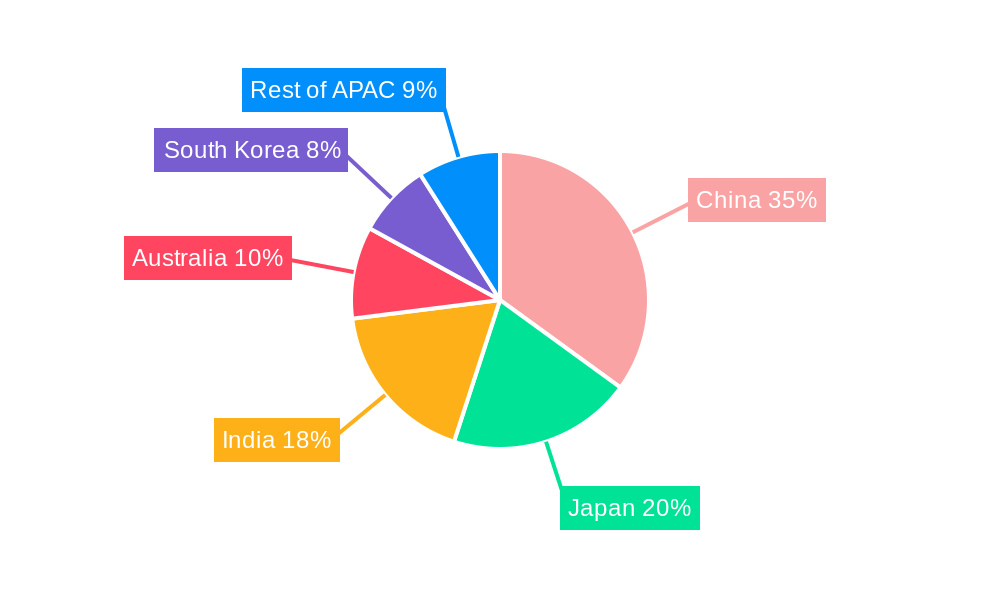
The geographical distribution of the market within APAC shows variations in growth rates across different regions. China and India, with their large populations and rapid urbanization, are expected to be major contributors to market growth. Japan and South Korea, already having established green building standards, will likely continue to show steady growth. Australia's focus on sustainable development will further fuel the market in that region. The Rest of APAC is also poised for expansion, driven by increasing adoption of green building principles. Competitive pressures are intensifying, with companies focusing on differentiation through specialized services, technological innovation, and strategic acquisitions to consolidate market share. The restraints to growth include high initial investment costs associated with green building technologies and a shortage of skilled labor proficient in green building construction methods. However, government incentives, technological advancements, and increased awareness are expected to mitigate these challenges.
APAC Green Buildings Market: A Comprehensive Report (2019-2033)
This in-depth report provides a comprehensive analysis of the Asia-Pacific (APAC) green buildings market, offering invaluable insights for industry professionals, investors, and stakeholders. Covering the period 2019-2033, with a focus on 2025, this report dissects market dynamics, growth drivers, challenges, and emerging opportunities, providing a robust forecast for future market potential. The report leverages extensive data analysis to offer actionable strategies for navigating this rapidly evolving sector. The total market size is projected to reach xx Million by 2033.
APAC Green Buildings Market Structure & Innovation Trends
This section analyzes the competitive landscape of the APAC green buildings market, examining market concentration, innovation drivers, regulatory frameworks, and M&A activity. The market exhibits a moderately concentrated structure, with key players holding significant market share. However, the presence of numerous smaller players indicates a dynamic and competitive environment.
- Market Concentration: The top 10 companies hold an estimated xx% market share in 2025. Further consolidation is anticipated through mergers and acquisitions.
- Innovation Drivers: Stringent environmental regulations, increasing awareness of sustainability, and advancements in green building technologies are major drivers of innovation.
- Regulatory Frameworks: Government policies promoting green building practices, including tax incentives and building codes, play a crucial role in shaping market growth. Variations in regulations across different APAC countries create both opportunities and challenges.
- Product Substitutes: Traditional building materials face increasing competition from sustainable alternatives, driving innovation and adoption of eco-friendly products.
- End-User Demographics: Growing urbanization and rising disposable incomes in APAC are fueling demand for green buildings across residential, commercial, and institutional sectors.
- M&A Activities: Significant M&A activity is observed, with deal values exceeding xx Million in the last five years, indicating a trend towards consolidation and expansion. These deals often involve technology acquisitions and geographic expansion strategies.
APAC Green Buildings Market Market Dynamics & Trends
This section delves into the key factors shaping the APAC green building market's growth trajectory. The market is experiencing robust growth, driven by a confluence of factors.
The market is projected to witness a CAGR of xx% during the forecast period (2025-2033). Market penetration of green building technologies is increasing steadily, driven by consumer preference for sustainable living and corporate sustainability initiatives. Technological advancements, particularly in areas like building automation systems and renewable energy integration, are transforming the industry. Competitive dynamics are characterized by innovation, strategic partnerships, and a push towards vertical integration. Government support and increased investor interest further bolster the market's growth prospects.
Dominant Regions & Segments in APAC Green Buildings Market
This section identifies the leading regions and segments within the APAC green building market. While data varies by segment and year, China and Singapore consistently emerge as leading markets.
- By Product: The Exterior Products segment holds the largest market share, driven by the high demand for energy-efficient windows, insulation materials, and roofing systems. The Interior Products segment is also experiencing strong growth, fueled by increased adoption of sustainable interior finishes and furnishings. The Other Products segment, encompassing building systems and solar systems, is expected to witness substantial growth due to technological innovation and government incentives.
- By End User: The Residential segment dominates the market, reflecting the growing preference for environmentally friendly housing. However, the Office and Institutional segments are exhibiting significant growth driven by corporate sustainability goals and government mandates.
Key Drivers:
- Economic Policies: Government incentives, tax breaks, and subsidies significantly influence the adoption of green building technologies.
- Infrastructure Development: Investments in sustainable infrastructure projects, such as green transportation systems, further promote the growth of green buildings.
- Technological Advancements: Continuous innovation in green building materials, technologies, and design strategies contributes to market expansion.
APAP Green Buildings Market Product Innovations
The APAP green building market showcases continuous product innovation, with a strong emphasis on energy efficiency, resource conservation, and reduced carbon footprint. New building materials, such as bio-based composites and recycled content products, are gaining traction. Smart building technologies, including IoT-enabled systems for energy management and waste reduction, are becoming increasingly prevalent. These innovations offer significant competitive advantages, improving building performance, reducing operating costs, and enhancing occupant well-being.
Report Scope & Segmentation Analysis
This report segments the APAC green buildings market by product type (Exterior Products, Interior Products, Other Products) and end-user (Residential, Office, Retail, Institutional, Other End Users). Growth projections, market sizes, and competitive dynamics are analyzed for each segment. Each segment is expected to exhibit substantial growth over the forecast period, driven by unique market drivers and technological advancements.
Key Drivers of APAC Green Buildings Market Growth
The APAC green building market's growth is propelled by several factors: stringent environmental regulations pushing for sustainable construction, increasing awareness among consumers and businesses regarding environmental responsibility, technological advancements resulting in cost-effective and efficient green building solutions, and supportive government policies and financial incentives driving market expansion. The rising disposable income within the region further fuels the demand for eco-friendly buildings.
Challenges in the APAC Green Buildings Market Sector
Several challenges hinder the APAC green buildings market's growth. High upfront costs associated with green building technologies can be a barrier to adoption, particularly for smaller developers. Supply chain complexities and the availability of sustainable materials can present logistical challenges. Furthermore, a lack of awareness and expertise in green building practices among some stakeholders can slow market development. Finally, intense competition among players seeking to establish market dominance can influence pricing and profitability.
Emerging Opportunities in APAC Green Buildings Market
The APAC green building market presents substantial opportunities. The rising demand for green buildings across various sectors offers significant growth potential. Technological advancements in green building materials, energy efficiency solutions, and smart building technologies provide opportunities for innovation and market leadership. Furthermore, the expanding focus on circular economy principles presents opportunities for resource recovery and waste reduction in the construction industry. Government initiatives supporting green building practices offer further opportunities.
Leading Players in the APAC Green Buildings Market Market
- Keppel Land
- CapitaLand
- Shimizu Corporation
- WSP
- Gammon Construction
- Obayashi Corporation
- Sun Hung Kai Properties
- 7 3 Other Companies
- Lendlease
- Swire Properties
- Sino Group
Key Developments in APAC Green Buildings Market Industry
- April 2023: Starbucks unveils its first greener stores in Singapore, Thailand, and Vietnam, part of a global initiative to reach 10,000 greener stores by 2025. This signals increased corporate commitment to sustainability and drives demand for green building solutions.
- February 2023: GHD partners with the GBCA to support circular economy initiatives and Green Building Day 2023. This collaboration promotes industry best practices and accelerates the adoption of sustainable building practices.
Future Outlook for APAC Green Buildings Market Market
The APAC green buildings market is poised for continued strong growth, driven by increasing environmental awareness, supportive government policies, and technological innovations. Strategic partnerships, investments in research and development, and a focus on sustainable supply chains will be key to success in this expanding market. The focus on circular economy principles will further shape the sector's future, creating new opportunities for innovation and market leadership.
APAC Green Buildings Market Segmentation
-
1. Product
- 1.1. Exterior Products
- 1.2. Interior products
- 1.3. Other Pr
-
2. End User
- 2.1. Residential
- 2.2. Office
- 2.3. Retail
- 2.4. Institutional
- 2.5. Other End Users
-
3. Geography
- 3.1. China
- 3.2. Japan
- 3.3. India
- 3.4. Australia
- 3.5. South Korea
- 3.6. Rest of APAC
APAC Green Buildings Market Segmentation By Geography
- 1. China
- 2. Japan
- 3. India
- 4. Australia
- 5. South Korea
- 6. Rest of APAC
APAC Green Buildings Market REPORT HIGHLIGHTS
| Aspects | Details |
|---|---|
| Study Period | 2019-2033 |
| Base Year | 2024 |
| Estimated Year | 2025 |
| Forecast Period | 2025-2033 |
| Historical Period | 2019-2024 |
| Growth Rate | CAGR of 12.23% from 2019-2033 |
| Segmentation |
|
Table of Contents
- 1. Introduction
- 1.1. Research Scope
- 1.2. Market Segmentation
- 1.3. Research Methodology
- 1.4. Definitions and Assumptions
- 2. Executive Summary
- 2.1. Introduction
- 3. Market Dynamics
- 3.1. Introduction
- 3.2. Market Drivers
- 3.2.1. Energy Efficiency in Construction Driving the Market; Flexibility and Customization Options Driving the Market
- 3.3. Market Restrains
- 3.3.1. Limited Availability of Suitable Land for Construction Hindering the Market; Lower Quality Compared to Traditional Construction
- 3.4. Market Trends
- 3.4.1. The Commercial Segment’s Increasing Demand for Green Buildings
- 4. Market Factor Analysis
- 4.1. Porters Five Forces
- 4.2. Supply/Value Chain
- 4.3. PESTEL analysis
- 4.4. Market Entropy
- 4.5. Patent/Trademark Analysis
- 5. Global APAC Green Buildings Market Analysis, Insights and Forecast, 2019-2031
- 5.1. Market Analysis, Insights and Forecast - by Product
- 5.1.1. Exterior Products
- 5.1.2. Interior products
- 5.1.3. Other Pr
- 5.2. Market Analysis, Insights and Forecast - by End User
- 5.2.1. Residential
- 5.2.2. Office
- 5.2.3. Retail
- 5.2.4. Institutional
- 5.2.5. Other End Users
- 5.3. Market Analysis, Insights and Forecast - by Geography
- 5.3.1. China
- 5.3.2. Japan
- 5.3.3. India
- 5.3.4. Australia
- 5.3.5. South Korea
- 5.3.6. Rest of APAC
- 5.4. Market Analysis, Insights and Forecast - by Region
- 5.4.1. China
- 5.4.2. Japan
- 5.4.3. India
- 5.4.4. Australia
- 5.4.5. South Korea
- 5.4.6. Rest of APAC
- 5.1. Market Analysis, Insights and Forecast - by Product
- 6. China APAC Green Buildings Market Analysis, Insights and Forecast, 2019-2031
- 6.1. Market Analysis, Insights and Forecast - by Product
- 6.1.1. Exterior Products
- 6.1.2. Interior products
- 6.1.3. Other Pr
- 6.2. Market Analysis, Insights and Forecast - by End User
- 6.2.1. Residential
- 6.2.2. Office
- 6.2.3. Retail
- 6.2.4. Institutional
- 6.2.5. Other End Users
- 6.3. Market Analysis, Insights and Forecast - by Geography
- 6.3.1. China
- 6.3.2. Japan
- 6.3.3. India
- 6.3.4. Australia
- 6.3.5. South Korea
- 6.3.6. Rest of APAC
- 6.1. Market Analysis, Insights and Forecast - by Product
- 7. Japan APAC Green Buildings Market Analysis, Insights and Forecast, 2019-2031
- 7.1. Market Analysis, Insights and Forecast - by Product
- 7.1.1. Exterior Products
- 7.1.2. Interior products
- 7.1.3. Other Pr
- 7.2. Market Analysis, Insights and Forecast - by End User
- 7.2.1. Residential
- 7.2.2. Office
- 7.2.3. Retail
- 7.2.4. Institutional
- 7.2.5. Other End Users
- 7.3. Market Analysis, Insights and Forecast - by Geography
- 7.3.1. China
- 7.3.2. Japan
- 7.3.3. India
- 7.3.4. Australia
- 7.3.5. South Korea
- 7.3.6. Rest of APAC
- 7.1. Market Analysis, Insights and Forecast - by Product
- 8. India APAC Green Buildings Market Analysis, Insights and Forecast, 2019-2031
- 8.1. Market Analysis, Insights and Forecast - by Product
- 8.1.1. Exterior Products
- 8.1.2. Interior products
- 8.1.3. Other Pr
- 8.2. Market Analysis, Insights and Forecast - by End User
- 8.2.1. Residential
- 8.2.2. Office
- 8.2.3. Retail
- 8.2.4. Institutional
- 8.2.5. Other End Users
- 8.3. Market Analysis, Insights and Forecast - by Geography
- 8.3.1. China
- 8.3.2. Japan
- 8.3.3. India
- 8.3.4. Australia
- 8.3.5. South Korea
- 8.3.6. Rest of APAC
- 8.1. Market Analysis, Insights and Forecast - by Product
- 9. Australia APAC Green Buildings Market Analysis, Insights and Forecast, 2019-2031
- 9.1. Market Analysis, Insights and Forecast - by Product
- 9.1.1. Exterior Products
- 9.1.2. Interior products
- 9.1.3. Other Pr
- 9.2. Market Analysis, Insights and Forecast - by End User
- 9.2.1. Residential
- 9.2.2. Office
- 9.2.3. Retail
- 9.2.4. Institutional
- 9.2.5. Other End Users
- 9.3. Market Analysis, Insights and Forecast - by Geography
- 9.3.1. China
- 9.3.2. Japan
- 9.3.3. India
- 9.3.4. Australia
- 9.3.5. South Korea
- 9.3.6. Rest of APAC
- 9.1. Market Analysis, Insights and Forecast - by Product
- 10. South Korea APAC Green Buildings Market Analysis, Insights and Forecast, 2019-2031
- 10.1. Market Analysis, Insights and Forecast - by Product
- 10.1.1. Exterior Products
- 10.1.2. Interior products
- 10.1.3. Other Pr
- 10.2. Market Analysis, Insights and Forecast - by End User
- 10.2.1. Residential
- 10.2.2. Office
- 10.2.3. Retail
- 10.2.4. Institutional
- 10.2.5. Other End Users
- 10.3. Market Analysis, Insights and Forecast - by Geography
- 10.3.1. China
- 10.3.2. Japan
- 10.3.3. India
- 10.3.4. Australia
- 10.3.5. South Korea
- 10.3.6. Rest of APAC
- 10.1. Market Analysis, Insights and Forecast - by Product
- 11. Rest of APAC APAC Green Buildings Market Analysis, Insights and Forecast, 2019-2031
- 11.1. Market Analysis, Insights and Forecast - by Product
- 11.1.1. Exterior Products
- 11.1.2. Interior products
- 11.1.3. Other Pr
- 11.2. Market Analysis, Insights and Forecast - by End User
- 11.2.1. Residential
- 11.2.2. Office
- 11.2.3. Retail
- 11.2.4. Institutional
- 11.2.5. Other End Users
- 11.3. Market Analysis, Insights and Forecast - by Geography
- 11.3.1. China
- 11.3.2. Japan
- 11.3.3. India
- 11.3.4. Australia
- 11.3.5. South Korea
- 11.3.6. Rest of APAC
- 11.1. Market Analysis, Insights and Forecast - by Product
- 12. China APAC Green Buildings Market Analysis, Insights and Forecast, 2019-2031
- 12.1. Market Analysis, Insights and Forecast - By Country/Sub-region
- 12.1.1.
- 13. Japan APAC Green Buildings Market Analysis, Insights and Forecast, 2019-2031
- 13.1. Market Analysis, Insights and Forecast - By Country/Sub-region
- 13.1.1.
- 14. India APAC Green Buildings Market Analysis, Insights and Forecast, 2019-2031
- 14.1. Market Analysis, Insights and Forecast - By Country/Sub-region
- 14.1.1.
- 15. Australia APAC Green Buildings Market Analysis, Insights and Forecast, 2019-2031
- 15.1. Market Analysis, Insights and Forecast - By Country/Sub-region
- 15.1.1.
- 16. South Korea APAC Green Buildings Market Analysis, Insights and Forecast, 2019-2031
- 16.1. Market Analysis, Insights and Forecast - By Country/Sub-region
- 16.1.1.
- 17. Rest of APAC APAC Green Buildings Market Analysis, Insights and Forecast, 2019-2031
- 17.1. Market Analysis, Insights and Forecast - By Country/Sub-region
- 17.1.1.
- 18. Competitive Analysis
- 18.1. Global Market Share Analysis 2024
- 18.2. Company Profiles
- 18.2.1 Keppel Land
- 18.2.1.1. Overview
- 18.2.1.2. Products
- 18.2.1.3. SWOT Analysis
- 18.2.1.4. Recent Developments
- 18.2.1.5. Financials (Based on Availability)
- 18.2.2 CapitaLand
- 18.2.2.1. Overview
- 18.2.2.2. Products
- 18.2.2.3. SWOT Analysis
- 18.2.2.4. Recent Developments
- 18.2.2.5. Financials (Based on Availability)
- 18.2.3 Shimizu Corporation
- 18.2.3.1. Overview
- 18.2.3.2. Products
- 18.2.3.3. SWOT Analysis
- 18.2.3.4. Recent Developments
- 18.2.3.5. Financials (Based on Availability)
- 18.2.4 WSP
- 18.2.4.1. Overview
- 18.2.4.2. Products
- 18.2.4.3. SWOT Analysis
- 18.2.4.4. Recent Developments
- 18.2.4.5. Financials (Based on Availability)
- 18.2.5 Gammon Construction
- 18.2.5.1. Overview
- 18.2.5.2. Products
- 18.2.5.3. SWOT Analysis
- 18.2.5.4. Recent Developments
- 18.2.5.5. Financials (Based on Availability)
- 18.2.6 Obayashi Corporation
- 18.2.6.1. Overview
- 18.2.6.2. Products
- 18.2.6.3. SWOT Analysis
- 18.2.6.4. Recent Developments
- 18.2.6.5. Financials (Based on Availability)
- 18.2.7 Sun Hung Kai Properties**List Not Exhaustive 7 3 Other Companie
- 18.2.7.1. Overview
- 18.2.7.2. Products
- 18.2.7.3. SWOT Analysis
- 18.2.7.4. Recent Developments
- 18.2.7.5. Financials (Based on Availability)
- 18.2.8 Lendlease
- 18.2.8.1. Overview
- 18.2.8.2. Products
- 18.2.8.3. SWOT Analysis
- 18.2.8.4. Recent Developments
- 18.2.8.5. Financials (Based on Availability)
- 18.2.9 Swire Properties
- 18.2.9.1. Overview
- 18.2.9.2. Products
- 18.2.9.3. SWOT Analysis
- 18.2.9.4. Recent Developments
- 18.2.9.5. Financials (Based on Availability)
- 18.2.10 Sino Group
- 18.2.10.1. Overview
- 18.2.10.2. Products
- 18.2.10.3. SWOT Analysis
- 18.2.10.4. Recent Developments
- 18.2.10.5. Financials (Based on Availability)
- 18.2.1 Keppel Land
List of Figures
- Figure 1: Global APAC Green Buildings Market Revenue Breakdown (Million, %) by Region 2024 & 2032
- Figure 2: China APAC Green Buildings Market Revenue (Million), by Country 2024 & 2032
- Figure 3: China APAC Green Buildings Market Revenue Share (%), by Country 2024 & 2032
- Figure 4: Japan APAC Green Buildings Market Revenue (Million), by Country 2024 & 2032
- Figure 5: Japan APAC Green Buildings Market Revenue Share (%), by Country 2024 & 2032
- Figure 6: India APAC Green Buildings Market Revenue (Million), by Country 2024 & 2032
- Figure 7: India APAC Green Buildings Market Revenue Share (%), by Country 2024 & 2032
- Figure 8: Australia APAC Green Buildings Market Revenue (Million), by Country 2024 & 2032
- Figure 9: Australia APAC Green Buildings Market Revenue Share (%), by Country 2024 & 2032
- Figure 10: South Korea APAC Green Buildings Market Revenue (Million), by Country 2024 & 2032
- Figure 11: South Korea APAC Green Buildings Market Revenue Share (%), by Country 2024 & 2032
- Figure 12: Rest of APAC APAC Green Buildings Market Revenue (Million), by Country 2024 & 2032
- Figure 13: Rest of APAC APAC Green Buildings Market Revenue Share (%), by Country 2024 & 2032
- Figure 14: China APAC Green Buildings Market Revenue (Million), by Product 2024 & 2032
- Figure 15: China APAC Green Buildings Market Revenue Share (%), by Product 2024 & 2032
- Figure 16: China APAC Green Buildings Market Revenue (Million), by End User 2024 & 2032
- Figure 17: China APAC Green Buildings Market Revenue Share (%), by End User 2024 & 2032
- Figure 18: China APAC Green Buildings Market Revenue (Million), by Geography 2024 & 2032
- Figure 19: China APAC Green Buildings Market Revenue Share (%), by Geography 2024 & 2032
- Figure 20: China APAC Green Buildings Market Revenue (Million), by Country 2024 & 2032
- Figure 21: China APAC Green Buildings Market Revenue Share (%), by Country 2024 & 2032
- Figure 22: Japan APAC Green Buildings Market Revenue (Million), by Product 2024 & 2032
- Figure 23: Japan APAC Green Buildings Market Revenue Share (%), by Product 2024 & 2032
- Figure 24: Japan APAC Green Buildings Market Revenue (Million), by End User 2024 & 2032
- Figure 25: Japan APAC Green Buildings Market Revenue Share (%), by End User 2024 & 2032
- Figure 26: Japan APAC Green Buildings Market Revenue (Million), by Geography 2024 & 2032
- Figure 27: Japan APAC Green Buildings Market Revenue Share (%), by Geography 2024 & 2032
- Figure 28: Japan APAC Green Buildings Market Revenue (Million), by Country 2024 & 2032
- Figure 29: Japan APAC Green Buildings Market Revenue Share (%), by Country 2024 & 2032
- Figure 30: India APAC Green Buildings Market Revenue (Million), by Product 2024 & 2032
- Figure 31: India APAC Green Buildings Market Revenue Share (%), by Product 2024 & 2032
- Figure 32: India APAC Green Buildings Market Revenue (Million), by End User 2024 & 2032
- Figure 33: India APAC Green Buildings Market Revenue Share (%), by End User 2024 & 2032
- Figure 34: India APAC Green Buildings Market Revenue (Million), by Geography 2024 & 2032
- Figure 35: India APAC Green Buildings Market Revenue Share (%), by Geography 2024 & 2032
- Figure 36: India APAC Green Buildings Market Revenue (Million), by Country 2024 & 2032
- Figure 37: India APAC Green Buildings Market Revenue Share (%), by Country 2024 & 2032
- Figure 38: Australia APAC Green Buildings Market Revenue (Million), by Product 2024 & 2032
- Figure 39: Australia APAC Green Buildings Market Revenue Share (%), by Product 2024 & 2032
- Figure 40: Australia APAC Green Buildings Market Revenue (Million), by End User 2024 & 2032
- Figure 41: Australia APAC Green Buildings Market Revenue Share (%), by End User 2024 & 2032
- Figure 42: Australia APAC Green Buildings Market Revenue (Million), by Geography 2024 & 2032
- Figure 43: Australia APAC Green Buildings Market Revenue Share (%), by Geography 2024 & 2032
- Figure 44: Australia APAC Green Buildings Market Revenue (Million), by Country 2024 & 2032
- Figure 45: Australia APAC Green Buildings Market Revenue Share (%), by Country 2024 & 2032
- Figure 46: South Korea APAC Green Buildings Market Revenue (Million), by Product 2024 & 2032
- Figure 47: South Korea APAC Green Buildings Market Revenue Share (%), by Product 2024 & 2032
- Figure 48: South Korea APAC Green Buildings Market Revenue (Million), by End User 2024 & 2032
- Figure 49: South Korea APAC Green Buildings Market Revenue Share (%), by End User 2024 & 2032
- Figure 50: South Korea APAC Green Buildings Market Revenue (Million), by Geography 2024 & 2032
- Figure 51: South Korea APAC Green Buildings Market Revenue Share (%), by Geography 2024 & 2032
- Figure 52: South Korea APAC Green Buildings Market Revenue (Million), by Country 2024 & 2032
- Figure 53: South Korea APAC Green Buildings Market Revenue Share (%), by Country 2024 & 2032
- Figure 54: Rest of APAC APAC Green Buildings Market Revenue (Million), by Product 2024 & 2032
- Figure 55: Rest of APAC APAC Green Buildings Market Revenue Share (%), by Product 2024 & 2032
- Figure 56: Rest of APAC APAC Green Buildings Market Revenue (Million), by End User 2024 & 2032
- Figure 57: Rest of APAC APAC Green Buildings Market Revenue Share (%), by End User 2024 & 2032
- Figure 58: Rest of APAC APAC Green Buildings Market Revenue (Million), by Geography 2024 & 2032
- Figure 59: Rest of APAC APAC Green Buildings Market Revenue Share (%), by Geography 2024 & 2032
- Figure 60: Rest of APAC APAC Green Buildings Market Revenue (Million), by Country 2024 & 2032
- Figure 61: Rest of APAC APAC Green Buildings Market Revenue Share (%), by Country 2024 & 2032
List of Tables
- Table 1: Global APAC Green Buildings Market Revenue Million Forecast, by Region 2019 & 2032
- Table 2: Global APAC Green Buildings Market Revenue Million Forecast, by Product 2019 & 2032
- Table 3: Global APAC Green Buildings Market Revenue Million Forecast, by End User 2019 & 2032
- Table 4: Global APAC Green Buildings Market Revenue Million Forecast, by Geography 2019 & 2032
- Table 5: Global APAC Green Buildings Market Revenue Million Forecast, by Region 2019 & 2032
- Table 6: Global APAC Green Buildings Market Revenue Million Forecast, by Country 2019 & 2032
- Table 7: APAC Green Buildings Market Revenue (Million) Forecast, by Application 2019 & 2032
- Table 8: Global APAC Green Buildings Market Revenue Million Forecast, by Country 2019 & 2032
- Table 9: APAC Green Buildings Market Revenue (Million) Forecast, by Application 2019 & 2032
- Table 10: Global APAC Green Buildings Market Revenue Million Forecast, by Country 2019 & 2032
- Table 11: APAC Green Buildings Market Revenue (Million) Forecast, by Application 2019 & 2032
- Table 12: Global APAC Green Buildings Market Revenue Million Forecast, by Country 2019 & 2032
- Table 13: APAC Green Buildings Market Revenue (Million) Forecast, by Application 2019 & 2032
- Table 14: Global APAC Green Buildings Market Revenue Million Forecast, by Country 2019 & 2032
- Table 15: APAC Green Buildings Market Revenue (Million) Forecast, by Application 2019 & 2032
- Table 16: Global APAC Green Buildings Market Revenue Million Forecast, by Country 2019 & 2032
- Table 17: APAC Green Buildings Market Revenue (Million) Forecast, by Application 2019 & 2032
- Table 18: Global APAC Green Buildings Market Revenue Million Forecast, by Product 2019 & 2032
- Table 19: Global APAC Green Buildings Market Revenue Million Forecast, by End User 2019 & 2032
- Table 20: Global APAC Green Buildings Market Revenue Million Forecast, by Geography 2019 & 2032
- Table 21: Global APAC Green Buildings Market Revenue Million Forecast, by Country 2019 & 2032
- Table 22: Global APAC Green Buildings Market Revenue Million Forecast, by Product 2019 & 2032
- Table 23: Global APAC Green Buildings Market Revenue Million Forecast, by End User 2019 & 2032
- Table 24: Global APAC Green Buildings Market Revenue Million Forecast, by Geography 2019 & 2032
- Table 25: Global APAC Green Buildings Market Revenue Million Forecast, by Country 2019 & 2032
- Table 26: Global APAC Green Buildings Market Revenue Million Forecast, by Product 2019 & 2032
- Table 27: Global APAC Green Buildings Market Revenue Million Forecast, by End User 2019 & 2032
- Table 28: Global APAC Green Buildings Market Revenue Million Forecast, by Geography 2019 & 2032
- Table 29: Global APAC Green Buildings Market Revenue Million Forecast, by Country 2019 & 2032
- Table 30: Global APAC Green Buildings Market Revenue Million Forecast, by Product 2019 & 2032
- Table 31: Global APAC Green Buildings Market Revenue Million Forecast, by End User 2019 & 2032
- Table 32: Global APAC Green Buildings Market Revenue Million Forecast, by Geography 2019 & 2032
- Table 33: Global APAC Green Buildings Market Revenue Million Forecast, by Country 2019 & 2032
- Table 34: Global APAC Green Buildings Market Revenue Million Forecast, by Product 2019 & 2032
- Table 35: Global APAC Green Buildings Market Revenue Million Forecast, by End User 2019 & 2032
- Table 36: Global APAC Green Buildings Market Revenue Million Forecast, by Geography 2019 & 2032
- Table 37: Global APAC Green Buildings Market Revenue Million Forecast, by Country 2019 & 2032
- Table 38: Global APAC Green Buildings Market Revenue Million Forecast, by Product 2019 & 2032
- Table 39: Global APAC Green Buildings Market Revenue Million Forecast, by End User 2019 & 2032
- Table 40: Global APAC Green Buildings Market Revenue Million Forecast, by Geography 2019 & 2032
- Table 41: Global APAC Green Buildings Market Revenue Million Forecast, by Country 2019 & 2032
Frequently Asked Questions
1. What is the projected Compound Annual Growth Rate (CAGR) of the APAC Green Buildings Market?
The projected CAGR is approximately 12.23%.
2. Which companies are prominent players in the APAC Green Buildings Market?
Key companies in the market include Keppel Land, CapitaLand, Shimizu Corporation, WSP, Gammon Construction, Obayashi Corporation, Sun Hung Kai Properties**List Not Exhaustive 7 3 Other Companie, Lendlease, Swire Properties, Sino Group.
3. What are the main segments of the APAC Green Buildings Market?
The market segments include Product, End User, Geography.
4. Can you provide details about the market size?
The market size is estimated to be USD 136.90 Million as of 2022.
5. What are some drivers contributing to market growth?
Energy Efficiency in Construction Driving the Market; Flexibility and Customization Options Driving the Market.
6. What are the notable trends driving market growth?
The Commercial Segment’s Increasing Demand for Green Buildings.
7. Are there any restraints impacting market growth?
Limited Availability of Suitable Land for Construction Hindering the Market; Lower Quality Compared to Traditional Construction.
8. Can you provide examples of recent developments in the market?
April 2023: The world’s largest coffee company, Starbucks, has unveiled its first greener stores in Asia-Pacific as a part of a global rollout of its greener store framework that has grown to more than 3,500 locations across 20 markets. The five new greener stores, located in Singapore (Singapore), Thailand (Thailand), and Vietnam (Vietnam), are among the first in Starbucks Asia-Pacific region. More than 20 other Starbucks stores are expected to receive greener store certifications later this year. With this latest round of certifications, Starbucks is well on track to reaching its goal of having 10,000 greener stores worldwide by 2025.
9. What pricing options are available for accessing the report?
Pricing options include single-user, multi-user, and enterprise licenses priced at USD 4750, USD 5250, and USD 8750 respectively.
10. Is the market size provided in terms of value or volume?
The market size is provided in terms of value, measured in Million.
11. Are there any specific market keywords associated with the report?
Yes, the market keyword associated with the report is "APAC Green Buildings Market," which aids in identifying and referencing the specific market segment covered.
12. How do I determine which pricing option suits my needs best?
The pricing options vary based on user requirements and access needs. Individual users may opt for single-user licenses, while businesses requiring broader access may choose multi-user or enterprise licenses for cost-effective access to the report.
13. Are there any additional resources or data provided in the APAC Green Buildings Market report?
While the report offers comprehensive insights, it's advisable to review the specific contents or supplementary materials provided to ascertain if additional resources or data are available.
14. How can I stay updated on further developments or reports in the APAC Green Buildings Market?
To stay informed about further developments, trends, and reports in the APAC Green Buildings Market, consider subscribing to industry newsletters, following relevant companies and organizations, or regularly checking reputable industry news sources and publications.
Methodology
Step 1 - Identification of Relevant Samples Size from Population Database


Step 2 - Approaches for Defining Global Market Size (Value, Volume* & Price*)

Note*: In applicable scenarios
Step 3 - Data Sources
Primary Research
- Web Analytics
- Survey Reports
- Research Institute
- Latest Research Reports
- Opinion Leaders
Secondary Research
- Annual Reports
- White Paper
- Latest Press Release
- Industry Association
- Paid Database
- Investor Presentations

Step 4 - Data Triangulation
Involves using different sources of information in order to increase the validity of a study
These sources are likely to be stakeholders in a program - participants, other researchers, program staff, other community members, and so on.
Then we put all data in single framework & apply various statistical tools to find out the dynamic on the market.
During the analysis stage, feedback from the stakeholder groups would be compared to determine areas of agreement as well as areas of divergence


