

Key Insights
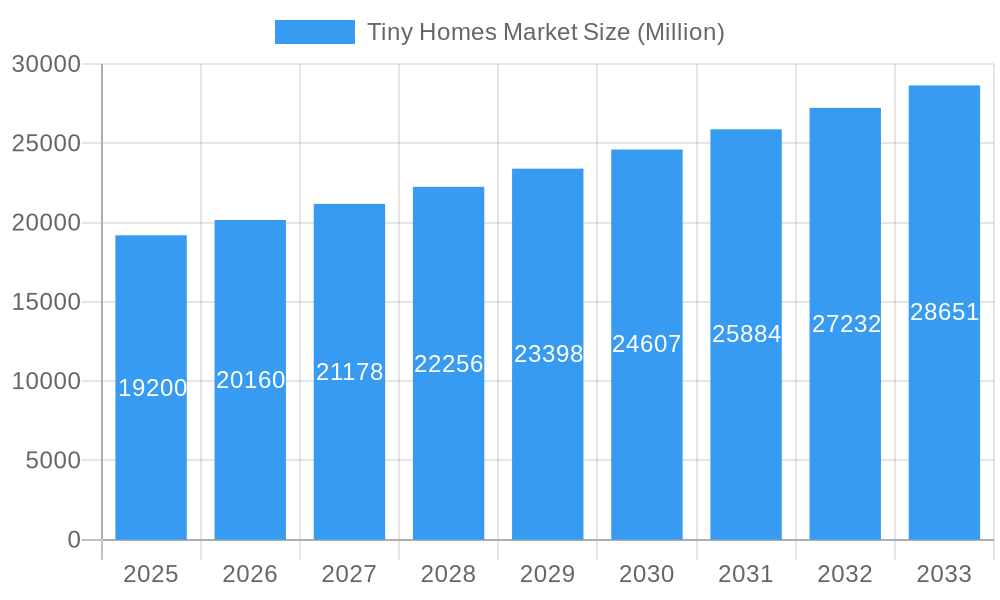
The tiny homes market, valued at $19.20 billion in 2025, is experiencing robust growth, projected to expand at a compound annual growth rate (CAGR) of 5% from 2025 to 2033. This surge is driven by several key factors. Increasing urbanization and soaring housing costs are prompting individuals and families to seek affordable and sustainable housing alternatives. The rising popularity of minimalist lifestyles and eco-conscious living further fuels demand. The market segmentation reveals diverse opportunities: mobile tiny homes cater to those seeking portability, while stationary options offer greater stability. Demand spans a wide range of sizes, from compact units under 130 sq ft to larger homes exceeding 500 sq ft, accommodating various needs and budgets. Applications extend beyond residential use, encompassing commercial and even industrial sectors, such as temporary offices or workshops. Key players like Aussie Tiny Houses, Tumbleweed Tiny House Company, and others are shaping the market landscape through innovation and product diversification. This competitive environment fosters continuous improvement in design, technology, and sustainability features, attracting a broader customer base.
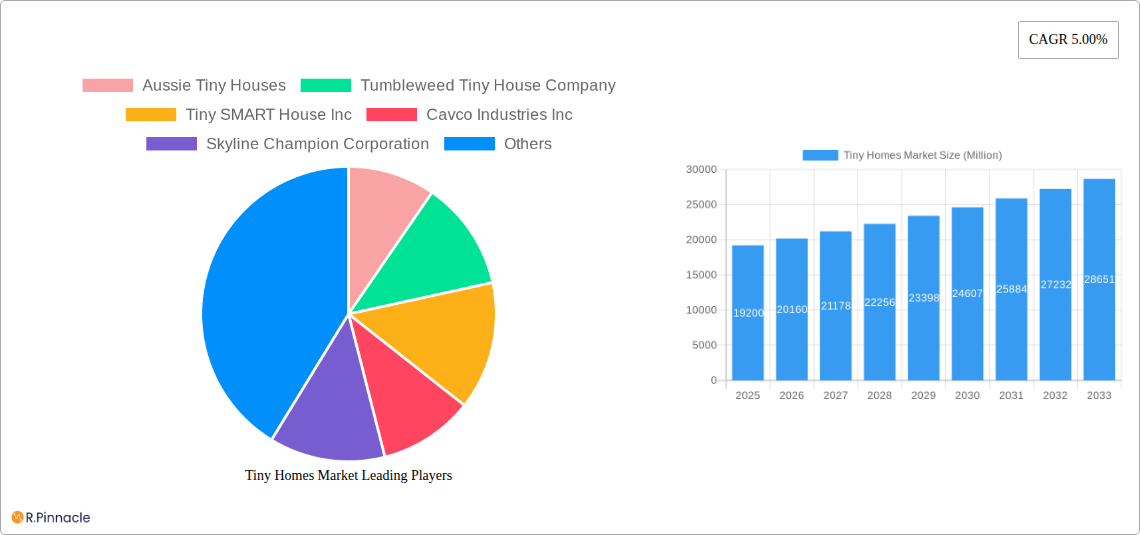
Tiny Homes Market Market Size (In Billion)
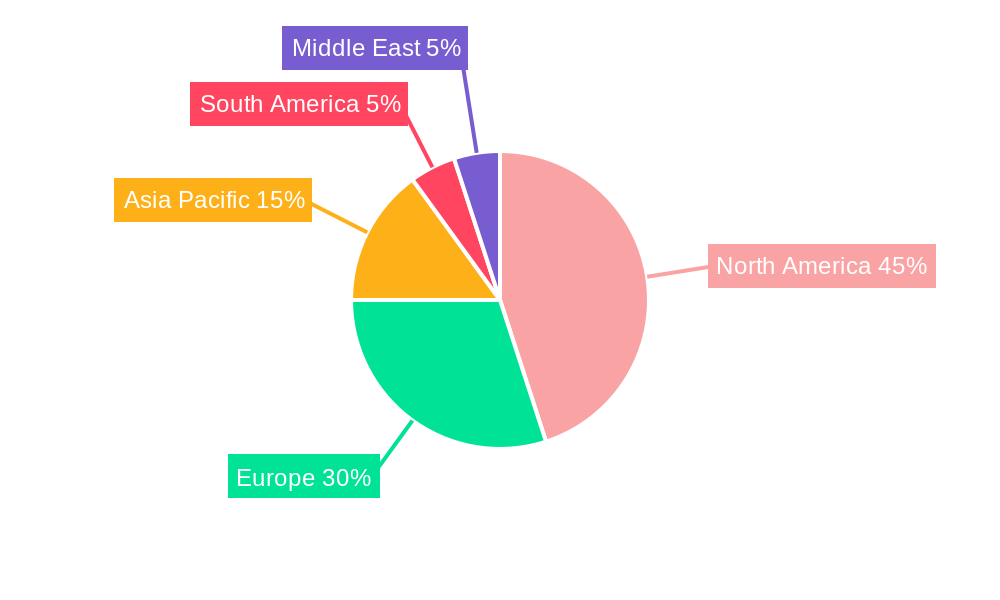
The geographic distribution of the market shows promising growth potential across different regions. While precise regional data is unavailable, a logical estimation based on global trends suggests North America and Europe will maintain significant market shares due to established economies and higher adoption rates of alternative housing solutions. However, emerging markets in the Asia-Pacific region are expected to witness substantial growth driven by increasing urbanization and rising disposable incomes. Further market expansion will depend on factors such as regulatory frameworks concerning tiny homes, the availability of suitable land for placement, and the ongoing development of innovative and affordable designs. The market's future is bright, fueled by continuous innovation, evolving consumer preferences, and a growing need for accessible and sustainable housing options.
Tiny Homes Market Company Market Share
Tiny Homes Market Report: 2019-2033
This comprehensive report provides a detailed analysis of the Tiny Homes Market, offering invaluable insights for industry professionals, investors, and entrepreneurs. With a study period spanning 2019-2033, a base year of 2025, and a forecast period of 2025-2033, this report leverages rigorous data analysis to paint a clear picture of the market's current state and future trajectory. The market is valued at xx Million USD in 2025 and is projected to reach xx Million USD by 2033, showcasing substantial growth potential.
Tiny Homes Market Structure & Innovation Trends
The Tiny Homes Market exhibits a moderately fragmented structure, with a diverse range of players ranging from established manufacturers like Cavco Industries Inc and Skyline Champion Corporation to smaller, specialized builders such as Aussie Tiny Houses and Tumbleweed Tiny House Company. Market share is currently distributed as follows: Cavco Industries Inc (xx%), Skyline Champion Corporation (xx%), and other players (xx%). Innovation is driven by increasing demand for sustainable and affordable housing solutions, along with advancements in building materials and construction techniques. Regulatory frameworks vary significantly across regions, impacting market growth and product development. Key product substitutes include traditional housing options, while end-user demographics are broadening to include a wider range of age groups and income levels. M&A activity in the sector has seen moderate activity, with deals valued at approximately xx Million USD in the past five years.
- Key Players Market Share: Cavco Industries Inc (xx%), Skyline Champion Corporation (xx%), other players (xx%)
- M&A Deal Value (Last 5 Years): xx Million USD
Tiny Homes Market Dynamics & Trends
The Tiny Homes Market is experiencing robust growth, driven by several factors. The increasing popularity of minimalist living, rising housing costs in urban areas, and growing environmental concerns contribute to the market expansion. Technological disruptions, such as the adoption of prefabricated and modular construction methods, are accelerating production and reducing costs. Consumer preferences are shifting towards energy-efficient, sustainable, and customizable tiny homes. The competitive landscape is dynamic, with both established players and new entrants vying for market share. The market is projected to achieve a CAGR of xx% during the forecast period (2025-2033). Market penetration is steadily increasing, particularly in developed countries, with an estimated xx% of the total housing market currently represented by tiny homes.
Dominant Regions & Segments in Tiny Homes Market
The North American market currently dominates the global Tiny Homes Market, driven by favorable regulatory environments and strong consumer demand. Within this region, the United States holds the largest share, followed by Canada. Europe and Asia Pacific are also experiencing significant growth, albeit at a slower pace compared to North America.
- Dominant Region: North America (United States)
- Leading Segments:
- By Product Type: Mobile Tiny Homes currently holds a larger market share than Stationary Tiny Homes due to cost-effectiveness and flexibility.
- By Area: The 130-500 sq. ft. segment is the most popular due to the balance it provides between affordability and livability.
- By Application: The Household segment overwhelmingly dominates the market, representing over xx% of total sales.
Key Drivers by Region:
- North America: Supportive government initiatives, high housing costs in urban centers, and growing acceptance of alternative housing options.
- Europe: Increasing awareness of sustainable living and government support for eco-friendly housing solutions.
- Asia Pacific: Rising disposable incomes and increasing urbanization, leading to a surge in demand for affordable housing.
Tiny Homes Market Product Innovations
Recent innovations focus on enhancing energy efficiency, incorporating smart home technologies, and offering greater customization options. Manufacturers are utilizing sustainable building materials and incorporating features such as solar panels, rainwater harvesting systems, and advanced insulation to meet growing environmental concerns. This trend resonates strongly with environmentally conscious consumers and contributes to the competitive advantages of these new product offerings. The integration of smart home technologies enhances convenience and adds value to the tiny home experience.
Report Scope & Segmentation Analysis
This report segments the Tiny Homes Market based on Product Type (Mobile Tiny Homes, Stationary Tiny Homes), Area (Less Than 130 Sq. Ft., 130-500 Sq. Ft., More Than 500 Sq. Ft.), and Application (Household, Commercial, Industrial, Others). Each segment's growth projection, market size, and competitive dynamics are analyzed in detail. The household segment accounts for a significant portion of the market, showing substantial growth potential in the coming years. The 130-500 sq ft segment exhibits the fastest growth, driven by demand for affordable, functional living spaces. Mobile tiny homes represent the largest share of the product type segment due to their versatility and portability.
Key Drivers of Tiny Homes Market Growth
The Tiny Homes Market is fueled by several key drivers: rising housing costs, especially in urban areas, leading to a search for affordable alternatives. Growing environmental awareness encourages a shift towards smaller, more sustainable living spaces. Technological advancements in materials and construction methods enhance efficiency and lower costs. Supportive government policies and zoning regulations in some regions are facilitating market expansion.
Challenges in the Tiny Homes Market Sector
Challenges include stringent building codes and zoning regulations in many areas, limiting construction and location choices. Supply chain disruptions and material cost fluctuations impact production and profitability. Competition from traditional housing and other alternative housing options places pressure on pricing and market share. The lack of standardization in tiny home construction practices can pose challenges for quality control and consumer protection.
Emerging Opportunities in Tiny Homes Market
Emerging opportunities include the development of multi-functional designs to optimize space utilization. Integration of smart technologies enhances the value proposition and promotes market appeal. Expansion into new markets, particularly in developing countries with high population densities and growing demand for affordable housing, is a significant opportunity. The rise of eco-tourism and off-grid living is creating new applications and demand for tiny homes.
Leading Players in the Tiny Homes Market Market
- Aussie Tiny Houses
- Tumbleweed Tiny House Company
- Tiny SMART House Inc
- Cavco Industries Inc
- Skyline Champion Corporation
- Mustard Seed Tiny Homes LLC
- CargoHome
- Mini Mansions Tiny Home Builders LLC
- Berkshire Hathaway Inc
- Nestron
Key Developments in Tiny Homes Market Industry
- February 2023: Sentosa Development Corporation launched low-carbon tiny houses on Lazarus Island, Singapore. This signals growing acceptance of tiny homes as sustainable housing solutions.
- February 2023: A USD 14 million mixed-use project in Cedar Hill, Texas, featuring tiny homes and storefronts, demonstrates the versatility of tiny homes for both residential and commercial use.
- February 2023: A new residential complex in Meriden, Connecticut, offering tiny homes ranging from 384 to 480 square feet, indicates a shift towards larger, more comfortable tiny homes.
Future Outlook for Tiny Homes Market Market
The Tiny Homes Market is poised for continued growth, driven by ongoing urbanization, increasing housing costs, and growing environmental concerns. Strategic opportunities lie in technological innovation, market expansion into new geographical regions, and diversification into new applications. Addressing regulatory hurdles and supply chain challenges will be crucial for sustained growth and market penetration.
Tiny Homes Market Segmentation
-
1. Product Type
- 1.1. Mobile Tiny Homes
- 1.2. Stationary Tiny Homes
-
2. Area
- 2.1. Less Than 130 Sq. Ft.
- 2.2. 130-500 Sq. Ft.
- 2.3. More Than 500 Sq. Ft.
-
3. Application
- 3.1. Household
- 3.2. Commercial
- 3.3. Industrial
- 3.4. Others
Tiny Homes Market Segmentation By Geography
- 1. North America
- 2. Europe
- 3. Asia Pacific
- 4. South America
- 5. Middle East
Tiny Homes Market Regional Market Share
Geographic Coverage of Tiny Homes Market
Tiny Homes Market REPORT HIGHLIGHTS
| Aspects | Details |
|---|---|
| Study Period | 2020-2034 |
| Base Year | 2025 |
| Estimated Year | 2026 |
| Forecast Period | 2026-2034 |
| Historical Period | 2020-2025 |
| Growth Rate | CAGR of 5.00% from 2020-2034 |
| Segmentation |
|
Table of Contents
- 1. Introduction
- 1.1. Research Scope
- 1.2. Market Segmentation
- 1.3. Research Objective
- 1.4. Definitions and Assumptions
- 2. Executive Summary
- 2.1. Market Snapshot
- 3. Market Dynamics
- 3.1. Market Drivers
- 3.2. Market Restrains
- 3.3. Market Trends
- 3.4. Market Opportunities
- 4. Market Factor Analysis
- 4.1. Porters Five Forces
- 4.1.1. Bargaining Power of Suppliers
- 4.1.2. Bargaining Power of Buyers
- 4.1.3. Threat of New Entrants
- 4.1.4. Threat of Substitutes
- 4.1.5. Competitive Rivalry
- 4.2. PESTEL analysis
- 4.3. BCG Analysis
- 4.3.1. Stars (High Growth, High Market Share)
- 4.3.2. Cash Cows (Low Growth, High Market Share)
- 4.3.3. Question Mark (High Growth, Low Market Share)
- 4.3.4. Dogs (Low Growth, Low Market Share)
- 4.4. Ansoff Matrix Analysis
- 4.5. Supply Chain Analysis
- 4.6. Regulatory Landscape
- 4.7. Current Market Potential and Opportunity Assessment (TAM–SAM–SOM Framework)
- 4.8. PRI Analyst Note
- 4.1. Porters Five Forces
- 5. Market Analysis, Insights and Forecast 2021-2033
- 5.1. Market Analysis, Insights and Forecast - by Product Type
- 5.1.1. Mobile Tiny Homes
- 5.1.2. Stationary Tiny Homes
- 5.2. Market Analysis, Insights and Forecast - by Area
- 5.2.1. Less Than 130 Sq. Ft.
- 5.2.2. 130-500 Sq. Ft.
- 5.2.3. More Than 500 Sq. Ft.
- 5.3. Market Analysis, Insights and Forecast - by Application
- 5.3.1. Household
- 5.3.2. Commercial
- 5.3.3. Industrial
- 5.3.4. Others
- 5.4. Market Analysis, Insights and Forecast - by Region
- 5.4.1. North America
- 5.4.2. Europe
- 5.4.3. Asia Pacific
- 5.4.4. South America
- 5.4.5. Middle East
- 5.1. Market Analysis, Insights and Forecast - by Product Type
- 6. Global Tiny Homes Market Analysis, Insights and Forecast, 2021-2033
- 6.1. Market Analysis, Insights and Forecast - by Product Type
- 6.1.1. Mobile Tiny Homes
- 6.1.2. Stationary Tiny Homes
- 6.2. Market Analysis, Insights and Forecast - by Area
- 6.2.1. Less Than 130 Sq. Ft.
- 6.2.2. 130-500 Sq. Ft.
- 6.2.3. More Than 500 Sq. Ft.
- 6.3. Market Analysis, Insights and Forecast - by Application
- 6.3.1. Household
- 6.3.2. Commercial
- 6.3.3. Industrial
- 6.3.4. Others
- 6.1. Market Analysis, Insights and Forecast - by Product Type
- 7. North America Tiny Homes Market Analysis, Insights and Forecast, 2020-2032
- 7.1. Market Analysis, Insights and Forecast - by Product Type
- 7.1.1. Mobile Tiny Homes
- 7.1.2. Stationary Tiny Homes
- 7.2. Market Analysis, Insights and Forecast - by Area
- 7.2.1. Less Than 130 Sq. Ft.
- 7.2.2. 130-500 Sq. Ft.
- 7.2.3. More Than 500 Sq. Ft.
- 7.3. Market Analysis, Insights and Forecast - by Application
- 7.3.1. Household
- 7.3.2. Commercial
- 7.3.3. Industrial
- 7.3.4. Others
- 7.1. Market Analysis, Insights and Forecast - by Product Type
- 8. Europe Tiny Homes Market Analysis, Insights and Forecast, 2020-2032
- 8.1. Market Analysis, Insights and Forecast - by Product Type
- 8.1.1. Mobile Tiny Homes
- 8.1.2. Stationary Tiny Homes
- 8.2. Market Analysis, Insights and Forecast - by Area
- 8.2.1. Less Than 130 Sq. Ft.
- 8.2.2. 130-500 Sq. Ft.
- 8.2.3. More Than 500 Sq. Ft.
- 8.3. Market Analysis, Insights and Forecast - by Application
- 8.3.1. Household
- 8.3.2. Commercial
- 8.3.3. Industrial
- 8.3.4. Others
- 8.1. Market Analysis, Insights and Forecast - by Product Type
- 9. Asia Pacific Tiny Homes Market Analysis, Insights and Forecast, 2020-2032
- 9.1. Market Analysis, Insights and Forecast - by Product Type
- 9.1.1. Mobile Tiny Homes
- 9.1.2. Stationary Tiny Homes
- 9.2. Market Analysis, Insights and Forecast - by Area
- 9.2.1. Less Than 130 Sq. Ft.
- 9.2.2. 130-500 Sq. Ft.
- 9.2.3. More Than 500 Sq. Ft.
- 9.3. Market Analysis, Insights and Forecast - by Application
- 9.3.1. Household
- 9.3.2. Commercial
- 9.3.3. Industrial
- 9.3.4. Others
- 9.1. Market Analysis, Insights and Forecast - by Product Type
- 10. South America Tiny Homes Market Analysis, Insights and Forecast, 2020-2032
- 10.1. Market Analysis, Insights and Forecast - by Product Type
- 10.1.1. Mobile Tiny Homes
- 10.1.2. Stationary Tiny Homes
- 10.2. Market Analysis, Insights and Forecast - by Area
- 10.2.1. Less Than 130 Sq. Ft.
- 10.2.2. 130-500 Sq. Ft.
- 10.2.3. More Than 500 Sq. Ft.
- 10.3. Market Analysis, Insights and Forecast - by Application
- 10.3.1. Household
- 10.3.2. Commercial
- 10.3.3. Industrial
- 10.3.4. Others
- 10.1. Market Analysis, Insights and Forecast - by Product Type
- 11. Middle East Tiny Homes Market Analysis, Insights and Forecast, 2020-2032
- 11.1. Market Analysis, Insights and Forecast - by Product Type
- 11.1.1. Mobile Tiny Homes
- 11.1.2. Stationary Tiny Homes
- 11.2. Market Analysis, Insights and Forecast - by Area
- 11.2.1. Less Than 130 Sq. Ft.
- 11.2.2. 130-500 Sq. Ft.
- 11.2.3. More Than 500 Sq. Ft.
- 11.3. Market Analysis, Insights and Forecast - by Application
- 11.3.1. Household
- 11.3.2. Commercial
- 11.3.3. Industrial
- 11.3.4. Others
- 11.1. Market Analysis, Insights and Forecast - by Product Type
- 12. Competitive Analysis
- 12.1. Company Profiles
- 12.1.1 Aussie Tiny Houses
- 12.1.1.1. Company Overview
- 12.1.1.2. Products
- 12.1.1.3. Company Financials
- 12.1.1.4. SWOT Analysis
- 12.1.2 Tumbleweed Tiny House Company
- 12.1.2.1. Company Overview
- 12.1.2.2. Products
- 12.1.2.3. Company Financials
- 12.1.2.4. SWOT Analysis
- 12.1.3 Tiny SMART House Inc
- 12.1.3.1. Company Overview
- 12.1.3.2. Products
- 12.1.3.3. Company Financials
- 12.1.3.4. SWOT Analysis
- 12.1.4 Cavco Industries Inc
- 12.1.4.1. Company Overview
- 12.1.4.2. Products
- 12.1.4.3. Company Financials
- 12.1.4.4. SWOT Analysis
- 12.1.5 Skyline Champion Corporation
- 12.1.5.1. Company Overview
- 12.1.5.2. Products
- 12.1.5.3. Company Financials
- 12.1.5.4. SWOT Analysis
- 12.1.6 Mustard Seed Tiny Homes LLC
- 12.1.6.1. Company Overview
- 12.1.6.2. Products
- 12.1.6.3. Company Financials
- 12.1.6.4. SWOT Analysis
- 12.1.7 CargoHome
- 12.1.7.1. Company Overview
- 12.1.7.2. Products
- 12.1.7.3. Company Financials
- 12.1.7.4. SWOT Analysis
- 12.1.8 Mini Mansions Tiny Home Builders LLC
- 12.1.8.1. Company Overview
- 12.1.8.2. Products
- 12.1.8.3. Company Financials
- 12.1.8.4. SWOT Analysis
- 12.1.9 Berkshire Hathaway Inc
- 12.1.9.1. Company Overview
- 12.1.9.2. Products
- 12.1.9.3. Company Financials
- 12.1.9.4. SWOT Analysis
- 12.1.10 Nestron**List Not Exhaustive
- 12.1.10.1. Company Overview
- 12.1.10.2. Products
- 12.1.10.3. Company Financials
- 12.1.10.4. SWOT Analysis
- 12.1.1 Aussie Tiny Houses
- 12.2. Market Entropy
- 12.2.1 Company's Key Areas Served
- 12.2.2 Recent Developments
- 12.3. Company Market Share Analysis 2025
- 12.3.1 Top 5 Companies Market Share Analysis
- 12.3.2 Top 3 Companies Market Share Analysis
- 12.4. List of Potential Customers
- 13. Research Methodology
List of Figures
- Figure 1: Global Tiny Homes Market Revenue Breakdown (Million, %) by Region 2025 & 2033
- Figure 2: North America Tiny Homes Market Revenue (Million), by Product Type 2025 & 2033
- Figure 3: North America Tiny Homes Market Revenue Share (%), by Product Type 2025 & 2033
- Figure 4: North America Tiny Homes Market Revenue (Million), by Area 2025 & 2033
- Figure 5: North America Tiny Homes Market Revenue Share (%), by Area 2025 & 2033
- Figure 6: North America Tiny Homes Market Revenue (Million), by Application 2025 & 2033
- Figure 7: North America Tiny Homes Market Revenue Share (%), by Application 2025 & 2033
- Figure 8: North America Tiny Homes Market Revenue (Million), by Country 2025 & 2033
- Figure 9: North America Tiny Homes Market Revenue Share (%), by Country 2025 & 2033
- Figure 10: Europe Tiny Homes Market Revenue (Million), by Product Type 2025 & 2033
- Figure 11: Europe Tiny Homes Market Revenue Share (%), by Product Type 2025 & 2033
- Figure 12: Europe Tiny Homes Market Revenue (Million), by Area 2025 & 2033
- Figure 13: Europe Tiny Homes Market Revenue Share (%), by Area 2025 & 2033
- Figure 14: Europe Tiny Homes Market Revenue (Million), by Application 2025 & 2033
- Figure 15: Europe Tiny Homes Market Revenue Share (%), by Application 2025 & 2033
- Figure 16: Europe Tiny Homes Market Revenue (Million), by Country 2025 & 2033
- Figure 17: Europe Tiny Homes Market Revenue Share (%), by Country 2025 & 2033
- Figure 18: Asia Pacific Tiny Homes Market Revenue (Million), by Product Type 2025 & 2033
- Figure 19: Asia Pacific Tiny Homes Market Revenue Share (%), by Product Type 2025 & 2033
- Figure 20: Asia Pacific Tiny Homes Market Revenue (Million), by Area 2025 & 2033
- Figure 21: Asia Pacific Tiny Homes Market Revenue Share (%), by Area 2025 & 2033
- Figure 22: Asia Pacific Tiny Homes Market Revenue (Million), by Application 2025 & 2033
- Figure 23: Asia Pacific Tiny Homes Market Revenue Share (%), by Application 2025 & 2033
- Figure 24: Asia Pacific Tiny Homes Market Revenue (Million), by Country 2025 & 2033
- Figure 25: Asia Pacific Tiny Homes Market Revenue Share (%), by Country 2025 & 2033
- Figure 26: South America Tiny Homes Market Revenue (Million), by Product Type 2025 & 2033
- Figure 27: South America Tiny Homes Market Revenue Share (%), by Product Type 2025 & 2033
- Figure 28: South America Tiny Homes Market Revenue (Million), by Area 2025 & 2033
- Figure 29: South America Tiny Homes Market Revenue Share (%), by Area 2025 & 2033
- Figure 30: South America Tiny Homes Market Revenue (Million), by Application 2025 & 2033
- Figure 31: South America Tiny Homes Market Revenue Share (%), by Application 2025 & 2033
- Figure 32: South America Tiny Homes Market Revenue (Million), by Country 2025 & 2033
- Figure 33: South America Tiny Homes Market Revenue Share (%), by Country 2025 & 2033
- Figure 34: Middle East Tiny Homes Market Revenue (Million), by Product Type 2025 & 2033
- Figure 35: Middle East Tiny Homes Market Revenue Share (%), by Product Type 2025 & 2033
- Figure 36: Middle East Tiny Homes Market Revenue (Million), by Area 2025 & 2033
- Figure 37: Middle East Tiny Homes Market Revenue Share (%), by Area 2025 & 2033
- Figure 38: Middle East Tiny Homes Market Revenue (Million), by Application 2025 & 2033
- Figure 39: Middle East Tiny Homes Market Revenue Share (%), by Application 2025 & 2033
- Figure 40: Middle East Tiny Homes Market Revenue (Million), by Country 2025 & 2033
- Figure 41: Middle East Tiny Homes Market Revenue Share (%), by Country 2025 & 2033
List of Tables
- Table 1: Global Tiny Homes Market Revenue Million Forecast, by Product Type 2020 & 2033
- Table 2: Global Tiny Homes Market Revenue Million Forecast, by Area 2020 & 2033
- Table 3: Global Tiny Homes Market Revenue Million Forecast, by Application 2020 & 2033
- Table 4: Global Tiny Homes Market Revenue Million Forecast, by Region 2020 & 2033
- Table 5: Global Tiny Homes Market Revenue Million Forecast, by Product Type 2020 & 2033
- Table 6: Global Tiny Homes Market Revenue Million Forecast, by Area 2020 & 2033
- Table 7: Global Tiny Homes Market Revenue Million Forecast, by Application 2020 & 2033
- Table 8: Global Tiny Homes Market Revenue Million Forecast, by Country 2020 & 2033
- Table 9: Global Tiny Homes Market Revenue Million Forecast, by Product Type 2020 & 2033
- Table 10: Global Tiny Homes Market Revenue Million Forecast, by Area 2020 & 2033
- Table 11: Global Tiny Homes Market Revenue Million Forecast, by Application 2020 & 2033
- Table 12: Global Tiny Homes Market Revenue Million Forecast, by Country 2020 & 2033
- Table 13: Global Tiny Homes Market Revenue Million Forecast, by Product Type 2020 & 2033
- Table 14: Global Tiny Homes Market Revenue Million Forecast, by Area 2020 & 2033
- Table 15: Global Tiny Homes Market Revenue Million Forecast, by Application 2020 & 2033
- Table 16: Global Tiny Homes Market Revenue Million Forecast, by Country 2020 & 2033
- Table 17: Global Tiny Homes Market Revenue Million Forecast, by Product Type 2020 & 2033
- Table 18: Global Tiny Homes Market Revenue Million Forecast, by Area 2020 & 2033
- Table 19: Global Tiny Homes Market Revenue Million Forecast, by Application 2020 & 2033
- Table 20: Global Tiny Homes Market Revenue Million Forecast, by Country 2020 & 2033
- Table 21: Global Tiny Homes Market Revenue Million Forecast, by Product Type 2020 & 2033
- Table 22: Global Tiny Homes Market Revenue Million Forecast, by Area 2020 & 2033
- Table 23: Global Tiny Homes Market Revenue Million Forecast, by Application 2020 & 2033
- Table 24: Global Tiny Homes Market Revenue Million Forecast, by Country 2020 & 2033
Frequently Asked Questions
1. What is the projected Compound Annual Growth Rate (CAGR) of the Tiny Homes Market?
The projected CAGR is approximately 5.00%.
2. Which companies are prominent players in the Tiny Homes Market?
Key companies in the market include Aussie Tiny Houses, Tumbleweed Tiny House Company, Tiny SMART House Inc, Cavco Industries Inc, Skyline Champion Corporation, Mustard Seed Tiny Homes LLC, CargoHome, Mini Mansions Tiny Home Builders LLC, Berkshire Hathaway Inc, Nestron**List Not Exhaustive.
3. What are the main segments of the Tiny Homes Market?
The market segments include Product Type, Area, Application.
4. Can you provide details about the market size?
The market size is estimated to be USD 19.20 Million as of 2022.
5. What are some drivers contributing to market growth?
4.; Increase In Tourism Industry4.; Sustainability and Environmental Concerns.
6. What are the notable trends driving market growth?
Household Segment Anticipated to Hold Major Share Due to Increasing Demand for Affordable Housing.
7. Are there any restraints impacting market growth?
4.; Financial Constraints4.; High Maintenance.
8. Can you provide examples of recent developments in the market?
February 2023: Sentosa Development Corporation launched low-carbon tiny houses on Lazarus Island for the first time. These tiny homes measure between 170 square feet. Tiny homes are designed in an open-plan concept consisting of a bedroom, kitchenette, living area, and outdoor deck.
9. What pricing options are available for accessing the report?
Pricing options include single-user, multi-user, and enterprise licenses priced at USD 4750, USD 5250, and USD 8750 respectively.
10. Is the market size provided in terms of value or volume?
The market size is provided in terms of value, measured in Million.
11. Are there any specific market keywords associated with the report?
Yes, the market keyword associated with the report is "Tiny Homes Market," which aids in identifying and referencing the specific market segment covered.
12. How do I determine which pricing option suits my needs best?
The pricing options vary based on user requirements and access needs. Individual users may opt for single-user licenses, while businesses requiring broader access may choose multi-user or enterprise licenses for cost-effective access to the report.
13. Are there any additional resources or data provided in the Tiny Homes Market report?
While the report offers comprehensive insights, it's advisable to review the specific contents or supplementary materials provided to ascertain if additional resources or data are available.
14. How can I stay updated on further developments or reports in the Tiny Homes Market?
To stay informed about further developments, trends, and reports in the Tiny Homes Market, consider subscribing to industry newsletters, following relevant companies and organizations, or regularly checking reputable industry news sources and publications.
Methodology
Step 1 - Identification of Relevant Samples Size from Population Database


Step 2 - Approaches for Defining Global Market Size (Value, Volume* & Price*)

Note*: In applicable scenarios
Step 3 - Data Sources
Primary Research
- Web Analytics
- Survey Reports
- Research Institute
- Latest Research Reports
- Opinion Leaders
Secondary Research
- Annual Reports
- White Paper
- Latest Press Release
- Industry Association
- Paid Database
- Investor Presentations

Step 4 - Data Triangulation
Involves using different sources of information in order to increase the validity of a study
These sources are likely to be stakeholders in a program - participants, other researchers, program staff, other community members, and so on.
Then we put all data in single framework & apply various statistical tools to find out the dynamic on the market.
During the analysis stage, feedback from the stakeholder groups would be compared to determine areas of agreement as well as areas of divergence