

Key Insights
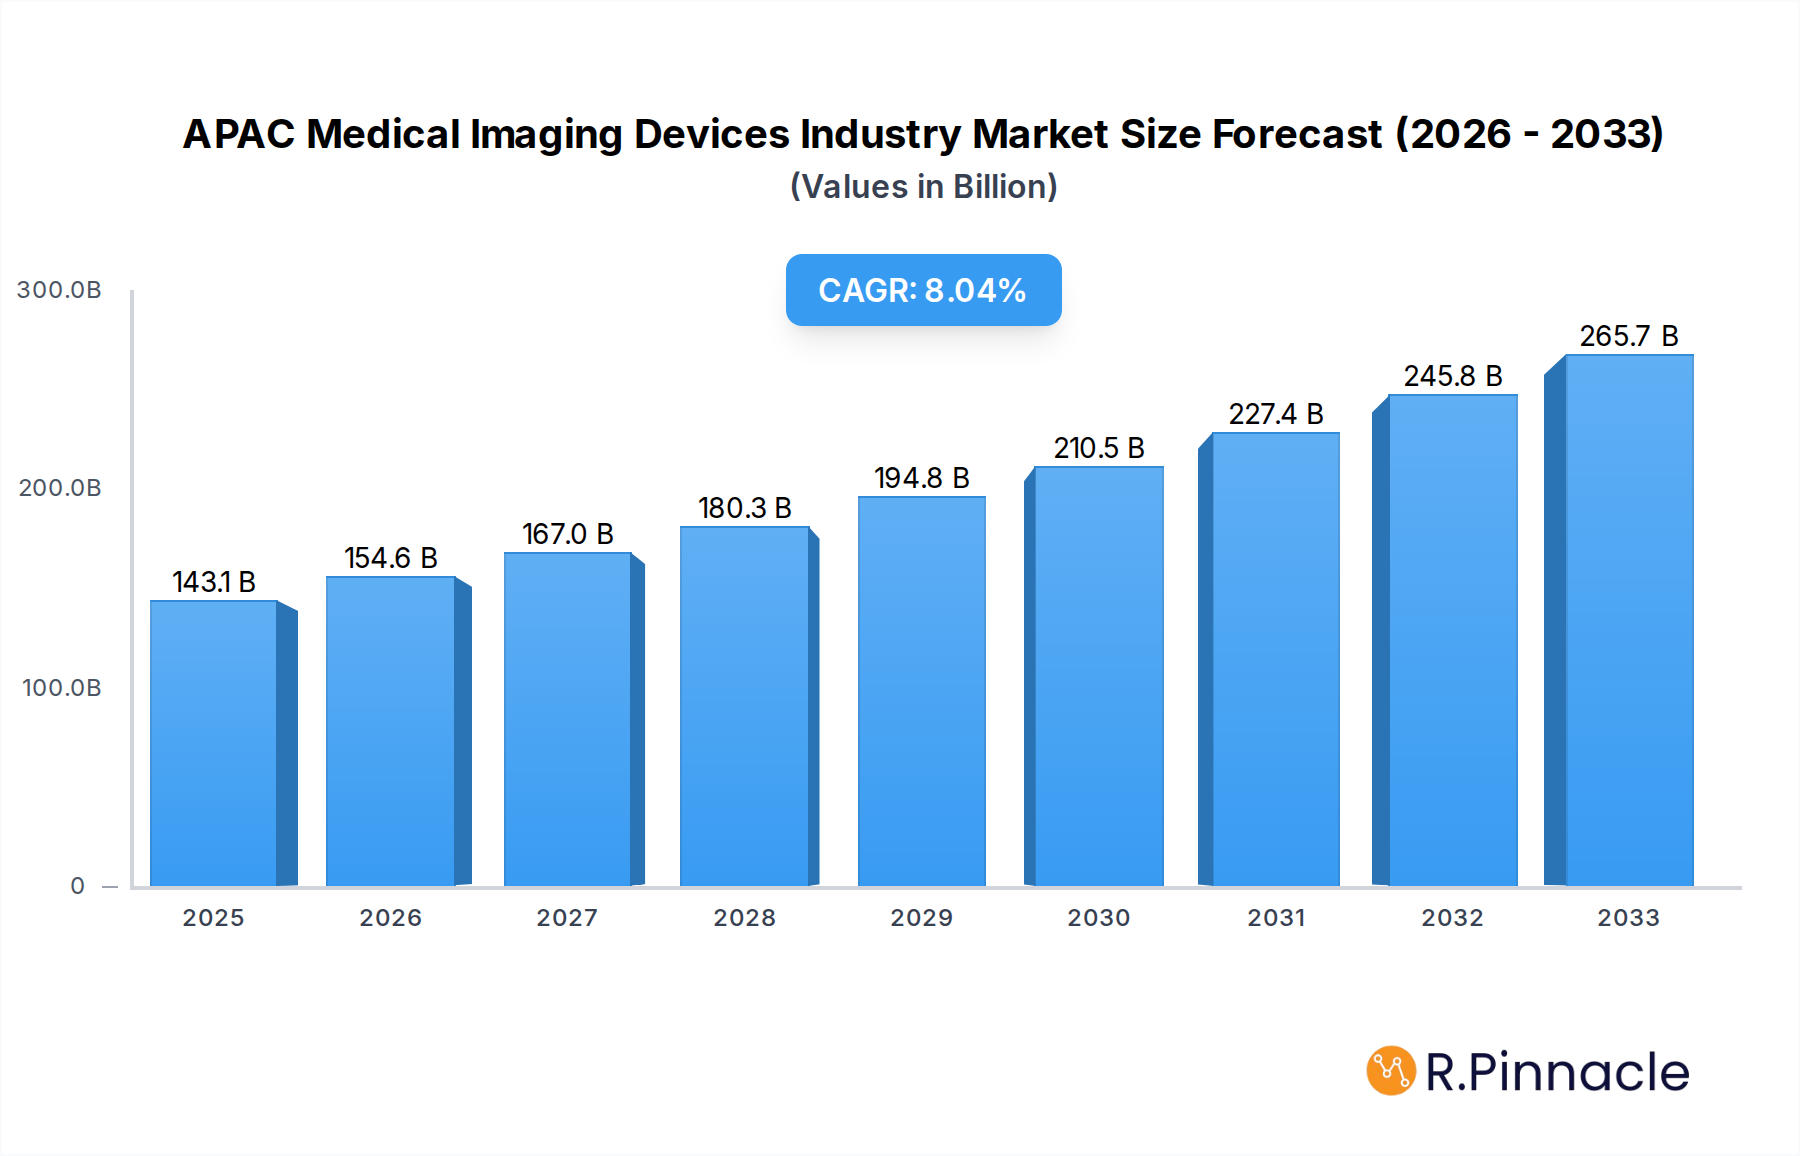
The APAC Medical Imaging Devices market is poised for significant expansion, projected to reach a substantial USD 143.12 billion by 2025. This growth is fueled by an impressive 8% CAGR, indicating a robust and sustained upward trajectory. The increasing prevalence of chronic diseases, coupled with a growing aging population across the Asia-Pacific region, is a primary driver. Enhanced healthcare expenditure, government initiatives promoting advanced diagnostics, and a rising awareness of early disease detection are further propelling market demand. The "MRI" modality, specifically low and mid-field MRI systems, is anticipated to play a crucial role in this expansion, driven by advancements in technology making these systems more accessible and affordable for a wider range of healthcare facilities. The increasing adoption of these imaging solutions in both urban and semi-urban areas will contribute to broader patient access and improved diagnostic capabilities, underpinning the market's vigorous growth.

APAC Medical Imaging Devices Industry Market Size (In Billion)
The market's momentum is also influenced by technological innovations leading to more portable, efficient, and cost-effective imaging solutions. The integration of artificial intelligence (AI) and machine learning (ML) in image analysis and interpretation is further enhancing diagnostic accuracy and speed. Despite the promising outlook, certain restraints such as high initial investment costs for advanced equipment and a shortage of skilled radiographers in some developing economies within APAC could pose challenges. However, the overwhelming demand for advanced medical diagnostics, particularly in rapidly developing nations like China and India, alongside a growing middle class with increased disposable income for healthcare, is expected to outweigh these limitations. The focus on preventative healthcare and the increasing integration of medical imaging into routine check-ups will continue to be significant growth catalysts for the APAC Medical Imaging Devices market in the forecast period.
APAC Medical Imaging Devices Industry Company Market Share
APAC Medical Imaging Devices Industry Market Structure & Innovation Trends
The APAC medical imaging devices market exhibits a moderately concentrated structure, with a few dominant global players like GE Healthcare, Siemens AG, and Koninklijke Philips N.V. holding significant market share, estimated to be over 60%. However, the region also boasts a growing number of dynamic local manufacturers, particularly in China and South Korea, contributing to innovation and competition. Innovation is primarily driven by advancements in artificial intelligence (AI) for image analysis, miniaturization of devices, and the development of higher resolution imaging modalities. Regulatory frameworks across APAC nations are evolving, with increasing harmonization efforts, though compliance remains a complex landscape. Product substitutes are emerging, especially in lower-cost imaging alternatives for certain diagnostic needs. End-user demographics are shifting towards an aging population with a higher prevalence of chronic diseases, fueling demand for sophisticated diagnostic tools. Mergers and acquisitions (M&A) activity, valued at approximately $5 billion in the historical period, remains a key strategy for market consolidation and technology acquisition.
- Market Concentration: Dominated by global leaders, but with rising regional players.
- Innovation Drivers: AI integration, miniaturization, enhanced resolution.
- Regulatory Frameworks: Evolving with a trend towards harmonization.
- Product Substitutes: Emerging lower-cost alternatives.
- End-User Demographics: Aging population and chronic disease prevalence.
- M&A Activity: Strategic for consolidation and technology acquisition, estimated at $5 billion in the historical period.
APAC Medical Imaging Devices Industry Market Dynamics & Trends
The APAC medical imaging devices market is experiencing robust expansion, projected to reach over $30 billion by 2033, driven by a confluence of escalating healthcare expenditure, increasing prevalence of chronic and lifestyle-related diseases, and a growing demand for advanced diagnostic solutions. The average annual growth rate (CAGR) for the forecast period is an impressive xx%, propelled by a rising middle class with greater disposable income and improved access to healthcare services. Technological disruptions are at the forefront, with the integration of AI in image acquisition, processing, and interpretation significantly enhancing diagnostic accuracy and efficiency. Machine learning algorithms are revolutionizing early disease detection in modalities like MRI and CT scans, leading to better patient outcomes. Furthermore, the push towards minimally invasive procedures and early diagnosis is boosting the adoption of portable and high-resolution imaging devices. Consumer preferences are increasingly leaning towards personalized medicine and preventative healthcare, necessitating more precise and accessible diagnostic tools. The competitive landscape is dynamic, characterized by intense R&D investments, strategic collaborations between technology providers and healthcare institutions, and a gradual shift towards value-based healthcare models. Market penetration is steadily increasing, especially in emerging economies within APAC, as governments invest heavily in upgrading their healthcare infrastructure. The demand for low and mid-field MRI systems is particularly noteworthy, driven by their cost-effectiveness and suitability for a wide range of diagnostic applications in diverse healthcare settings, from large hospitals to smaller clinics. This segment is anticipated to witness a CAGR of xx% during the forecast period, reaching an estimated market size of $15 billion by 2033.
Dominant Regions & Segments in APAC Medical Imaging Devices Industry
The dominant region in the APAC medical imaging devices industry, particularly for Modality: MRI (Low and mid-field MRI systems), is China. This is attributed to its large population, substantial government investment in healthcare infrastructure, and the rapid adoption of advanced medical technologies. Within the MRI segment, low and mid-field MRI systems are experiencing significant growth due to their cost-effectiveness and versatility, making them accessible for a broader range of healthcare facilities.
APAC Medical Imaging Devices Industry Product Innovations
Product innovation in APAC medical imaging devices is rapidly evolving, with a strong focus on AI-powered diagnostics, miniaturization for portability, and enhanced image resolution for greater accuracy. Developments in low and mid-field MRI systems, such as improved coil technology and faster scan times, are enhancing patient comfort and throughput. These innovations offer competitive advantages by enabling earlier and more precise disease detection, improving workflow efficiency for radiologists, and expanding access to advanced imaging in underserved regions.
Report Scope & Segmentation Analysis
This report provides a comprehensive analysis of the APAC Medical Imaging Devices Industry, with a specific focus on Modality: MRI (Low and mid-field MRI systems). The segmentation analysis includes:
By Modality:
- MRI
- Low and mid-field MRI systems
- MRI
By Application:
- Neurology
- Orthopedics
- Cardiology
- Oncology
- Abdominal Imaging
- Others
By End-User:
- Hospitals
- Diagnostic Imaging Centers
- Clinics
- Others
By Region:
- China
- Japan
- India
- South Korea
- Australia & New Zealand
- Southeast Asia
- Rest of APAC
Key Drivers of APAC Medical Imaging Devices Industry Growth
The APAC medical imaging devices industry's growth is propelled by several key factors. Rising healthcare expenditure, driven by government initiatives and increasing private investment, is expanding access to advanced medical technologies. The escalating prevalence of chronic diseases like cancer, cardiovascular conditions, and neurological disorders necessitates early and accurate diagnosis, boosting demand for sophisticated imaging solutions. Technological advancements, particularly in AI and image processing, are enhancing diagnostic capabilities and improving patient outcomes. Furthermore, an aging population across many APAC countries is contributing to a higher incidence of age-related illnesses, further fueling market expansion. The growing middle class and increasing health awareness are also significant contributors.
Challenges in the APAC Medical Imaging Devices Industry Sector
Despite robust growth, the APAC medical imaging devices sector faces several challenges. High procurement costs for advanced imaging systems can be a barrier, especially for smaller healthcare providers and in developing economies. Stringent and varied regulatory approvals across different countries create complexities and delays in market entry. Limited skilled personnel to operate and interpret complex imaging equipment in some regions pose a significant constraint. Supply chain disruptions, as witnessed globally, can impact the availability of critical components and finished products. Intense price competition from both global and local manufacturers can also pressure profit margins.
Emerging Opportunities in APAC Medical Imaging Devices Industry
Emerging opportunities in the APAC medical imaging devices industry lie in the expanding demand for portable and point-of-care imaging solutions, catering to remote areas and emergency services. The integration of Artificial Intelligence (AI) and machine learning for automated image analysis and diagnostic assistance presents a significant growth avenue. The increasing focus on preventative healthcare and early disease detection is driving demand for advanced screening tools. Furthermore, the development of cost-effective imaging technologies tailored for emerging markets and the growing interest in tele-radiology services offer substantial potential for market players.
Leading Players in the APAC Medical Imaging Devices Industry Market
- Esaote SpA
- Hologic Inc
- GE Healthcare
- Shanghai United Imaging Healthcare Co Ltd
- Koninklijke Philips N V
- Siemens AG
- FUJIFILM Holdings Corporation
- Carestream Health
- J Morita Corporation
- Canon Medical Systems Corporation
- Teknova Medical Systems Limited
- Shimadzu Corporation
Key Developments in APAC Medical Imaging Devices Industry Industry
- October 2022: Luxonus Inc. received approval to market its photoacoustic 3D imaging system in Japan.
- February 2022: Siemens Healthineers and Universal Medical Imaging have signed a strategic collaboration agreement to help primary healthcare facilities in China improve the accuracy of their image screening and disease diagnosis using cutting-edge imaging diagnostic tools and remote scanning assistant equipment from Siemens Healthineers and the local medical imaging experts at Universal Medical Imaging.
Future Outlook for APAC Medical Imaging Devices Industry Market
The future outlook for the APAC medical imaging devices industry is exceptionally bright, characterized by sustained growth accelerators and emerging strategic opportunities. The ongoing digital transformation in healthcare, coupled with increasing government investments in medical infrastructure, will continue to drive demand. The rapid adoption of AI and machine learning will further enhance the capabilities of imaging devices, leading to more precise and efficient diagnostics. The growing emphasis on personalized medicine and preventative care will also fuel the market for advanced and accessible imaging solutions. The untapped potential in emerging economies within APAC, combined with a growing health-conscious population, presents significant expansion opportunities for innovative and cost-effective medical imaging technologies, including low and mid-field MRI systems.
APAC Medical Imaging Devices Industry Segmentation
-
1. Modality
-
1.1. MRI
- 1.1.1. Low and mid field MRI systems (<1.5 T)
- 1.1.2. High field MRI systems (1.5-3 T)
- 1.1.3. Very Hig
-
1.2. Computed Tomography
- 1.2.1. Low End Scanners (~16-Slice)
- 1.2.2. Mid Range Scanners (~64-Slice)
- 1.2.3. High End Scanners (128-Slice and More)
-
1.3. Ultrasound
- 1.3.1. 2D Ultrasound
- 1.3.2. 3D Ultrasound
- 1.3.3. Other Types of Ultrasound
-
1.4. X-Ray
- 1.4.1. Analog Systems
- 1.4.2. Digital Systems
-
1.5. Nuclear Imaging
- 1.5.1. Positron Emission Tomography (PET)
- 1.5.2. Single Photon Emission Computed Tomography (SPECT)
- 1.6. Fluoroscopy
- 1.7. Mammography
-
1.1. MRI
-
2. Application
- 2.1. Cardiology
- 2.2. Oncology
- 2.3. Neurology
- 2.4. Orthopedics
- 2.5. Gastroenterology
- 2.6. Gynecology
- 2.7. Other Applications
-
3. End-User
- 3.1. Hospital
- 3.2. Diagnostic Centers
- 3.3. Other End-Users
-
4. Geography
- 4.1. China
- 4.2. Japan
- 4.3. India
- 4.4. Australia
- 4.5. South Korea
- 4.6. Rest of Asia-Pacific
APAC Medical Imaging Devices Industry Segmentation By Geography
- 1. China
- 2. Japan
- 3. India
- 4. Australia
- 5. South Korea
- 6. Rest of Asia Pacific
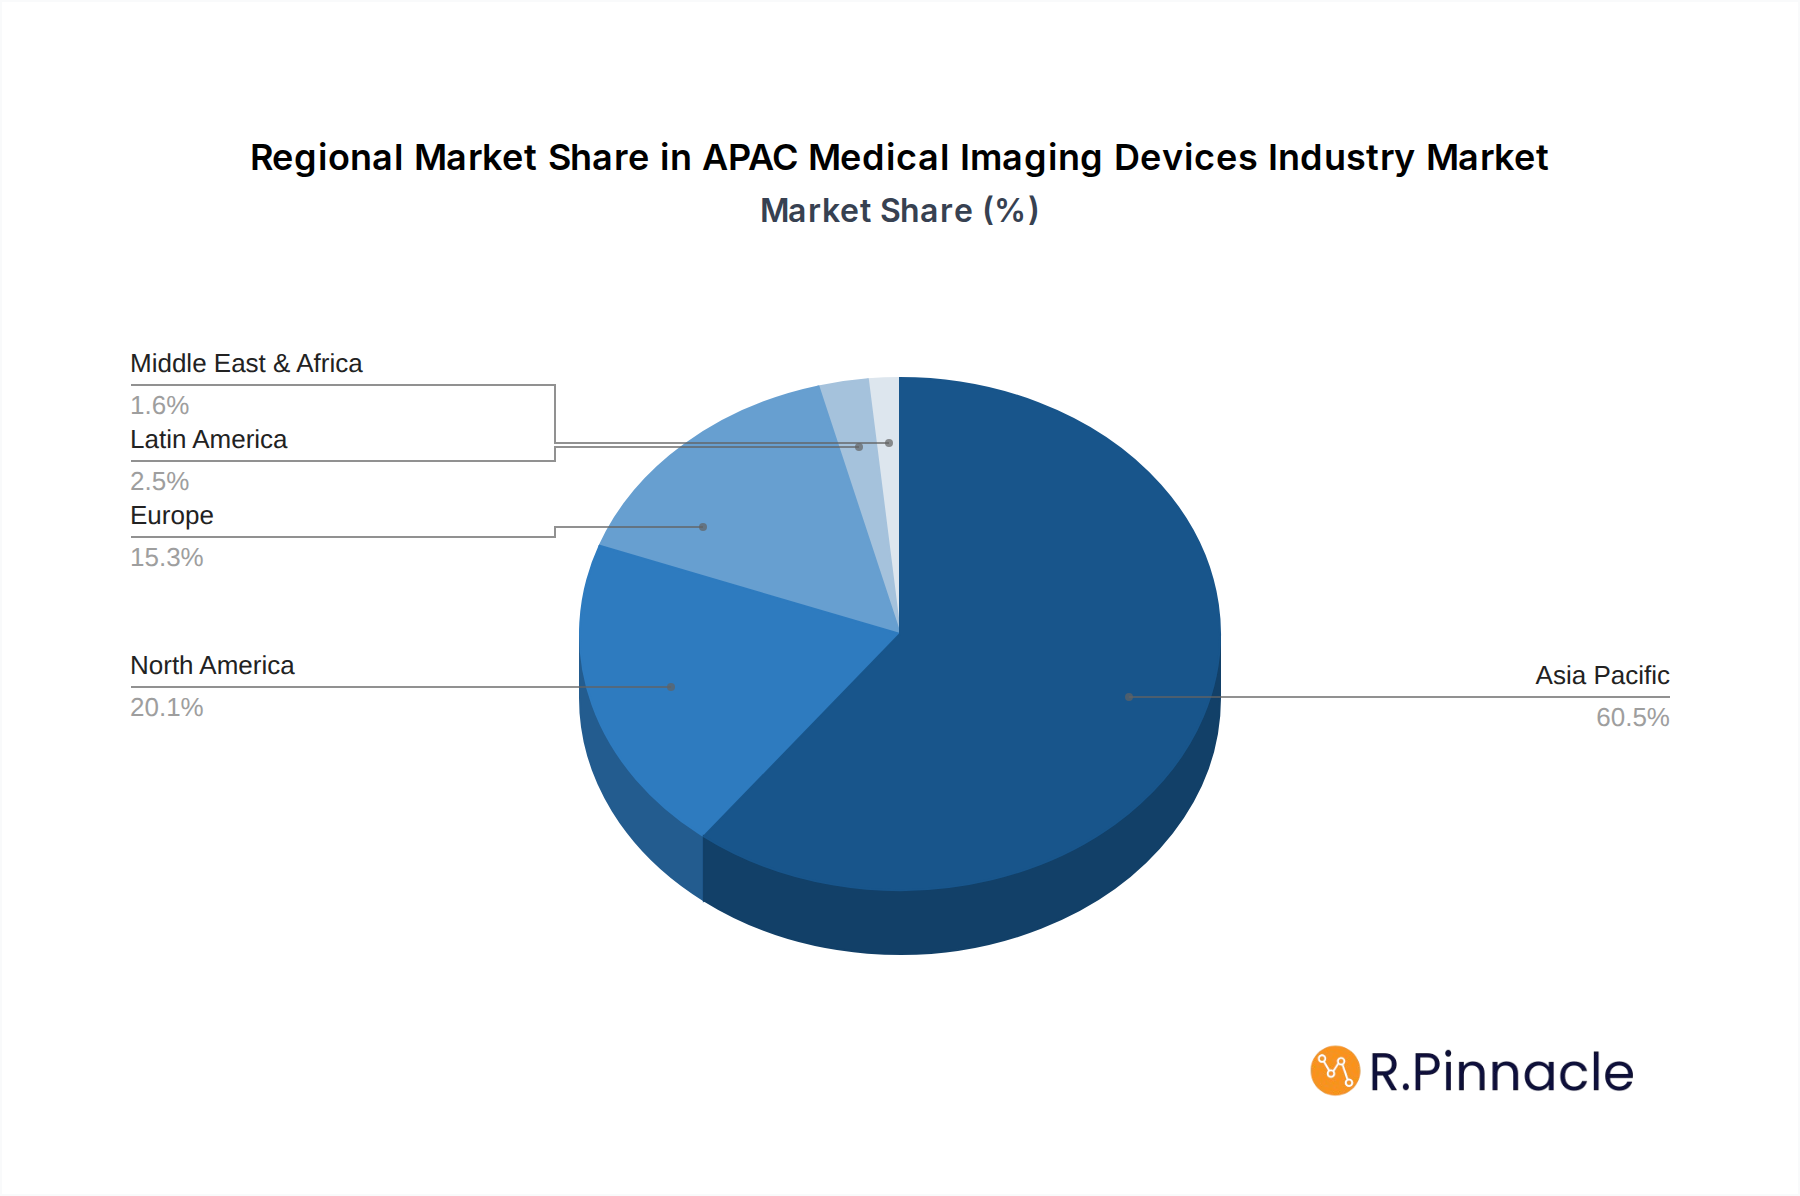
APAC Medical Imaging Devices Industry Regional Market Share
Geographic Coverage of APAC Medical Imaging Devices Industry
APAC Medical Imaging Devices Industry REPORT HIGHLIGHTS
| Aspects | Details |
|---|---|
| Study Period | 2020-2034 |
| Base Year | 2025 |
| Estimated Year | 2026 |
| Forecast Period | 2026-2034 |
| Historical Period | 2020-2025 |
| Growth Rate | CAGR of 8% from 2020-2034 |
| Segmentation |
|
Table of Contents
- 1. Introduction
- 1.1. Research Scope
- 1.2. Market Segmentation
- 1.3. Research Objective
- 1.4. Definitions and Assumptions
- 2. Executive Summary
- 2.1. Market Snapshot
- 3. Market Dynamics
- 3.1. Market Drivers
- 3.2. Market Restrains
- 3.3. Market Trends
- 3.4. Market Opportunities
- 4. Market Factor Analysis
- 4.1. Porters Five Forces
- 4.1.1. Bargaining Power of Suppliers
- 4.1.2. Bargaining Power of Buyers
- 4.1.3. Threat of New Entrants
- 4.1.4. Threat of Substitutes
- 4.1.5. Competitive Rivalry
- 4.2. PESTEL analysis
- 4.3. BCG Analysis
- 4.3.1. Stars (High Growth, High Market Share)
- 4.3.2. Cash Cows (Low Growth, High Market Share)
- 4.3.3. Question Mark (High Growth, Low Market Share)
- 4.3.4. Dogs (Low Growth, Low Market Share)
- 4.4. Ansoff Matrix Analysis
- 4.5. Supply Chain Analysis
- 4.6. Regulatory Landscape
- 4.7. Current Market Potential and Opportunity Assessment (TAM–SAM–SOM Framework)
- 4.8. PRI Analyst Note
- 4.1. Porters Five Forces
- 5. Market Analysis, Insights and Forecast 2021-2033
- 5.1. Market Analysis, Insights and Forecast - by Modality
- 5.1.1. MRI
- 5.1.1.1. Low and mid field MRI systems (<1.5 T)
- 5.1.1.2. High field MRI systems (1.5-3 T)
- 5.1.1.3. Very Hig
- 5.1.2. Computed Tomography
- 5.1.2.1. Low End Scanners (~16-Slice)
- 5.1.2.2. Mid Range Scanners (~64-Slice)
- 5.1.2.3. High End Scanners (128-Slice and More)
- 5.1.3. Ultrasound
- 5.1.3.1. 2D Ultrasound
- 5.1.3.2. 3D Ultrasound
- 5.1.3.3. Other Types of Ultrasound
- 5.1.4. X-Ray
- 5.1.4.1. Analog Systems
- 5.1.4.2. Digital Systems
- 5.1.5. Nuclear Imaging
- 5.1.5.1. Positron Emission Tomography (PET)
- 5.1.5.2. Single Photon Emission Computed Tomography (SPECT)
- 5.1.6. Fluoroscopy
- 5.1.7. Mammography
- 5.1.1. MRI
- 5.2. Market Analysis, Insights and Forecast - by Application
- 5.2.1. Cardiology
- 5.2.2. Oncology
- 5.2.3. Neurology
- 5.2.4. Orthopedics
- 5.2.5. Gastroenterology
- 5.2.6. Gynecology
- 5.2.7. Other Applications
- 5.3. Market Analysis, Insights and Forecast - by End-User
- 5.3.1. Hospital
- 5.3.2. Diagnostic Centers
- 5.3.3. Other End-Users
- 5.4. Market Analysis, Insights and Forecast - by Geography
- 5.4.1. China
- 5.4.2. Japan
- 5.4.3. India
- 5.4.4. Australia
- 5.4.5. South Korea
- 5.4.6. Rest of Asia-Pacific
- 5.5. Market Analysis, Insights and Forecast - by Region
- 5.5.1. China
- 5.5.2. Japan
- 5.5.3. India
- 5.5.4. Australia
- 5.5.5. South Korea
- 5.5.6. Rest of Asia Pacific
- 5.1. Market Analysis, Insights and Forecast - by Modality
- 6. Global APAC Medical Imaging Devices Industry Analysis, Insights and Forecast, 2021-2033
- 6.1. Market Analysis, Insights and Forecast - by Modality
- 6.1.1. MRI
- 6.1.1.1. Low and mid field MRI systems (<1.5 T)
- 6.1.1.2. High field MRI systems (1.5-3 T)
- 6.1.1.3. Very Hig
- 6.1.2. Computed Tomography
- 6.1.2.1. Low End Scanners (~16-Slice)
- 6.1.2.2. Mid Range Scanners (~64-Slice)
- 6.1.2.3. High End Scanners (128-Slice and More)
- 6.1.3. Ultrasound
- 6.1.3.1. 2D Ultrasound
- 6.1.3.2. 3D Ultrasound
- 6.1.3.3. Other Types of Ultrasound
- 6.1.4. X-Ray
- 6.1.4.1. Analog Systems
- 6.1.4.2. Digital Systems
- 6.1.5. Nuclear Imaging
- 6.1.5.1. Positron Emission Tomography (PET)
- 6.1.5.2. Single Photon Emission Computed Tomography (SPECT)
- 6.1.6. Fluoroscopy
- 6.1.7. Mammography
- 6.1.1. MRI
- 6.2. Market Analysis, Insights and Forecast - by Application
- 6.2.1. Cardiology
- 6.2.2. Oncology
- 6.2.3. Neurology
- 6.2.4. Orthopedics
- 6.2.5. Gastroenterology
- 6.2.6. Gynecology
- 6.2.7. Other Applications
- 6.3. Market Analysis, Insights and Forecast - by End-User
- 6.3.1. Hospital
- 6.3.2. Diagnostic Centers
- 6.3.3. Other End-Users
- 6.4. Market Analysis, Insights and Forecast - by Geography
- 6.4.1. China
- 6.4.2. Japan
- 6.4.3. India
- 6.4.4. Australia
- 6.4.5. South Korea
- 6.4.6. Rest of Asia-Pacific
- 6.1. Market Analysis, Insights and Forecast - by Modality
- 7. China APAC Medical Imaging Devices Industry Analysis, Insights and Forecast, 2020-2032
- 7.1. Market Analysis, Insights and Forecast - by Modality
- 7.1.1. MRI
- 7.1.1.1. Low and mid field MRI systems (<1.5 T)
- 7.1.1.2. High field MRI systems (1.5-3 T)
- 7.1.1.3. Very Hig
- 7.1.2. Computed Tomography
- 7.1.2.1. Low End Scanners (~16-Slice)
- 7.1.2.2. Mid Range Scanners (~64-Slice)
- 7.1.2.3. High End Scanners (128-Slice and More)
- 7.1.3. Ultrasound
- 7.1.3.1. 2D Ultrasound
- 7.1.3.2. 3D Ultrasound
- 7.1.3.3. Other Types of Ultrasound
- 7.1.4. X-Ray
- 7.1.4.1. Analog Systems
- 7.1.4.2. Digital Systems
- 7.1.5. Nuclear Imaging
- 7.1.5.1. Positron Emission Tomography (PET)
- 7.1.5.2. Single Photon Emission Computed Tomography (SPECT)
- 7.1.6. Fluoroscopy
- 7.1.7. Mammography
- 7.1.1. MRI
- 7.2. Market Analysis, Insights and Forecast - by Application
- 7.2.1. Cardiology
- 7.2.2. Oncology
- 7.2.3. Neurology
- 7.2.4. Orthopedics
- 7.2.5. Gastroenterology
- 7.2.6. Gynecology
- 7.2.7. Other Applications
- 7.3. Market Analysis, Insights and Forecast - by End-User
- 7.3.1. Hospital
- 7.3.2. Diagnostic Centers
- 7.3.3. Other End-Users
- 7.4. Market Analysis, Insights and Forecast - by Geography
- 7.4.1. China
- 7.4.2. Japan
- 7.4.3. India
- 7.4.4. Australia
- 7.4.5. South Korea
- 7.4.6. Rest of Asia-Pacific
- 7.1. Market Analysis, Insights and Forecast - by Modality
- 8. Japan APAC Medical Imaging Devices Industry Analysis, Insights and Forecast, 2020-2032
- 8.1. Market Analysis, Insights and Forecast - by Modality
- 8.1.1. MRI
- 8.1.1.1. Low and mid field MRI systems (<1.5 T)
- 8.1.1.2. High field MRI systems (1.5-3 T)
- 8.1.1.3. Very Hig
- 8.1.2. Computed Tomography
- 8.1.2.1. Low End Scanners (~16-Slice)
- 8.1.2.2. Mid Range Scanners (~64-Slice)
- 8.1.2.3. High End Scanners (128-Slice and More)
- 8.1.3. Ultrasound
- 8.1.3.1. 2D Ultrasound
- 8.1.3.2. 3D Ultrasound
- 8.1.3.3. Other Types of Ultrasound
- 8.1.4. X-Ray
- 8.1.4.1. Analog Systems
- 8.1.4.2. Digital Systems
- 8.1.5. Nuclear Imaging
- 8.1.5.1. Positron Emission Tomography (PET)
- 8.1.5.2. Single Photon Emission Computed Tomography (SPECT)
- 8.1.6. Fluoroscopy
- 8.1.7. Mammography
- 8.1.1. MRI
- 8.2. Market Analysis, Insights and Forecast - by Application
- 8.2.1. Cardiology
- 8.2.2. Oncology
- 8.2.3. Neurology
- 8.2.4. Orthopedics
- 8.2.5. Gastroenterology
- 8.2.6. Gynecology
- 8.2.7. Other Applications
- 8.3. Market Analysis, Insights and Forecast - by End-User
- 8.3.1. Hospital
- 8.3.2. Diagnostic Centers
- 8.3.3. Other End-Users
- 8.4. Market Analysis, Insights and Forecast - by Geography
- 8.4.1. China
- 8.4.2. Japan
- 8.4.3. India
- 8.4.4. Australia
- 8.4.5. South Korea
- 8.4.6. Rest of Asia-Pacific
- 8.1. Market Analysis, Insights and Forecast - by Modality
- 9. India APAC Medical Imaging Devices Industry Analysis, Insights and Forecast, 2020-2032
- 9.1. Market Analysis, Insights and Forecast - by Modality
- 9.1.1. MRI
- 9.1.1.1. Low and mid field MRI systems (<1.5 T)
- 9.1.1.2. High field MRI systems (1.5-3 T)
- 9.1.1.3. Very Hig
- 9.1.2. Computed Tomography
- 9.1.2.1. Low End Scanners (~16-Slice)
- 9.1.2.2. Mid Range Scanners (~64-Slice)
- 9.1.2.3. High End Scanners (128-Slice and More)
- 9.1.3. Ultrasound
- 9.1.3.1. 2D Ultrasound
- 9.1.3.2. 3D Ultrasound
- 9.1.3.3. Other Types of Ultrasound
- 9.1.4. X-Ray
- 9.1.4.1. Analog Systems
- 9.1.4.2. Digital Systems
- 9.1.5. Nuclear Imaging
- 9.1.5.1. Positron Emission Tomography (PET)
- 9.1.5.2. Single Photon Emission Computed Tomography (SPECT)
- 9.1.6. Fluoroscopy
- 9.1.7. Mammography
- 9.1.1. MRI
- 9.2. Market Analysis, Insights and Forecast - by Application
- 9.2.1. Cardiology
- 9.2.2. Oncology
- 9.2.3. Neurology
- 9.2.4. Orthopedics
- 9.2.5. Gastroenterology
- 9.2.6. Gynecology
- 9.2.7. Other Applications
- 9.3. Market Analysis, Insights and Forecast - by End-User
- 9.3.1. Hospital
- 9.3.2. Diagnostic Centers
- 9.3.3. Other End-Users
- 9.4. Market Analysis, Insights and Forecast - by Geography
- 9.4.1. China
- 9.4.2. Japan
- 9.4.3. India
- 9.4.4. Australia
- 9.4.5. South Korea
- 9.4.6. Rest of Asia-Pacific
- 9.1. Market Analysis, Insights and Forecast - by Modality
- 10. Australia APAC Medical Imaging Devices Industry Analysis, Insights and Forecast, 2020-2032
- 10.1. Market Analysis, Insights and Forecast - by Modality
- 10.1.1. MRI
- 10.1.1.1. Low and mid field MRI systems (<1.5 T)
- 10.1.1.2. High field MRI systems (1.5-3 T)
- 10.1.1.3. Very Hig
- 10.1.2. Computed Tomography
- 10.1.2.1. Low End Scanners (~16-Slice)
- 10.1.2.2. Mid Range Scanners (~64-Slice)
- 10.1.2.3. High End Scanners (128-Slice and More)
- 10.1.3. Ultrasound
- 10.1.3.1. 2D Ultrasound
- 10.1.3.2. 3D Ultrasound
- 10.1.3.3. Other Types of Ultrasound
- 10.1.4. X-Ray
- 10.1.4.1. Analog Systems
- 10.1.4.2. Digital Systems
- 10.1.5. Nuclear Imaging
- 10.1.5.1. Positron Emission Tomography (PET)
- 10.1.5.2. Single Photon Emission Computed Tomography (SPECT)
- 10.1.6. Fluoroscopy
- 10.1.7. Mammography
- 10.1.1. MRI
- 10.2. Market Analysis, Insights and Forecast - by Application
- 10.2.1. Cardiology
- 10.2.2. Oncology
- 10.2.3. Neurology
- 10.2.4. Orthopedics
- 10.2.5. Gastroenterology
- 10.2.6. Gynecology
- 10.2.7. Other Applications
- 10.3. Market Analysis, Insights and Forecast - by End-User
- 10.3.1. Hospital
- 10.3.2. Diagnostic Centers
- 10.3.3. Other End-Users
- 10.4. Market Analysis, Insights and Forecast - by Geography
- 10.4.1. China
- 10.4.2. Japan
- 10.4.3. India
- 10.4.4. Australia
- 10.4.5. South Korea
- 10.4.6. Rest of Asia-Pacific
- 10.1. Market Analysis, Insights and Forecast - by Modality
- 11. South Korea APAC Medical Imaging Devices Industry Analysis, Insights and Forecast, 2020-2032
- 11.1. Market Analysis, Insights and Forecast - by Modality
- 11.1.1. MRI
- 11.1.1.1. Low and mid field MRI systems (<1.5 T)
- 11.1.1.2. High field MRI systems (1.5-3 T)
- 11.1.1.3. Very Hig
- 11.1.2. Computed Tomography
- 11.1.2.1. Low End Scanners (~16-Slice)
- 11.1.2.2. Mid Range Scanners (~64-Slice)
- 11.1.2.3. High End Scanners (128-Slice and More)
- 11.1.3. Ultrasound
- 11.1.3.1. 2D Ultrasound
- 11.1.3.2. 3D Ultrasound
- 11.1.3.3. Other Types of Ultrasound
- 11.1.4. X-Ray
- 11.1.4.1. Analog Systems
- 11.1.4.2. Digital Systems
- 11.1.5. Nuclear Imaging
- 11.1.5.1. Positron Emission Tomography (PET)
- 11.1.5.2. Single Photon Emission Computed Tomography (SPECT)
- 11.1.6. Fluoroscopy
- 11.1.7. Mammography
- 11.1.1. MRI
- 11.2. Market Analysis, Insights and Forecast - by Application
- 11.2.1. Cardiology
- 11.2.2. Oncology
- 11.2.3. Neurology
- 11.2.4. Orthopedics
- 11.2.5. Gastroenterology
- 11.2.6. Gynecology
- 11.2.7. Other Applications
- 11.3. Market Analysis, Insights and Forecast - by End-User
- 11.3.1. Hospital
- 11.3.2. Diagnostic Centers
- 11.3.3. Other End-Users
- 11.4. Market Analysis, Insights and Forecast - by Geography
- 11.4.1. China
- 11.4.2. Japan
- 11.4.3. India
- 11.4.4. Australia
- 11.4.5. South Korea
- 11.4.6. Rest of Asia-Pacific
- 11.1. Market Analysis, Insights and Forecast - by Modality
- 12. Rest of Asia Pacific APAC Medical Imaging Devices Industry Analysis, Insights and Forecast, 2020-2032
- 12.1. Market Analysis, Insights and Forecast - by Modality
- 12.1.1. MRI
- 12.1.1.1. Low and mid field MRI systems (<1.5 T)
- 12.1.1.2. High field MRI systems (1.5-3 T)
- 12.1.1.3. Very Hig
- 12.1.2. Computed Tomography
- 12.1.2.1. Low End Scanners (~16-Slice)
- 12.1.2.2. Mid Range Scanners (~64-Slice)
- 12.1.2.3. High End Scanners (128-Slice and More)
- 12.1.3. Ultrasound
- 12.1.3.1. 2D Ultrasound
- 12.1.3.2. 3D Ultrasound
- 12.1.3.3. Other Types of Ultrasound
- 12.1.4. X-Ray
- 12.1.4.1. Analog Systems
- 12.1.4.2. Digital Systems
- 12.1.5. Nuclear Imaging
- 12.1.5.1. Positron Emission Tomography (PET)
- 12.1.5.2. Single Photon Emission Computed Tomography (SPECT)
- 12.1.6. Fluoroscopy
- 12.1.7. Mammography
- 12.1.1. MRI
- 12.2. Market Analysis, Insights and Forecast - by Application
- 12.2.1. Cardiology
- 12.2.2. Oncology
- 12.2.3. Neurology
- 12.2.4. Orthopedics
- 12.2.5. Gastroenterology
- 12.2.6. Gynecology
- 12.2.7. Other Applications
- 12.3. Market Analysis, Insights and Forecast - by End-User
- 12.3.1. Hospital
- 12.3.2. Diagnostic Centers
- 12.3.3. Other End-Users
- 12.4. Market Analysis, Insights and Forecast - by Geography
- 12.4.1. China
- 12.4.2. Japan
- 12.4.3. India
- 12.4.4. Australia
- 12.4.5. South Korea
- 12.4.6. Rest of Asia-Pacific
- 12.1. Market Analysis, Insights and Forecast - by Modality
- 13. Competitive Analysis
- 13.1. Company Profiles
- 13.1.1 Esaote SpA
- 13.1.1.1. Company Overview
- 13.1.1.2. Products
- 13.1.1.3. Company Financials
- 13.1.1.4. SWOT Analysis
- 13.1.2 Hologic Inc
- 13.1.2.1. Company Overview
- 13.1.2.2. Products
- 13.1.2.3. Company Financials
- 13.1.2.4. SWOT Analysis
- 13.1.3 GE Healthcare
- 13.1.3.1. Company Overview
- 13.1.3.2. Products
- 13.1.3.3. Company Financials
- 13.1.3.4. SWOT Analysis
- 13.1.4 Shanghai United Imaging Healthcare Co Ltd
- 13.1.4.1. Company Overview
- 13.1.4.2. Products
- 13.1.4.3. Company Financials
- 13.1.4.4. SWOT Analysis
- 13.1.5 Koninklijke Philips N V
- 13.1.5.1. Company Overview
- 13.1.5.2. Products
- 13.1.5.3. Company Financials
- 13.1.5.4. SWOT Analysis
- 13.1.6 Siemens AG
- 13.1.6.1. Company Overview
- 13.1.6.2. Products
- 13.1.6.3. Company Financials
- 13.1.6.4. SWOT Analysis
- 13.1.7 FUJIFILM Holdings Corporation
- 13.1.7.1. Company Overview
- 13.1.7.2. Products
- 13.1.7.3. Company Financials
- 13.1.7.4. SWOT Analysis
- 13.1.8 Carestream Health
- 13.1.8.1. Company Overview
- 13.1.8.2. Products
- 13.1.8.3. Company Financials
- 13.1.8.4. SWOT Analysis
- 13.1.9 J Morita Corporation
- 13.1.9.1. Company Overview
- 13.1.9.2. Products
- 13.1.9.3. Company Financials
- 13.1.9.4. SWOT Analysis
- 13.1.10 Canon Medical Systems Corporation
- 13.1.10.1. Company Overview
- 13.1.10.2. Products
- 13.1.10.3. Company Financials
- 13.1.10.4. SWOT Analysis
- 13.1.11 Teknova Medical Systems Limited
- 13.1.11.1. Company Overview
- 13.1.11.2. Products
- 13.1.11.3. Company Financials
- 13.1.11.4. SWOT Analysis
- 13.1.12 Shimadzu Corporation
- 13.1.12.1. Company Overview
- 13.1.12.2. Products
- 13.1.12.3. Company Financials
- 13.1.12.4. SWOT Analysis
- 13.1.1 Esaote SpA
- 13.2. Market Entropy
- 13.2.1 Company's Key Areas Served
- 13.2.2 Recent Developments
- 13.3. Company Market Share Analysis 2025
- 13.3.1 Top 5 Companies Market Share Analysis
- 13.3.2 Top 3 Companies Market Share Analysis
- 13.4. List of Potential Customers
- 14. Research Methodology
List of Figures
- Figure 1: Global APAC Medical Imaging Devices Industry Revenue Breakdown (billion, %) by Region 2025 & 2033
- Figure 2: Global APAC Medical Imaging Devices Industry Volume Breakdown (K Unit, %) by Region 2025 & 2033
- Figure 3: China APAC Medical Imaging Devices Industry Revenue (billion), by Modality 2025 & 2033
- Figure 4: China APAC Medical Imaging Devices Industry Volume (K Unit), by Modality 2025 & 2033
- Figure 5: China APAC Medical Imaging Devices Industry Revenue Share (%), by Modality 2025 & 2033
- Figure 6: China APAC Medical Imaging Devices Industry Volume Share (%), by Modality 2025 & 2033
- Figure 7: China APAC Medical Imaging Devices Industry Revenue (billion), by Application 2025 & 2033
- Figure 8: China APAC Medical Imaging Devices Industry Volume (K Unit), by Application 2025 & 2033
- Figure 9: China APAC Medical Imaging Devices Industry Revenue Share (%), by Application 2025 & 2033
- Figure 10: China APAC Medical Imaging Devices Industry Volume Share (%), by Application 2025 & 2033
- Figure 11: China APAC Medical Imaging Devices Industry Revenue (billion), by End-User 2025 & 2033
- Figure 12: China APAC Medical Imaging Devices Industry Volume (K Unit), by End-User 2025 & 2033
- Figure 13: China APAC Medical Imaging Devices Industry Revenue Share (%), by End-User 2025 & 2033
- Figure 14: China APAC Medical Imaging Devices Industry Volume Share (%), by End-User 2025 & 2033
- Figure 15: China APAC Medical Imaging Devices Industry Revenue (billion), by Geography 2025 & 2033
- Figure 16: China APAC Medical Imaging Devices Industry Volume (K Unit), by Geography 2025 & 2033
- Figure 17: China APAC Medical Imaging Devices Industry Revenue Share (%), by Geography 2025 & 2033
- Figure 18: China APAC Medical Imaging Devices Industry Volume Share (%), by Geography 2025 & 2033
- Figure 19: China APAC Medical Imaging Devices Industry Revenue (billion), by Country 2025 & 2033
- Figure 20: China APAC Medical Imaging Devices Industry Volume (K Unit), by Country 2025 & 2033
- Figure 21: China APAC Medical Imaging Devices Industry Revenue Share (%), by Country 2025 & 2033
- Figure 22: China APAC Medical Imaging Devices Industry Volume Share (%), by Country 2025 & 2033
- Figure 23: Japan APAC Medical Imaging Devices Industry Revenue (billion), by Modality 2025 & 2033
- Figure 24: Japan APAC Medical Imaging Devices Industry Volume (K Unit), by Modality 2025 & 2033
- Figure 25: Japan APAC Medical Imaging Devices Industry Revenue Share (%), by Modality 2025 & 2033
- Figure 26: Japan APAC Medical Imaging Devices Industry Volume Share (%), by Modality 2025 & 2033
- Figure 27: Japan APAC Medical Imaging Devices Industry Revenue (billion), by Application 2025 & 2033
- Figure 28: Japan APAC Medical Imaging Devices Industry Volume (K Unit), by Application 2025 & 2033
- Figure 29: Japan APAC Medical Imaging Devices Industry Revenue Share (%), by Application 2025 & 2033
- Figure 30: Japan APAC Medical Imaging Devices Industry Volume Share (%), by Application 2025 & 2033
- Figure 31: Japan APAC Medical Imaging Devices Industry Revenue (billion), by End-User 2025 & 2033
- Figure 32: Japan APAC Medical Imaging Devices Industry Volume (K Unit), by End-User 2025 & 2033
- Figure 33: Japan APAC Medical Imaging Devices Industry Revenue Share (%), by End-User 2025 & 2033
- Figure 34: Japan APAC Medical Imaging Devices Industry Volume Share (%), by End-User 2025 & 2033
- Figure 35: Japan APAC Medical Imaging Devices Industry Revenue (billion), by Geography 2025 & 2033
- Figure 36: Japan APAC Medical Imaging Devices Industry Volume (K Unit), by Geography 2025 & 2033
- Figure 37: Japan APAC Medical Imaging Devices Industry Revenue Share (%), by Geography 2025 & 2033
- Figure 38: Japan APAC Medical Imaging Devices Industry Volume Share (%), by Geography 2025 & 2033
- Figure 39: Japan APAC Medical Imaging Devices Industry Revenue (billion), by Country 2025 & 2033
- Figure 40: Japan APAC Medical Imaging Devices Industry Volume (K Unit), by Country 2025 & 2033
- Figure 41: Japan APAC Medical Imaging Devices Industry Revenue Share (%), by Country 2025 & 2033
- Figure 42: Japan APAC Medical Imaging Devices Industry Volume Share (%), by Country 2025 & 2033
- Figure 43: India APAC Medical Imaging Devices Industry Revenue (billion), by Modality 2025 & 2033
- Figure 44: India APAC Medical Imaging Devices Industry Volume (K Unit), by Modality 2025 & 2033
- Figure 45: India APAC Medical Imaging Devices Industry Revenue Share (%), by Modality 2025 & 2033
- Figure 46: India APAC Medical Imaging Devices Industry Volume Share (%), by Modality 2025 & 2033
- Figure 47: India APAC Medical Imaging Devices Industry Revenue (billion), by Application 2025 & 2033
- Figure 48: India APAC Medical Imaging Devices Industry Volume (K Unit), by Application 2025 & 2033
- Figure 49: India APAC Medical Imaging Devices Industry Revenue Share (%), by Application 2025 & 2033
- Figure 50: India APAC Medical Imaging Devices Industry Volume Share (%), by Application 2025 & 2033
- Figure 51: India APAC Medical Imaging Devices Industry Revenue (billion), by End-User 2025 & 2033
- Figure 52: India APAC Medical Imaging Devices Industry Volume (K Unit), by End-User 2025 & 2033
- Figure 53: India APAC Medical Imaging Devices Industry Revenue Share (%), by End-User 2025 & 2033
- Figure 54: India APAC Medical Imaging Devices Industry Volume Share (%), by End-User 2025 & 2033
- Figure 55: India APAC Medical Imaging Devices Industry Revenue (billion), by Geography 2025 & 2033
- Figure 56: India APAC Medical Imaging Devices Industry Volume (K Unit), by Geography 2025 & 2033
- Figure 57: India APAC Medical Imaging Devices Industry Revenue Share (%), by Geography 2025 & 2033
- Figure 58: India APAC Medical Imaging Devices Industry Volume Share (%), by Geography 2025 & 2033
- Figure 59: India APAC Medical Imaging Devices Industry Revenue (billion), by Country 2025 & 2033
- Figure 60: India APAC Medical Imaging Devices Industry Volume (K Unit), by Country 2025 & 2033
- Figure 61: India APAC Medical Imaging Devices Industry Revenue Share (%), by Country 2025 & 2033
- Figure 62: India APAC Medical Imaging Devices Industry Volume Share (%), by Country 2025 & 2033
- Figure 63: Australia APAC Medical Imaging Devices Industry Revenue (billion), by Modality 2025 & 2033
- Figure 64: Australia APAC Medical Imaging Devices Industry Volume (K Unit), by Modality 2025 & 2033
- Figure 65: Australia APAC Medical Imaging Devices Industry Revenue Share (%), by Modality 2025 & 2033
- Figure 66: Australia APAC Medical Imaging Devices Industry Volume Share (%), by Modality 2025 & 2033
- Figure 67: Australia APAC Medical Imaging Devices Industry Revenue (billion), by Application 2025 & 2033
- Figure 68: Australia APAC Medical Imaging Devices Industry Volume (K Unit), by Application 2025 & 2033
- Figure 69: Australia APAC Medical Imaging Devices Industry Revenue Share (%), by Application 2025 & 2033
- Figure 70: Australia APAC Medical Imaging Devices Industry Volume Share (%), by Application 2025 & 2033
- Figure 71: Australia APAC Medical Imaging Devices Industry Revenue (billion), by End-User 2025 & 2033
- Figure 72: Australia APAC Medical Imaging Devices Industry Volume (K Unit), by End-User 2025 & 2033
- Figure 73: Australia APAC Medical Imaging Devices Industry Revenue Share (%), by End-User 2025 & 2033
- Figure 74: Australia APAC Medical Imaging Devices Industry Volume Share (%), by End-User 2025 & 2033
- Figure 75: Australia APAC Medical Imaging Devices Industry Revenue (billion), by Geography 2025 & 2033
- Figure 76: Australia APAC Medical Imaging Devices Industry Volume (K Unit), by Geography 2025 & 2033
- Figure 77: Australia APAC Medical Imaging Devices Industry Revenue Share (%), by Geography 2025 & 2033
- Figure 78: Australia APAC Medical Imaging Devices Industry Volume Share (%), by Geography 2025 & 2033
- Figure 79: Australia APAC Medical Imaging Devices Industry Revenue (billion), by Country 2025 & 2033
- Figure 80: Australia APAC Medical Imaging Devices Industry Volume (K Unit), by Country 2025 & 2033
- Figure 81: Australia APAC Medical Imaging Devices Industry Revenue Share (%), by Country 2025 & 2033
- Figure 82: Australia APAC Medical Imaging Devices Industry Volume Share (%), by Country 2025 & 2033
- Figure 83: South Korea APAC Medical Imaging Devices Industry Revenue (billion), by Modality 2025 & 2033
- Figure 84: South Korea APAC Medical Imaging Devices Industry Volume (K Unit), by Modality 2025 & 2033
- Figure 85: South Korea APAC Medical Imaging Devices Industry Revenue Share (%), by Modality 2025 & 2033
- Figure 86: South Korea APAC Medical Imaging Devices Industry Volume Share (%), by Modality 2025 & 2033
- Figure 87: South Korea APAC Medical Imaging Devices Industry Revenue (billion), by Application 2025 & 2033
- Figure 88: South Korea APAC Medical Imaging Devices Industry Volume (K Unit), by Application 2025 & 2033
- Figure 89: South Korea APAC Medical Imaging Devices Industry Revenue Share (%), by Application 2025 & 2033
- Figure 90: South Korea APAC Medical Imaging Devices Industry Volume Share (%), by Application 2025 & 2033
- Figure 91: South Korea APAC Medical Imaging Devices Industry Revenue (billion), by End-User 2025 & 2033
- Figure 92: South Korea APAC Medical Imaging Devices Industry Volume (K Unit), by End-User 2025 & 2033
- Figure 93: South Korea APAC Medical Imaging Devices Industry Revenue Share (%), by End-User 2025 & 2033
- Figure 94: South Korea APAC Medical Imaging Devices Industry Volume Share (%), by End-User 2025 & 2033
- Figure 95: South Korea APAC Medical Imaging Devices Industry Revenue (billion), by Geography 2025 & 2033
- Figure 96: South Korea APAC Medical Imaging Devices Industry Volume (K Unit), by Geography 2025 & 2033
- Figure 97: South Korea APAC Medical Imaging Devices Industry Revenue Share (%), by Geography 2025 & 2033
- Figure 98: South Korea APAC Medical Imaging Devices Industry Volume Share (%), by Geography 2025 & 2033
- Figure 99: South Korea APAC Medical Imaging Devices Industry Revenue (billion), by Country 2025 & 2033
- Figure 100: South Korea APAC Medical Imaging Devices Industry Volume (K Unit), by Country 2025 & 2033
- Figure 101: South Korea APAC Medical Imaging Devices Industry Revenue Share (%), by Country 2025 & 2033
- Figure 102: South Korea APAC Medical Imaging Devices Industry Volume Share (%), by Country 2025 & 2033
- Figure 103: Rest of Asia Pacific APAC Medical Imaging Devices Industry Revenue (billion), by Modality 2025 & 2033
- Figure 104: Rest of Asia Pacific APAC Medical Imaging Devices Industry Volume (K Unit), by Modality 2025 & 2033
- Figure 105: Rest of Asia Pacific APAC Medical Imaging Devices Industry Revenue Share (%), by Modality 2025 & 2033
- Figure 106: Rest of Asia Pacific APAC Medical Imaging Devices Industry Volume Share (%), by Modality 2025 & 2033
- Figure 107: Rest of Asia Pacific APAC Medical Imaging Devices Industry Revenue (billion), by Application 2025 & 2033
- Figure 108: Rest of Asia Pacific APAC Medical Imaging Devices Industry Volume (K Unit), by Application 2025 & 2033
- Figure 109: Rest of Asia Pacific APAC Medical Imaging Devices Industry Revenue Share (%), by Application 2025 & 2033
- Figure 110: Rest of Asia Pacific APAC Medical Imaging Devices Industry Volume Share (%), by Application 2025 & 2033
- Figure 111: Rest of Asia Pacific APAC Medical Imaging Devices Industry Revenue (billion), by End-User 2025 & 2033
- Figure 112: Rest of Asia Pacific APAC Medical Imaging Devices Industry Volume (K Unit), by End-User 2025 & 2033
- Figure 113: Rest of Asia Pacific APAC Medical Imaging Devices Industry Revenue Share (%), by End-User 2025 & 2033
- Figure 114: Rest of Asia Pacific APAC Medical Imaging Devices Industry Volume Share (%), by End-User 2025 & 2033
- Figure 115: Rest of Asia Pacific APAC Medical Imaging Devices Industry Revenue (billion), by Geography 2025 & 2033
- Figure 116: Rest of Asia Pacific APAC Medical Imaging Devices Industry Volume (K Unit), by Geography 2025 & 2033
- Figure 117: Rest of Asia Pacific APAC Medical Imaging Devices Industry Revenue Share (%), by Geography 2025 & 2033
- Figure 118: Rest of Asia Pacific APAC Medical Imaging Devices Industry Volume Share (%), by Geography 2025 & 2033
- Figure 119: Rest of Asia Pacific APAC Medical Imaging Devices Industry Revenue (billion), by Country 2025 & 2033
- Figure 120: Rest of Asia Pacific APAC Medical Imaging Devices Industry Volume (K Unit), by Country 2025 & 2033
- Figure 121: Rest of Asia Pacific APAC Medical Imaging Devices Industry Revenue Share (%), by Country 2025 & 2033
- Figure 122: Rest of Asia Pacific APAC Medical Imaging Devices Industry Volume Share (%), by Country 2025 & 2033
List of Tables
- Table 1: Global APAC Medical Imaging Devices Industry Revenue billion Forecast, by Modality 2020 & 2033
- Table 2: Global APAC Medical Imaging Devices Industry Volume K Unit Forecast, by Modality 2020 & 2033
- Table 3: Global APAC Medical Imaging Devices Industry Revenue billion Forecast, by Application 2020 & 2033
- Table 4: Global APAC Medical Imaging Devices Industry Volume K Unit Forecast, by Application 2020 & 2033
- Table 5: Global APAC Medical Imaging Devices Industry Revenue billion Forecast, by End-User 2020 & 2033
- Table 6: Global APAC Medical Imaging Devices Industry Volume K Unit Forecast, by End-User 2020 & 2033
- Table 7: Global APAC Medical Imaging Devices Industry Revenue billion Forecast, by Geography 2020 & 2033
- Table 8: Global APAC Medical Imaging Devices Industry Volume K Unit Forecast, by Geography 2020 & 2033
- Table 9: Global APAC Medical Imaging Devices Industry Revenue billion Forecast, by Region 2020 & 2033
- Table 10: Global APAC Medical Imaging Devices Industry Volume K Unit Forecast, by Region 2020 & 2033
- Table 11: Global APAC Medical Imaging Devices Industry Revenue billion Forecast, by Modality 2020 & 2033
- Table 12: Global APAC Medical Imaging Devices Industry Volume K Unit Forecast, by Modality 2020 & 2033
- Table 13: Global APAC Medical Imaging Devices Industry Revenue billion Forecast, by Application 2020 & 2033
- Table 14: Global APAC Medical Imaging Devices Industry Volume K Unit Forecast, by Application 2020 & 2033
- Table 15: Global APAC Medical Imaging Devices Industry Revenue billion Forecast, by End-User 2020 & 2033
- Table 16: Global APAC Medical Imaging Devices Industry Volume K Unit Forecast, by End-User 2020 & 2033
- Table 17: Global APAC Medical Imaging Devices Industry Revenue billion Forecast, by Geography 2020 & 2033
- Table 18: Global APAC Medical Imaging Devices Industry Volume K Unit Forecast, by Geography 2020 & 2033
- Table 19: Global APAC Medical Imaging Devices Industry Revenue billion Forecast, by Country 2020 & 2033
- Table 20: Global APAC Medical Imaging Devices Industry Volume K Unit Forecast, by Country 2020 & 2033
- Table 21: Global APAC Medical Imaging Devices Industry Revenue billion Forecast, by Modality 2020 & 2033
- Table 22: Global APAC Medical Imaging Devices Industry Volume K Unit Forecast, by Modality 2020 & 2033
- Table 23: Global APAC Medical Imaging Devices Industry Revenue billion Forecast, by Application 2020 & 2033
- Table 24: Global APAC Medical Imaging Devices Industry Volume K Unit Forecast, by Application 2020 & 2033
- Table 25: Global APAC Medical Imaging Devices Industry Revenue billion Forecast, by End-User 2020 & 2033
- Table 26: Global APAC Medical Imaging Devices Industry Volume K Unit Forecast, by End-User 2020 & 2033
- Table 27: Global APAC Medical Imaging Devices Industry Revenue billion Forecast, by Geography 2020 & 2033
- Table 28: Global APAC Medical Imaging Devices Industry Volume K Unit Forecast, by Geography 2020 & 2033
- Table 29: Global APAC Medical Imaging Devices Industry Revenue billion Forecast, by Country 2020 & 2033
- Table 30: Global APAC Medical Imaging Devices Industry Volume K Unit Forecast, by Country 2020 & 2033
- Table 31: Global APAC Medical Imaging Devices Industry Revenue billion Forecast, by Modality 2020 & 2033
- Table 32: Global APAC Medical Imaging Devices Industry Volume K Unit Forecast, by Modality 2020 & 2033
- Table 33: Global APAC Medical Imaging Devices Industry Revenue billion Forecast, by Application 2020 & 2033
- Table 34: Global APAC Medical Imaging Devices Industry Volume K Unit Forecast, by Application 2020 & 2033
- Table 35: Global APAC Medical Imaging Devices Industry Revenue billion Forecast, by End-User 2020 & 2033
- Table 36: Global APAC Medical Imaging Devices Industry Volume K Unit Forecast, by End-User 2020 & 2033
- Table 37: Global APAC Medical Imaging Devices Industry Revenue billion Forecast, by Geography 2020 & 2033
- Table 38: Global APAC Medical Imaging Devices Industry Volume K Unit Forecast, by Geography 2020 & 2033
- Table 39: Global APAC Medical Imaging Devices Industry Revenue billion Forecast, by Country 2020 & 2033
- Table 40: Global APAC Medical Imaging Devices Industry Volume K Unit Forecast, by Country 2020 & 2033
- Table 41: Global APAC Medical Imaging Devices Industry Revenue billion Forecast, by Modality 2020 & 2033
- Table 42: Global APAC Medical Imaging Devices Industry Volume K Unit Forecast, by Modality 2020 & 2033
- Table 43: Global APAC Medical Imaging Devices Industry Revenue billion Forecast, by Application 2020 & 2033
- Table 44: Global APAC Medical Imaging Devices Industry Volume K Unit Forecast, by Application 2020 & 2033
- Table 45: Global APAC Medical Imaging Devices Industry Revenue billion Forecast, by End-User 2020 & 2033
- Table 46: Global APAC Medical Imaging Devices Industry Volume K Unit Forecast, by End-User 2020 & 2033
- Table 47: Global APAC Medical Imaging Devices Industry Revenue billion Forecast, by Geography 2020 & 2033
- Table 48: Global APAC Medical Imaging Devices Industry Volume K Unit Forecast, by Geography 2020 & 2033
- Table 49: Global APAC Medical Imaging Devices Industry Revenue billion Forecast, by Country 2020 & 2033
- Table 50: Global APAC Medical Imaging Devices Industry Volume K Unit Forecast, by Country 2020 & 2033
- Table 51: Global APAC Medical Imaging Devices Industry Revenue billion Forecast, by Modality 2020 & 2033
- Table 52: Global APAC Medical Imaging Devices Industry Volume K Unit Forecast, by Modality 2020 & 2033
- Table 53: Global APAC Medical Imaging Devices Industry Revenue billion Forecast, by Application 2020 & 2033
- Table 54: Global APAC Medical Imaging Devices Industry Volume K Unit Forecast, by Application 2020 & 2033
- Table 55: Global APAC Medical Imaging Devices Industry Revenue billion Forecast, by End-User 2020 & 2033
- Table 56: Global APAC Medical Imaging Devices Industry Volume K Unit Forecast, by End-User 2020 & 2033
- Table 57: Global APAC Medical Imaging Devices Industry Revenue billion Forecast, by Geography 2020 & 2033
- Table 58: Global APAC Medical Imaging Devices Industry Volume K Unit Forecast, by Geography 2020 & 2033
- Table 59: Global APAC Medical Imaging Devices Industry Revenue billion Forecast, by Country 2020 & 2033
- Table 60: Global APAC Medical Imaging Devices Industry Volume K Unit Forecast, by Country 2020 & 2033
- Table 61: Global APAC Medical Imaging Devices Industry Revenue billion Forecast, by Modality 2020 & 2033
- Table 62: Global APAC Medical Imaging Devices Industry Volume K Unit Forecast, by Modality 2020 & 2033
- Table 63: Global APAC Medical Imaging Devices Industry Revenue billion Forecast, by Application 2020 & 2033
- Table 64: Global APAC Medical Imaging Devices Industry Volume K Unit Forecast, by Application 2020 & 2033
- Table 65: Global APAC Medical Imaging Devices Industry Revenue billion Forecast, by End-User 2020 & 2033
- Table 66: Global APAC Medical Imaging Devices Industry Volume K Unit Forecast, by End-User 2020 & 2033
- Table 67: Global APAC Medical Imaging Devices Industry Revenue billion Forecast, by Geography 2020 & 2033
- Table 68: Global APAC Medical Imaging Devices Industry Volume K Unit Forecast, by Geography 2020 & 2033
- Table 69: Global APAC Medical Imaging Devices Industry Revenue billion Forecast, by Country 2020 & 2033
- Table 70: Global APAC Medical Imaging Devices Industry Volume K Unit Forecast, by Country 2020 & 2033
Frequently Asked Questions
1. What is the projected Compound Annual Growth Rate (CAGR) of the APAC Medical Imaging Devices Industry?
The projected CAGR is approximately 8%.
2. Which companies are prominent players in the APAC Medical Imaging Devices Industry?
Key companies in the market include Esaote SpA, Hologic Inc, GE Healthcare, Shanghai United Imaging Healthcare Co Ltd, Koninklijke Philips N V, Siemens AG, FUJIFILM Holdings Corporation, Carestream Health, J Morita Corporation, Canon Medical Systems Corporation, Teknova Medical Systems Limited, Shimadzu Corporation.
3. What are the main segments of the APAC Medical Imaging Devices Industry?
The market segments include Modality, Application, End-User, Geography.
4. Can you provide details about the market size?
The market size is estimated to be USD 143.12 billion as of 2022.
5. What are some drivers contributing to market growth?
Rising Prevalence of Chronic Diseases; Technological Advancement in Imaging Modalities; Growing Emphasis on Early Diagnosis.
6. What are the notable trends driving market growth?
Oncology Segment is Expected to Witness a Healthy Growth in Coming Years.
7. Are there any restraints impacting market growth?
Lack of Skilled Radiologist; High Cost of Advanced Diagnostic Imaging Devices.
8. Can you provide examples of recent developments in the market?
October 2022: Luxonus Inc. received approval to market its photoacoustic 3D imaging system in Japan.
9. What pricing options are available for accessing the report?
Pricing options include single-user, multi-user, and enterprise licenses priced at USD 4750, USD 5250, and USD 8750 respectively.
10. Is the market size provided in terms of value or volume?
The market size is provided in terms of value, measured in billion and volume, measured in K Unit.
11. Are there any specific market keywords associated with the report?
Yes, the market keyword associated with the report is "APAC Medical Imaging Devices Industry," which aids in identifying and referencing the specific market segment covered.
12. How do I determine which pricing option suits my needs best?
The pricing options vary based on user requirements and access needs. Individual users may opt for single-user licenses, while businesses requiring broader access may choose multi-user or enterprise licenses for cost-effective access to the report.
13. Are there any additional resources or data provided in the APAC Medical Imaging Devices Industry report?
While the report offers comprehensive insights, it's advisable to review the specific contents or supplementary materials provided to ascertain if additional resources or data are available.
14. How can I stay updated on further developments or reports in the APAC Medical Imaging Devices Industry?
To stay informed about further developments, trends, and reports in the APAC Medical Imaging Devices Industry, consider subscribing to industry newsletters, following relevant companies and organizations, or regularly checking reputable industry news sources and publications.
Methodology
Step 1 - Identification of Relevant Samples Size from Population Database


Step 2 - Approaches for Defining Global Market Size (Value, Volume* & Price*)

Note*: In applicable scenarios
Step 3 - Data Sources
Primary Research
- Web Analytics
- Survey Reports
- Research Institute
- Latest Research Reports
- Opinion Leaders
Secondary Research
- Annual Reports
- White Paper
- Latest Press Release
- Industry Association
- Paid Database
- Investor Presentations

Step 4 - Data Triangulation
Involves using different sources of information in order to increase the validity of a study
These sources are likely to be stakeholders in a program - participants, other researchers, program staff, other community members, and so on.
Then we put all data in single framework & apply various statistical tools to find out the dynamic on the market.
During the analysis stage, feedback from the stakeholder groups would be compared to determine areas of agreement as well as areas of divergence