Key Insights
The Computational Biology market is experiencing robust growth, projected to reach an estimated $7.18 billion by 2025. This expansion is driven by an anticipated Compound Annual Growth Rate (CAGR) of 13.2% over the forecast period. The industry's dynamism is fueled by significant advancements in computational power and sophisticated algorithms, enabling deeper insights into complex biological systems. Key drivers include the escalating demand for personalized medicine, the increasing prevalence of chronic diseases, and the imperative to accelerate drug discovery and development pipelines. Industries are heavily investing in computational biology to reduce R&D costs, enhance the accuracy of preclinical studies, and optimize clinical trial designs. The growing adoption of advanced analytical tools and cloud-based infrastructure further underpins this market expansion, making it an attractive area for technological innovation and investment.
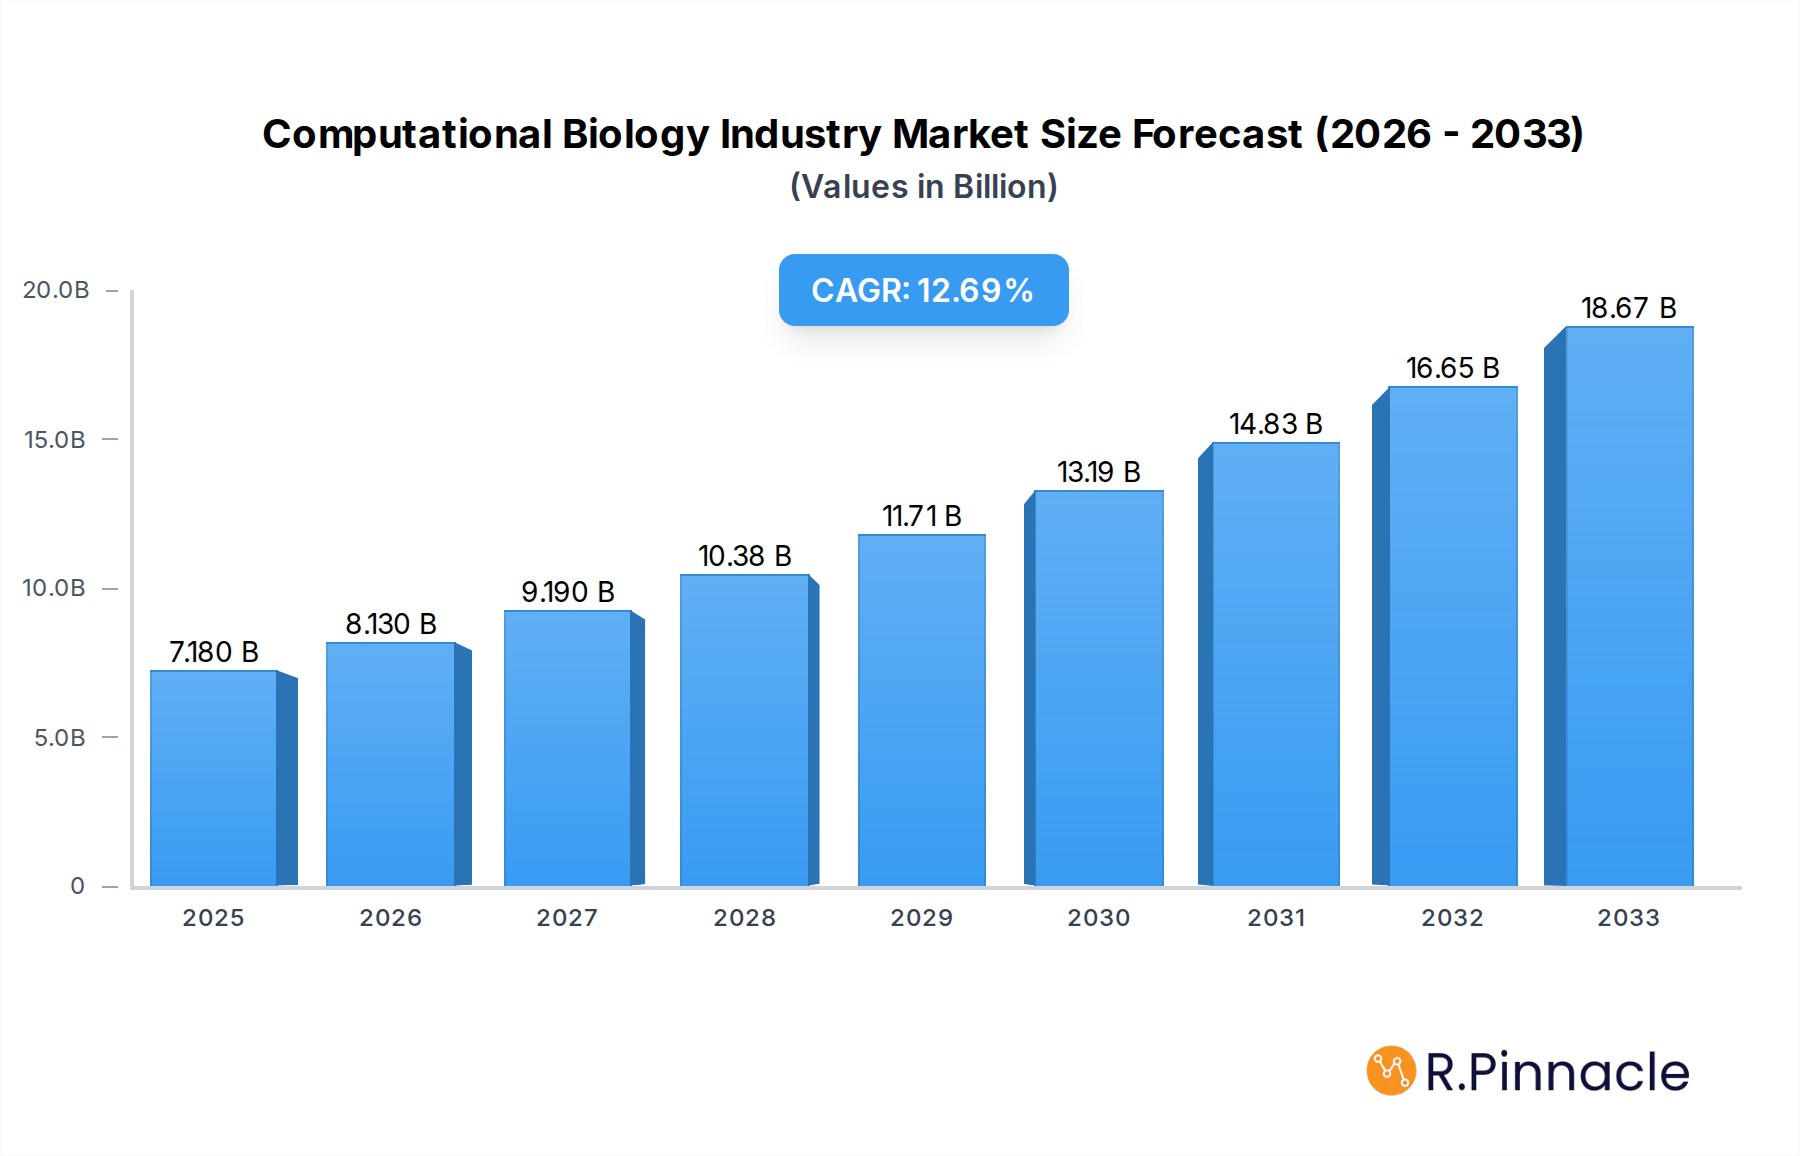
Computational Biology Industry Market Size (In Billion)
The market is segmented across diverse applications, including cellular and biological simulation (encompassing computational genomics, proteomics, and pharmacogenomics), drug discovery and disease modeling (covering target identification and lead optimization), preclinical drug development (focusing on pharmacokinetics and pharmacodynamics), and clinical trials (spanning all phases). The development of human body simulation software is also a significant area of growth. Key tools and services contributing to this market include databases, robust infrastructure (hardware), advanced analysis software, and specialized services offered both in-house and through contract organizations. End-users span academic institutions, various industries, and commercial entities. Geographically, North America currently leads the market, followed by Europe and the Asia Pacific region, with emerging markets in the Middle East and Africa, and South America showing promising growth trajectories. The competitive landscape is characterized by the presence of established players and innovative startups, all vying to leverage computational biology for groundbreaking advancements in healthcare.

Computational Biology Industry Company Market Share
Computational Biology Industry: Unlocking Precision Medicine and Accelerating Drug Discovery (2025-2033)
This comprehensive report provides an in-depth analysis of the global Computational Biology industry, a sector projected to witness exponential growth driven by advancements in AI, machine learning, and the increasing demand for personalized medicine and faster drug development. Spanning from 2019 to 2033, with a base year of 2025 and a forecast period of 2025–2033, this study offers critical insights for industry stakeholders, including academics, commercial enterprises, and contract service providers. With an estimated market size in the billions, the report meticulously examines market structure, dynamics, regional dominance, product innovations, and key growth drivers, challenges, and emerging opportunities. Gain actionable intelligence on market penetration, CAGR, and competitive landscapes to navigate this rapidly evolving biotechnology market and life sciences software domain.
Computational Biology Industry Market Structure & Innovation Trends
The Computational Biology industry is characterized by a dynamic market structure with a moderate to high degree of concentration, driven by significant R&D investments and the need for specialized expertise. Innovation is the primary engine, fueled by the integration of artificial intelligence (AI) and machine learning (ML) into genomics, proteomics, and drug discovery. Regulatory frameworks, while essential for ensuring data integrity and ethical research, also present a significant consideration for market entry and product development. The presence of robust substitute technologies is limited, given the unique computational demands of biological research, but advancements in alternative data analysis techniques are constantly emerging. End-user demographics are diverse, encompassing academic institutions, pharmaceutical and biotechnology companies, and contract research organizations (CROs). Mergers and acquisitions (M&A) are a prevalent strategy for market consolidation and technology acquisition, with deal values often reaching the billions. Key players are actively acquiring smaller, innovative firms to expand their technological capabilities and market reach. The market share distribution reflects the dominance of established technology providers and specialized AI-driven drug discovery companies.
Computational Biology Industry Market Dynamics & Trends
The Computational Biology industry is poised for remarkable growth, with an estimated Compound Annual Growth Rate (CAGR) of over 15% from 2025 to 2033. This expansion is predominantly propelled by the escalating need for precision medicine and the imperative to accelerate the drug discovery and development pipeline. The increasing volume and complexity of biological data, often referred to as "big data," necessitate advanced computational tools for analysis, driving market penetration of sophisticated bioinformatics software and simulation tools. Technological disruptions are relentless, with AI and ML transforming every facet of the industry, from target identification and validation to lead optimization and clinical trial design. Advances in cloud computing are also playing a pivotal role, providing scalable infrastructure and enhanced accessibility for computational resources. Consumer preferences are shifting towards personalized treatments and faster access to novel therapies, creating a strong demand for computational genomics, pharmacogenomics, and predictive disease modeling. The competitive dynamics are intensifying, with a blend of established life sciences software providers and agile AI-first drug discovery companies vying for market leadership. The rise of cloud-based platforms and collaborative research environments is democratizing access to computational biology tools, further stimulating market growth. The integration of human body simulation software is also gaining traction, offering a more holistic approach to understanding disease mechanisms and drug efficacy.
Dominant Regions & Segments in Computational Biology Industry
North America currently stands as the dominant region in the Computational Biology industry, driven by its robust healthcare infrastructure, significant R&D investments from both academic and commercial entities, and a strong presence of leading pharmaceutical and biotechnology companies. The United States, in particular, accounts for a substantial market share. Key drivers for this dominance include favorable government policies supporting life sciences research, a well-established ecosystem of tech startups and venture capital funding, and a high adoption rate of advanced technologies.
Within the Application segment, Drug Discovery and Disease Modelling holds the largest market share. This is further broken down into:
- Target Identification & Target Validation: Essential for initiating the drug discovery process, these sub-segments benefit from AI-driven hypothesis generation and data analysis.
- Lead Discovery & Lead Optimization: Computational methods significantly reduce the time and cost associated with identifying and refining potential drug candidates.
The Cellular and Biological Simulation segment is also experiencing rapid growth, with:
- Computational Genomics: Crucial for understanding genetic variations and their role in diseases.
- Computational Proteomics: Essential for deciphering protein functions and interactions.
- Pharmacogenomics: Driving the development of personalized medicine by predicting drug response based on genetic makeup.
The Tool segment is dominated by Analysis Software and Services, reflecting the critical need for advanced software solutions and expert support to interpret complex biological data. The Service segment sees significant activity in Contract services, as companies increasingly outsource specialized computational biology tasks to CROs to leverage expertise and infrastructure. The End-User segment of Industry and Commercials represents the largest consumer base, accounting for the majority of market revenue, with Academics playing a vital role in fundamental research and early-stage innovation.
Computational Biology Industry Product Innovations
Product innovations in the Computational Biology industry are primarily centered on the development of AI-powered platforms and advanced algorithms. These innovations aim to accelerate drug discovery, enhance disease modeling, and enable more precise cellular and biological simulations. Key advancements include predictive analytics for target identification, virtual screening tools for lead discovery, and sophisticated modeling for preclinical drug development. These products offer significant competitive advantages by reducing development timelines, improving success rates, and lowering R&D costs for pharmaceutical and biotechnology companies. The market is witnessing a surge in solutions that integrate diverse data sources, such as genomic, proteomic, and clinical data, to provide holistic insights.
Report Scope & Segmentation Analysis
This report meticulously analyzes the Computational Biology industry across several key segments. The Application segment, encompassing Cellular and Biological Simulation (including Computational Genomics, Computational Proteomics, Pharmacogenomics, and Other Ce), and Drug Discovery and Disease Modelling (including Target Identification, Target Validation, Lead Discovery, and Lead Optimization), is projected to witness robust growth driven by the increasing demand for personalized medicine and novel therapeutics. The Preclinical Drug Development segment, covering Pharmacokinetics and Pharmacodynamics, is also crucial, with significant market expansion anticipated. The By Clinical Trials segment, from Phase I to Phase III, is being revolutionized by computational approaches that enhance trial design and patient stratification. Human Body Simulation Software is an emerging area with substantial growth potential. The Tool segment includes Databases, Infrastructure (Hardware), and Analysis Software and Services, with the latter expected to dominate due to the growing need for data interpretation. The Service segment comprises In-house and Contract services, with contract research organizations playing an increasingly vital role. Finally, the End-User segment includes Academics, Industry and Commercials, with commercial entities representing the largest market share.
Key Drivers of Computational Biology Industry Growth
The growth of the Computational Biology industry is primarily driven by several interconnected factors. The accelerating pace of technological innovation, particularly in AI and machine learning, is revolutionizing data analysis and predictive modeling capabilities. Increasing investments in life sciences research and development from both government and private sectors, often in the billions, are fueling demand for sophisticated computational tools. The burgeoning volume of biological data, generated through high-throughput sequencing and other omics technologies, necessitates advanced computational solutions for meaningful interpretation. Furthermore, the global push towards personalized medicine and the development of targeted therapies are creating a significant market for computational approaches that can predict individual responses to treatments.
Challenges in the Computational Biology Industry Sector
Despite its promising growth trajectory, the Computational Biology industry faces several challenges. Navigating complex and evolving regulatory frameworks for data privacy and drug approval can be a significant hurdle. The high cost of specialized hardware and software infrastructure can be a barrier to entry, especially for smaller academic institutions and startups. Acquiring and retaining skilled personnel with expertise in both biology and computer science remains a persistent challenge, creating a talent gap in the market. Furthermore, the integration of diverse and often disparate datasets can be technically complex, requiring robust data management and standardization strategies. Ensuring the interpretability and validation of AI-driven predictions is also critical for building trust and widespread adoption within the scientific community.
Emerging Opportunities in Computational Biology Industry
Emerging opportunities in the Computational Biology industry are vast and varied. The increasing application of AI and ML in drug discovery pipelines, particularly in the early stages of target identification and lead optimization, presents significant growth potential, with market opportunities in the billions. The expansion of personalized medicine, driven by advancements in pharmacogenomics and precision oncology, opens new avenues for tailored therapeutic development. The growing interest in understanding complex biological systems through detailed cellular and biological simulations and human body simulation software offers substantial market prospects. Furthermore, the development of more accessible and cloud-based computational platforms is democratizing access to these powerful tools, enabling wider adoption across academic and industrial settings. The integration of real-world evidence (RWE) into computational models is another exciting frontier, promising more robust and clinically relevant insights.
Leading Players in the Computational Biology Industry Market
- Certara
- Nimbus Discovery LLC
- Instem Plc (Leadscope Inc)
- Strand Life Sciences
- Chemical Computing Group ULC
- Simulation Plus Inc
- Dassault Systèmes SE
- Genedata AG
- Rosa & Co LLC
- Compugen Ltd
- Insilico Biotechnology AG
- Schrodinger
Key Developments in Computational Biology Industry Industry
- February 2023: The Centre for Development of Advanced Computing (C-DAC) launched two software tools critical for research in life sciences. Integrated Computing Environment, one of the products, is an indigenous cloud-based genomics computational facility for bioinformatics that integrates ICE-cube, a hardware infrastructure, and ICE flakes. This software will help securely store and analyze petascale to exascale genomics data.
- January 2023: Insilico Medicine, a clinical-stage, end-to-end artificial intelligence (AI)-driven drug discovery company, launched the 6th generation Intelligent Robotics Lab to accelerate its AI-driven drug discovery. The fully automated AI-powered robotics laboratory performs target discovery, compound screening, precision medicine development, and translational research.
Future Outlook for Computational Biology Industry Market
The future outlook for the Computational Biology industry is exceptionally bright, with continuous innovation and increasing adoption set to drive sustained growth. The convergence of AI, big data analytics, and high-performance computing will further revolutionize drug discovery and development processes, leading to faster timelines and higher success rates. The expansion of personalized medicine, fueled by advancements in genomics and pharmacogenomics, will continue to be a significant growth accelerator. The development of more sophisticated human body simulation software will enhance our understanding of disease mechanisms and drug interactions. Strategic collaborations between technology providers, pharmaceutical companies, and academic institutions will foster a more dynamic and efficient research ecosystem. The market is expected to witness substantial investments in cloud-based platforms and services, making advanced computational tools more accessible and scalable, ultimately impacting global health outcomes in the billions.
Computational Biology Industry Segmentation
-
1. Application
-
1.1. Cellular and Biological Simulation
- 1.1.1. Computational Genomics
- 1.1.2. Computational Proteomics
- 1.1.3. Pharmacogenomics
- 1.1.4. Other Ce
-
1.2. Drug Discovery and Disease Modelling
- 1.2.1. Target Identification
- 1.2.2. Target Validation
- 1.2.3. Lead Discovery
- 1.2.4. Lead Optimization
-
1.3. Preclinical Drug Development
- 1.3.1. Pharmacokinetics
- 1.3.2. Pharmacodynamics
-
1.4. By Clinical Trials
- 1.4.1. Phase I
- 1.4.2. Phase II
- 1.4.3. Phase III
- 1.5. Human Body Simulation Software
-
1.1. Cellular and Biological Simulation
-
2. Tool
- 2.1. Databases
- 2.2. Infrastructure (Hardware)
- 2.3. Analysis Software and Services
-
3. Service
- 3.1. In-house
- 3.2. Contract
-
4. End-User
- 4.1. Academics
- 4.2. Industry and Commercials
Computational Biology Industry Segmentation By Geography
-
1. North America
- 1.1. United States
- 1.2. Canada
- 1.3. Mexico
-
2. Europe
- 2.1. Germany
- 2.2. United Kingdom
- 2.3. France
- 2.4. Italy
- 2.5. Spain
- 2.6. Rest of Europe
-
3. Asia Pacific
- 3.1. China
- 3.2. Japan
- 3.3. India
- 3.4. Australia
- 3.5. South Korea
- 3.6. Rest of Asia Pacific
-
4. Middle East and Africa
- 4.1. GCC
- 4.2. South Africa
- 4.3. Rest of Middle East and Africa
-
5. South America
- 5.1. Brazil
- 5.2. Argentina
- 5.3. Rest of South America

Computational Biology Industry Regional Market Share
Geographic Coverage of Computational Biology Industry
Computational Biology Industry REPORT HIGHLIGHTS
| Aspects | Details |
|---|---|
| Study Period | 2020-2034 |
| Base Year | 2025 |
| Estimated Year | 2026 |
| Forecast Period | 2026-2034 |
| Historical Period | 2020-2025 |
| Growth Rate | CAGR of 13.2% from 2020-2034 |
| Segmentation |
|
Table of Contents
- 1. Introduction
- 1.1. Research Scope
- 1.2. Market Segmentation
- 1.3. Research Objective
- 1.4. Definitions and Assumptions
- 2. Executive Summary
- 2.1. Market Snapshot
- 3. Market Dynamics
- 3.1. Market Drivers
- 3.2. Market Restrains
- 3.3. Market Trends
- 3.4. Market Opportunities
- 4. Market Factor Analysis
- 4.1. Porters Five Forces
- 4.1.1. Bargaining Power of Suppliers
- 4.1.2. Bargaining Power of Buyers
- 4.1.3. Threat of New Entrants
- 4.1.4. Threat of Substitutes
- 4.1.5. Competitive Rivalry
- 4.2. PESTEL analysis
- 4.3. BCG Analysis
- 4.3.1. Stars (High Growth, High Market Share)
- 4.3.2. Cash Cows (Low Growth, High Market Share)
- 4.3.3. Question Mark (High Growth, Low Market Share)
- 4.3.4. Dogs (Low Growth, Low Market Share)
- 4.4. Ansoff Matrix Analysis
- 4.5. Supply Chain Analysis
- 4.6. Regulatory Landscape
- 4.7. Current Market Potential and Opportunity Assessment (TAM–SAM–SOM Framework)
- 4.8. PRI Analyst Note
- 4.1. Porters Five Forces
- 5. Market Analysis, Insights and Forecast 2021-2033
- 5.1. Market Analysis, Insights and Forecast - by Application
- 5.1.1. Cellular and Biological Simulation
- 5.1.1.1. Computational Genomics
- 5.1.1.2. Computational Proteomics
- 5.1.1.3. Pharmacogenomics
- 5.1.1.4. Other Ce
- 5.1.2. Drug Discovery and Disease Modelling
- 5.1.2.1. Target Identification
- 5.1.2.2. Target Validation
- 5.1.2.3. Lead Discovery
- 5.1.2.4. Lead Optimization
- 5.1.3. Preclinical Drug Development
- 5.1.3.1. Pharmacokinetics
- 5.1.3.2. Pharmacodynamics
- 5.1.4. By Clinical Trials
- 5.1.4.1. Phase I
- 5.1.4.2. Phase II
- 5.1.4.3. Phase III
- 5.1.5. Human Body Simulation Software
- 5.1.1. Cellular and Biological Simulation
- 5.2. Market Analysis, Insights and Forecast - by Tool
- 5.2.1. Databases
- 5.2.2. Infrastructure (Hardware)
- 5.2.3. Analysis Software and Services
- 5.3. Market Analysis, Insights and Forecast - by Service
- 5.3.1. In-house
- 5.3.2. Contract
- 5.4. Market Analysis, Insights and Forecast - by End-User
- 5.4.1. Academics
- 5.4.2. Industry and Commercials
- 5.5. Market Analysis, Insights and Forecast - by Region
- 5.5.1. North America
- 5.5.2. Europe
- 5.5.3. Asia Pacific
- 5.5.4. Middle East and Africa
- 5.5.5. South America
- 5.1. Market Analysis, Insights and Forecast - by Application
- 6. Global Computational Biology Industry Analysis, Insights and Forecast, 2021-2033
- 6.1. Market Analysis, Insights and Forecast - by Application
- 6.1.1. Cellular and Biological Simulation
- 6.1.1.1. Computational Genomics
- 6.1.1.2. Computational Proteomics
- 6.1.1.3. Pharmacogenomics
- 6.1.1.4. Other Ce
- 6.1.2. Drug Discovery and Disease Modelling
- 6.1.2.1. Target Identification
- 6.1.2.2. Target Validation
- 6.1.2.3. Lead Discovery
- 6.1.2.4. Lead Optimization
- 6.1.3. Preclinical Drug Development
- 6.1.3.1. Pharmacokinetics
- 6.1.3.2. Pharmacodynamics
- 6.1.4. By Clinical Trials
- 6.1.4.1. Phase I
- 6.1.4.2. Phase II
- 6.1.4.3. Phase III
- 6.1.5. Human Body Simulation Software
- 6.1.1. Cellular and Biological Simulation
- 6.2. Market Analysis, Insights and Forecast - by Tool
- 6.2.1. Databases
- 6.2.2. Infrastructure (Hardware)
- 6.2.3. Analysis Software and Services
- 6.3. Market Analysis, Insights and Forecast - by Service
- 6.3.1. In-house
- 6.3.2. Contract
- 6.4. Market Analysis, Insights and Forecast - by End-User
- 6.4.1. Academics
- 6.4.2. Industry and Commercials
- 6.1. Market Analysis, Insights and Forecast - by Application
- 7. North America Computational Biology Industry Analysis, Insights and Forecast, 2020-2032
- 7.1. Market Analysis, Insights and Forecast - by Application
- 7.1.1. Cellular and Biological Simulation
- 7.1.1.1. Computational Genomics
- 7.1.1.2. Computational Proteomics
- 7.1.1.3. Pharmacogenomics
- 7.1.1.4. Other Ce
- 7.1.2. Drug Discovery and Disease Modelling
- 7.1.2.1. Target Identification
- 7.1.2.2. Target Validation
- 7.1.2.3. Lead Discovery
- 7.1.2.4. Lead Optimization
- 7.1.3. Preclinical Drug Development
- 7.1.3.1. Pharmacokinetics
- 7.1.3.2. Pharmacodynamics
- 7.1.4. By Clinical Trials
- 7.1.4.1. Phase I
- 7.1.4.2. Phase II
- 7.1.4.3. Phase III
- 7.1.5. Human Body Simulation Software
- 7.1.1. Cellular and Biological Simulation
- 7.2. Market Analysis, Insights and Forecast - by Tool
- 7.2.1. Databases
- 7.2.2. Infrastructure (Hardware)
- 7.2.3. Analysis Software and Services
- 7.3. Market Analysis, Insights and Forecast - by Service
- 7.3.1. In-house
- 7.3.2. Contract
- 7.4. Market Analysis, Insights and Forecast - by End-User
- 7.4.1. Academics
- 7.4.2. Industry and Commercials
- 7.1. Market Analysis, Insights and Forecast - by Application
- 8. Europe Computational Biology Industry Analysis, Insights and Forecast, 2020-2032
- 8.1. Market Analysis, Insights and Forecast - by Application
- 8.1.1. Cellular and Biological Simulation
- 8.1.1.1. Computational Genomics
- 8.1.1.2. Computational Proteomics
- 8.1.1.3. Pharmacogenomics
- 8.1.1.4. Other Ce
- 8.1.2. Drug Discovery and Disease Modelling
- 8.1.2.1. Target Identification
- 8.1.2.2. Target Validation
- 8.1.2.3. Lead Discovery
- 8.1.2.4. Lead Optimization
- 8.1.3. Preclinical Drug Development
- 8.1.3.1. Pharmacokinetics
- 8.1.3.2. Pharmacodynamics
- 8.1.4. By Clinical Trials
- 8.1.4.1. Phase I
- 8.1.4.2. Phase II
- 8.1.4.3. Phase III
- 8.1.5. Human Body Simulation Software
- 8.1.1. Cellular and Biological Simulation
- 8.2. Market Analysis, Insights and Forecast - by Tool
- 8.2.1. Databases
- 8.2.2. Infrastructure (Hardware)
- 8.2.3. Analysis Software and Services
- 8.3. Market Analysis, Insights and Forecast - by Service
- 8.3.1. In-house
- 8.3.2. Contract
- 8.4. Market Analysis, Insights and Forecast - by End-User
- 8.4.1. Academics
- 8.4.2. Industry and Commercials
- 8.1. Market Analysis, Insights and Forecast - by Application
- 9. Asia Pacific Computational Biology Industry Analysis, Insights and Forecast, 2020-2032
- 9.1. Market Analysis, Insights and Forecast - by Application
- 9.1.1. Cellular and Biological Simulation
- 9.1.1.1. Computational Genomics
- 9.1.1.2. Computational Proteomics
- 9.1.1.3. Pharmacogenomics
- 9.1.1.4. Other Ce
- 9.1.2. Drug Discovery and Disease Modelling
- 9.1.2.1. Target Identification
- 9.1.2.2. Target Validation
- 9.1.2.3. Lead Discovery
- 9.1.2.4. Lead Optimization
- 9.1.3. Preclinical Drug Development
- 9.1.3.1. Pharmacokinetics
- 9.1.3.2. Pharmacodynamics
- 9.1.4. By Clinical Trials
- 9.1.4.1. Phase I
- 9.1.4.2. Phase II
- 9.1.4.3. Phase III
- 9.1.5. Human Body Simulation Software
- 9.1.1. Cellular and Biological Simulation
- 9.2. Market Analysis, Insights and Forecast - by Tool
- 9.2.1. Databases
- 9.2.2. Infrastructure (Hardware)
- 9.2.3. Analysis Software and Services
- 9.3. Market Analysis, Insights and Forecast - by Service
- 9.3.1. In-house
- 9.3.2. Contract
- 9.4. Market Analysis, Insights and Forecast - by End-User
- 9.4.1. Academics
- 9.4.2. Industry and Commercials
- 9.1. Market Analysis, Insights and Forecast - by Application
- 10. Middle East and Africa Computational Biology Industry Analysis, Insights and Forecast, 2020-2032
- 10.1. Market Analysis, Insights and Forecast - by Application
- 10.1.1. Cellular and Biological Simulation
- 10.1.1.1. Computational Genomics
- 10.1.1.2. Computational Proteomics
- 10.1.1.3. Pharmacogenomics
- 10.1.1.4. Other Ce
- 10.1.2. Drug Discovery and Disease Modelling
- 10.1.2.1. Target Identification
- 10.1.2.2. Target Validation
- 10.1.2.3. Lead Discovery
- 10.1.2.4. Lead Optimization
- 10.1.3. Preclinical Drug Development
- 10.1.3.1. Pharmacokinetics
- 10.1.3.2. Pharmacodynamics
- 10.1.4. By Clinical Trials
- 10.1.4.1. Phase I
- 10.1.4.2. Phase II
- 10.1.4.3. Phase III
- 10.1.5. Human Body Simulation Software
- 10.1.1. Cellular and Biological Simulation
- 10.2. Market Analysis, Insights and Forecast - by Tool
- 10.2.1. Databases
- 10.2.2. Infrastructure (Hardware)
- 10.2.3. Analysis Software and Services
- 10.3. Market Analysis, Insights and Forecast - by Service
- 10.3.1. In-house
- 10.3.2. Contract
- 10.4. Market Analysis, Insights and Forecast - by End-User
- 10.4.1. Academics
- 10.4.2. Industry and Commercials
- 10.1. Market Analysis, Insights and Forecast - by Application
- 11. South America Computational Biology Industry Analysis, Insights and Forecast, 2020-2032
- 11.1. Market Analysis, Insights and Forecast - by Application
- 11.1.1. Cellular and Biological Simulation
- 11.1.1.1. Computational Genomics
- 11.1.1.2. Computational Proteomics
- 11.1.1.3. Pharmacogenomics
- 11.1.1.4. Other Ce
- 11.1.2. Drug Discovery and Disease Modelling
- 11.1.2.1. Target Identification
- 11.1.2.2. Target Validation
- 11.1.2.3. Lead Discovery
- 11.1.2.4. Lead Optimization
- 11.1.3. Preclinical Drug Development
- 11.1.3.1. Pharmacokinetics
- 11.1.3.2. Pharmacodynamics
- 11.1.4. By Clinical Trials
- 11.1.4.1. Phase I
- 11.1.4.2. Phase II
- 11.1.4.3. Phase III
- 11.1.5. Human Body Simulation Software
- 11.1.1. Cellular and Biological Simulation
- 11.2. Market Analysis, Insights and Forecast - by Tool
- 11.2.1. Databases
- 11.2.2. Infrastructure (Hardware)
- 11.2.3. Analysis Software and Services
- 11.3. Market Analysis, Insights and Forecast - by Service
- 11.3.1. In-house
- 11.3.2. Contract
- 11.4. Market Analysis, Insights and Forecast - by End-User
- 11.4.1. Academics
- 11.4.2. Industry and Commercials
- 11.1. Market Analysis, Insights and Forecast - by Application
- 12. Competitive Analysis
- 12.1. Company Profiles
- 12.1.1 Certara
- 12.1.1.1. Company Overview
- 12.1.1.2. Products
- 12.1.1.3. Company Financials
- 12.1.1.4. SWOT Analysis
- 12.1.2 Nimbus Discovery LLC
- 12.1.2.1. Company Overview
- 12.1.2.2. Products
- 12.1.2.3. Company Financials
- 12.1.2.4. SWOT Analysis
- 12.1.3 Instem Plc (Leadscope Inc )
- 12.1.3.1. Company Overview
- 12.1.3.2. Products
- 12.1.3.3. Company Financials
- 12.1.3.4. SWOT Analysis
- 12.1.4 Strand Life Sciences
- 12.1.4.1. Company Overview
- 12.1.4.2. Products
- 12.1.4.3. Company Financials
- 12.1.4.4. SWOT Analysis
- 12.1.5 Chemical Computing Group ULC
- 12.1.5.1. Company Overview
- 12.1.5.2. Products
- 12.1.5.3. Company Financials
- 12.1.5.4. SWOT Analysis
- 12.1.6 Simulation Plus Inc
- 12.1.6.1. Company Overview
- 12.1.6.2. Products
- 12.1.6.3. Company Financials
- 12.1.6.4. SWOT Analysis
- 12.1.7 Dassault Systèmes SE
- 12.1.7.1. Company Overview
- 12.1.7.2. Products
- 12.1.7.3. Company Financials
- 12.1.7.4. SWOT Analysis
- 12.1.8 Genedata AG
- 12.1.8.1. Company Overview
- 12.1.8.2. Products
- 12.1.8.3. Company Financials
- 12.1.8.4. SWOT Analysis
- 12.1.9 Rosa & Co LLC
- 12.1.9.1. Company Overview
- 12.1.9.2. Products
- 12.1.9.3. Company Financials
- 12.1.9.4. SWOT Analysis
- 12.1.10 Compugen Ltd
- 12.1.10.1. Company Overview
- 12.1.10.2. Products
- 12.1.10.3. Company Financials
- 12.1.10.4. SWOT Analysis
- 12.1.11 Insilico Biotechnology AG
- 12.1.11.1. Company Overview
- 12.1.11.2. Products
- 12.1.11.3. Company Financials
- 12.1.11.4. SWOT Analysis
- 12.1.12 Schrodinger
- 12.1.12.1. Company Overview
- 12.1.12.2. Products
- 12.1.12.3. Company Financials
- 12.1.12.4. SWOT Analysis
- 12.1.1 Certara
- 12.2. Market Entropy
- 12.2.1 Company's Key Areas Served
- 12.2.2 Recent Developments
- 12.3. Company Market Share Analysis 2025
- 12.3.1 Top 5 Companies Market Share Analysis
- 12.3.2 Top 3 Companies Market Share Analysis
- 12.4. List of Potential Customers
- 13. Research Methodology
List of Figures
- Figure 1: Global Computational Biology Industry Revenue Breakdown (billion, %) by Region 2025 & 2033
- Figure 2: North America Computational Biology Industry Revenue (billion), by Application 2025 & 2033
- Figure 3: North America Computational Biology Industry Revenue Share (%), by Application 2025 & 2033
- Figure 4: North America Computational Biology Industry Revenue (billion), by Tool 2025 & 2033
- Figure 5: North America Computational Biology Industry Revenue Share (%), by Tool 2025 & 2033
- Figure 6: North America Computational Biology Industry Revenue (billion), by Service 2025 & 2033
- Figure 7: North America Computational Biology Industry Revenue Share (%), by Service 2025 & 2033
- Figure 8: North America Computational Biology Industry Revenue (billion), by End-User 2025 & 2033
- Figure 9: North America Computational Biology Industry Revenue Share (%), by End-User 2025 & 2033
- Figure 10: North America Computational Biology Industry Revenue (billion), by Country 2025 & 2033
- Figure 11: North America Computational Biology Industry Revenue Share (%), by Country 2025 & 2033
- Figure 12: Europe Computational Biology Industry Revenue (billion), by Application 2025 & 2033
- Figure 13: Europe Computational Biology Industry Revenue Share (%), by Application 2025 & 2033
- Figure 14: Europe Computational Biology Industry Revenue (billion), by Tool 2025 & 2033
- Figure 15: Europe Computational Biology Industry Revenue Share (%), by Tool 2025 & 2033
- Figure 16: Europe Computational Biology Industry Revenue (billion), by Service 2025 & 2033
- Figure 17: Europe Computational Biology Industry Revenue Share (%), by Service 2025 & 2033
- Figure 18: Europe Computational Biology Industry Revenue (billion), by End-User 2025 & 2033
- Figure 19: Europe Computational Biology Industry Revenue Share (%), by End-User 2025 & 2033
- Figure 20: Europe Computational Biology Industry Revenue (billion), by Country 2025 & 2033
- Figure 21: Europe Computational Biology Industry Revenue Share (%), by Country 2025 & 2033
- Figure 22: Asia Pacific Computational Biology Industry Revenue (billion), by Application 2025 & 2033
- Figure 23: Asia Pacific Computational Biology Industry Revenue Share (%), by Application 2025 & 2033
- Figure 24: Asia Pacific Computational Biology Industry Revenue (billion), by Tool 2025 & 2033
- Figure 25: Asia Pacific Computational Biology Industry Revenue Share (%), by Tool 2025 & 2033
- Figure 26: Asia Pacific Computational Biology Industry Revenue (billion), by Service 2025 & 2033
- Figure 27: Asia Pacific Computational Biology Industry Revenue Share (%), by Service 2025 & 2033
- Figure 28: Asia Pacific Computational Biology Industry Revenue (billion), by End-User 2025 & 2033
- Figure 29: Asia Pacific Computational Biology Industry Revenue Share (%), by End-User 2025 & 2033
- Figure 30: Asia Pacific Computational Biology Industry Revenue (billion), by Country 2025 & 2033
- Figure 31: Asia Pacific Computational Biology Industry Revenue Share (%), by Country 2025 & 2033
- Figure 32: Middle East and Africa Computational Biology Industry Revenue (billion), by Application 2025 & 2033
- Figure 33: Middle East and Africa Computational Biology Industry Revenue Share (%), by Application 2025 & 2033
- Figure 34: Middle East and Africa Computational Biology Industry Revenue (billion), by Tool 2025 & 2033
- Figure 35: Middle East and Africa Computational Biology Industry Revenue Share (%), by Tool 2025 & 2033
- Figure 36: Middle East and Africa Computational Biology Industry Revenue (billion), by Service 2025 & 2033
- Figure 37: Middle East and Africa Computational Biology Industry Revenue Share (%), by Service 2025 & 2033
- Figure 38: Middle East and Africa Computational Biology Industry Revenue (billion), by End-User 2025 & 2033
- Figure 39: Middle East and Africa Computational Biology Industry Revenue Share (%), by End-User 2025 & 2033
- Figure 40: Middle East and Africa Computational Biology Industry Revenue (billion), by Country 2025 & 2033
- Figure 41: Middle East and Africa Computational Biology Industry Revenue Share (%), by Country 2025 & 2033
- Figure 42: South America Computational Biology Industry Revenue (billion), by Application 2025 & 2033
- Figure 43: South America Computational Biology Industry Revenue Share (%), by Application 2025 & 2033
- Figure 44: South America Computational Biology Industry Revenue (billion), by Tool 2025 & 2033
- Figure 45: South America Computational Biology Industry Revenue Share (%), by Tool 2025 & 2033
- Figure 46: South America Computational Biology Industry Revenue (billion), by Service 2025 & 2033
- Figure 47: South America Computational Biology Industry Revenue Share (%), by Service 2025 & 2033
- Figure 48: South America Computational Biology Industry Revenue (billion), by End-User 2025 & 2033
- Figure 49: South America Computational Biology Industry Revenue Share (%), by End-User 2025 & 2033
- Figure 50: South America Computational Biology Industry Revenue (billion), by Country 2025 & 2033
- Figure 51: South America Computational Biology Industry Revenue Share (%), by Country 2025 & 2033
List of Tables
- Table 1: Global Computational Biology Industry Revenue billion Forecast, by Application 2020 & 2033
- Table 2: Global Computational Biology Industry Revenue billion Forecast, by Tool 2020 & 2033
- Table 3: Global Computational Biology Industry Revenue billion Forecast, by Service 2020 & 2033
- Table 4: Global Computational Biology Industry Revenue billion Forecast, by End-User 2020 & 2033
- Table 5: Global Computational Biology Industry Revenue billion Forecast, by Region 2020 & 2033
- Table 6: Global Computational Biology Industry Revenue billion Forecast, by Application 2020 & 2033
- Table 7: Global Computational Biology Industry Revenue billion Forecast, by Tool 2020 & 2033
- Table 8: Global Computational Biology Industry Revenue billion Forecast, by Service 2020 & 2033
- Table 9: Global Computational Biology Industry Revenue billion Forecast, by End-User 2020 & 2033
- Table 10: Global Computational Biology Industry Revenue billion Forecast, by Country 2020 & 2033
- Table 11: United States Computational Biology Industry Revenue (billion) Forecast, by Application 2020 & 2033
- Table 12: Canada Computational Biology Industry Revenue (billion) Forecast, by Application 2020 & 2033
- Table 13: Mexico Computational Biology Industry Revenue (billion) Forecast, by Application 2020 & 2033
- Table 14: Global Computational Biology Industry Revenue billion Forecast, by Application 2020 & 2033
- Table 15: Global Computational Biology Industry Revenue billion Forecast, by Tool 2020 & 2033
- Table 16: Global Computational Biology Industry Revenue billion Forecast, by Service 2020 & 2033
- Table 17: Global Computational Biology Industry Revenue billion Forecast, by End-User 2020 & 2033
- Table 18: Global Computational Biology Industry Revenue billion Forecast, by Country 2020 & 2033
- Table 19: Germany Computational Biology Industry Revenue (billion) Forecast, by Application 2020 & 2033
- Table 20: United Kingdom Computational Biology Industry Revenue (billion) Forecast, by Application 2020 & 2033
- Table 21: France Computational Biology Industry Revenue (billion) Forecast, by Application 2020 & 2033
- Table 22: Italy Computational Biology Industry Revenue (billion) Forecast, by Application 2020 & 2033
- Table 23: Spain Computational Biology Industry Revenue (billion) Forecast, by Application 2020 & 2033
- Table 24: Rest of Europe Computational Biology Industry Revenue (billion) Forecast, by Application 2020 & 2033
- Table 25: Global Computational Biology Industry Revenue billion Forecast, by Application 2020 & 2033
- Table 26: Global Computational Biology Industry Revenue billion Forecast, by Tool 2020 & 2033
- Table 27: Global Computational Biology Industry Revenue billion Forecast, by Service 2020 & 2033
- Table 28: Global Computational Biology Industry Revenue billion Forecast, by End-User 2020 & 2033
- Table 29: Global Computational Biology Industry Revenue billion Forecast, by Country 2020 & 2033
- Table 30: China Computational Biology Industry Revenue (billion) Forecast, by Application 2020 & 2033
- Table 31: Japan Computational Biology Industry Revenue (billion) Forecast, by Application 2020 & 2033
- Table 32: India Computational Biology Industry Revenue (billion) Forecast, by Application 2020 & 2033
- Table 33: Australia Computational Biology Industry Revenue (billion) Forecast, by Application 2020 & 2033
- Table 34: South Korea Computational Biology Industry Revenue (billion) Forecast, by Application 2020 & 2033
- Table 35: Rest of Asia Pacific Computational Biology Industry Revenue (billion) Forecast, by Application 2020 & 2033
- Table 36: Global Computational Biology Industry Revenue billion Forecast, by Application 2020 & 2033
- Table 37: Global Computational Biology Industry Revenue billion Forecast, by Tool 2020 & 2033
- Table 38: Global Computational Biology Industry Revenue billion Forecast, by Service 2020 & 2033
- Table 39: Global Computational Biology Industry Revenue billion Forecast, by End-User 2020 & 2033
- Table 40: Global Computational Biology Industry Revenue billion Forecast, by Country 2020 & 2033
- Table 41: GCC Computational Biology Industry Revenue (billion) Forecast, by Application 2020 & 2033
- Table 42: South Africa Computational Biology Industry Revenue (billion) Forecast, by Application 2020 & 2033
- Table 43: Rest of Middle East and Africa Computational Biology Industry Revenue (billion) Forecast, by Application 2020 & 2033
- Table 44: Global Computational Biology Industry Revenue billion Forecast, by Application 2020 & 2033
- Table 45: Global Computational Biology Industry Revenue billion Forecast, by Tool 2020 & 2033
- Table 46: Global Computational Biology Industry Revenue billion Forecast, by Service 2020 & 2033
- Table 47: Global Computational Biology Industry Revenue billion Forecast, by End-User 2020 & 2033
- Table 48: Global Computational Biology Industry Revenue billion Forecast, by Country 2020 & 2033
- Table 49: Brazil Computational Biology Industry Revenue (billion) Forecast, by Application 2020 & 2033
- Table 50: Argentina Computational Biology Industry Revenue (billion) Forecast, by Application 2020 & 2033
- Table 51: Rest of South America Computational Biology Industry Revenue (billion) Forecast, by Application 2020 & 2033
Frequently Asked Questions
1. What is the projected Compound Annual Growth Rate (CAGR) of the Computational Biology Industry?
The projected CAGR is approximately 13.2%.
2. Which companies are prominent players in the Computational Biology Industry?
Key companies in the market include Certara, Nimbus Discovery LLC, Instem Plc (Leadscope Inc ), Strand Life Sciences, Chemical Computing Group ULC, Simulation Plus Inc, Dassault Systèmes SE, Genedata AG, Rosa & Co LLC, Compugen Ltd, Insilico Biotechnology AG, Schrodinger.
3. What are the main segments of the Computational Biology Industry?
The market segments include Application, Tool, Service, End-User.
4. Can you provide details about the market size?
The market size is estimated to be USD 7.18 billion as of 2022.
5. What are some drivers contributing to market growth?
Increase in Bioinformatics Research; Increasing Number of Clinical Studies in Pharmacogenomics and Pharmacokinetics; Growth of Drug Designing and Disease Modeling.
6. What are the notable trends driving market growth?
Industry and Commercials Sub-segment is Expected to hold its Highest Market Share in the End User Segment.
7. Are there any restraints impacting market growth?
Lack of Trained Professionals.
8. Can you provide examples of recent developments in the market?
February 2023: The Centre for Development of Advanced Computing (C-DAC) launched two software tools critical for research in life sciences. Integrated Computing Environment, one of the products, is an indigenous cloud-based genomics computational facility for bioinformatics that integrates ICE-cube, a hardware infrastructure, and ICE flakes. This software will help securely store and analyze petascale to exascale genomics data.
9. What pricing options are available for accessing the report?
Pricing options include single-user, multi-user, and enterprise licenses priced at USD 4750, USD 5250, and USD 8750 respectively.
10. Is the market size provided in terms of value or volume?
The market size is provided in terms of value, measured in billion.
11. Are there any specific market keywords associated with the report?
Yes, the market keyword associated with the report is "Computational Biology Industry," which aids in identifying and referencing the specific market segment covered.
12. How do I determine which pricing option suits my needs best?
The pricing options vary based on user requirements and access needs. Individual users may opt for single-user licenses, while businesses requiring broader access may choose multi-user or enterprise licenses for cost-effective access to the report.
13. Are there any additional resources or data provided in the Computational Biology Industry report?
While the report offers comprehensive insights, it's advisable to review the specific contents or supplementary materials provided to ascertain if additional resources or data are available.
14. How can I stay updated on further developments or reports in the Computational Biology Industry?
To stay informed about further developments, trends, and reports in the Computational Biology Industry, consider subscribing to industry newsletters, following relevant companies and organizations, or regularly checking reputable industry news sources and publications.
Methodology
Step 1 - Identification of Relevant Samples Size from Population Database


Step 2 - Approaches for Defining Global Market Size (Value, Volume* & Price*)

Note*: In applicable scenarios
Step 3 - Data Sources
Primary Research
- Web Analytics
- Survey Reports
- Research Institute
- Latest Research Reports
- Opinion Leaders
Secondary Research
- Annual Reports
- White Paper
- Latest Press Release
- Industry Association
- Paid Database
- Investor Presentations

Step 4 - Data Triangulation
Involves using different sources of information in order to increase the validity of a study
These sources are likely to be stakeholders in a program - participants, other researchers, program staff, other community members, and so on.
Then we put all data in single framework & apply various statistical tools to find out the dynamic on the market.
During the analysis stage, feedback from the stakeholder groups would be compared to determine areas of agreement as well as areas of divergence

