

Key Insights
The Asia-Pacific (APAC) non-woven fabrics market is experiencing robust growth, driven by expanding construction, healthcare, and automotive sectors in the region. The market's sizable and rapidly increasing population, coupled with rising disposable incomes, fuels demand for hygiene products and other non-woven applications. China, India, and Japan are key contributors, representing a significant share of the overall market size. The preference for eco-friendly and sustainable materials is a growing trend, influencing the adoption of bio-component and recycled non-wovens. Technological advancements in spun-bond and wet-laid processes are enhancing product quality and efficiency, while increasing competition among established players and emerging businesses is further stimulating innovation. However, challenges remain, including fluctuations in raw material prices (polyester, polypropylene, etc.) and environmental concerns related to the production and disposal of certain non-woven materials. This necessitates a shift towards sustainable production methods and the development of biodegradable alternatives. The segment showing the fastest growth is likely the healthcare sector, driven by rising infection rates and the need for improved hygiene standards, boosting demand for medical gowns, masks, and wipes. This necessitates increased production capacity and efficient supply chains to meet burgeoning demand within the region.
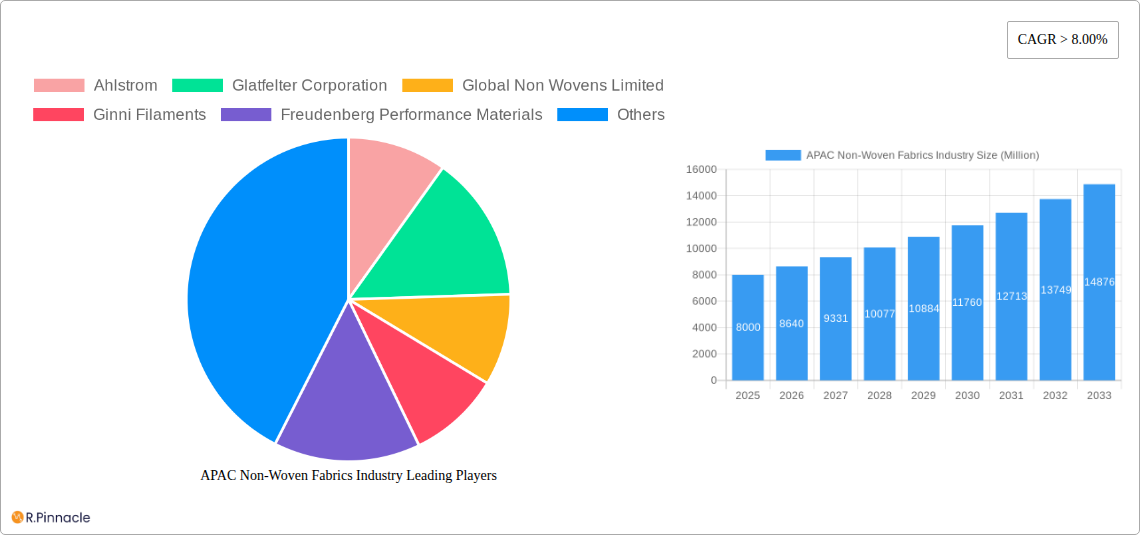
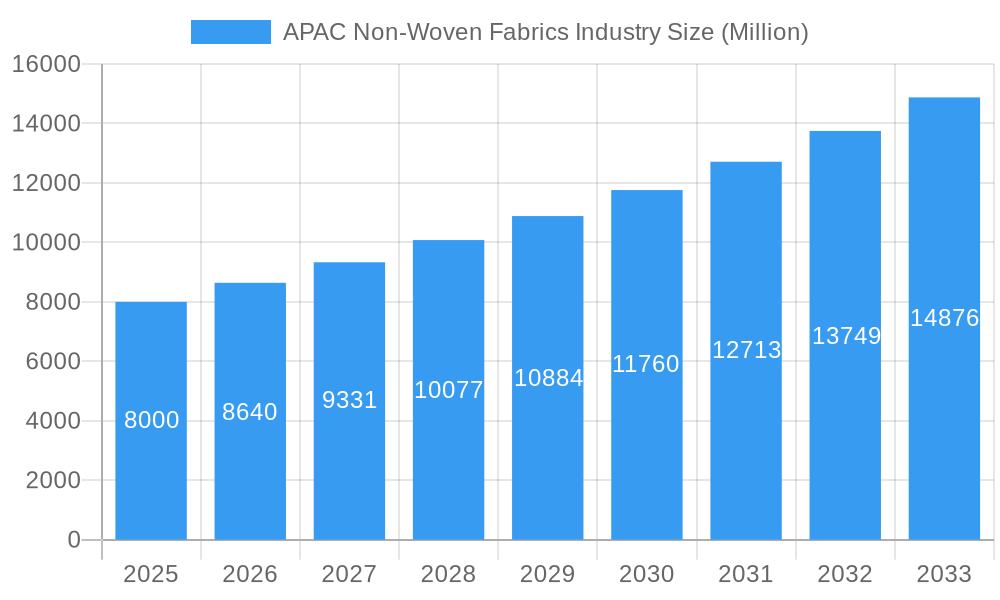
APAC Non-Woven Fabrics Industry Market Size (In Billion)
The market's Compound Annual Growth Rate (CAGR) of over 8% suggests a strong trajectory for continued expansion. The various segments within the APAC non-woven fabrics industry—including spun-bond, wet-laid, and dry-laid technologies; polyester, polypropylene, and other materials; and diverse end-user industries—present varied opportunities for investment and growth. Further research should focus on specific regional differences within APAC, identifying growth potential in less-developed markets and assessing the impact of government policies related to sustainability and industrial development. The increasing adoption of advanced non-woven materials in emerging applications such as filtration and protective apparel also presents significant opportunities for market growth in the coming years. Successful players will need to adapt to changing consumer preferences and technological advancements to remain competitive in this dynamic market.
APAC Non-Woven Fabrics Industry Company Market Share
APAC Non-Woven Fabrics Industry: A Comprehensive Market Report (2019-2033)
This comprehensive report provides an in-depth analysis of the Asia-Pacific (APAC) non-woven fabrics industry, offering valuable insights for industry professionals, investors, and strategic decision-makers. With a focus on market trends, growth drivers, and competitive dynamics, this report covers the period from 2019 to 2033, with a base year of 2025 and a forecast period of 2025-2033. The market size is projected to reach xx Million by 2033.
APAC Non-Woven Fabrics Industry Market Structure & Innovation Trends
This section analyzes the competitive landscape of the APAC non-woven fabrics market, encompassing market concentration, innovation drivers, regulatory frameworks, and mergers and acquisitions (M&A) activities. The market is characterized by a mix of large multinational corporations and smaller regional players. Key players include Ahlstrom, Glatfelter Corporation, Global Non Wovens Limited, Ginni Filaments, Freudenberg Performance Materials, Cygnus Group, Eximius Innovative Pvt Ltd, Fitesa S.A., DuPont, Autotech Nonwovens Pvt Ltd, TORAY INDUSTRIES INC, Johns Manville, Berry Global Inc, and Reliance Non-woven Industry LLC. This list is not exhaustive.
- Market Concentration: The market exhibits moderate concentration, with the top five players holding an estimated xx% market share in 2025. Smaller players compete through specialization and niche applications.
- Innovation Drivers: Key drivers for innovation include the increasing demand for sustainable materials, advancements in material science leading to improved performance characteristics, and the development of new applications across various end-use industries.
- Regulatory Frameworks: Government regulations regarding environmental sustainability and product safety are shaping industry practices and influencing material selection.
- Product Substitutes: The industry faces competition from alternative materials like natural fibers and recycled materials in specific applications.
- End-User Demographics: Growth is driven by rising populations, increasing disposable incomes, and changing consumer preferences in key APAC markets.
- M&A Activities: The past five years have witnessed several M&A deals, with a total value estimated at xx Million. These deals primarily focused on expanding production capacity and market reach.
APAC Non-Woven Fabrics Industry Market Dynamics & Trends
The APAC non-woven fabrics market is on a trajectory of significant expansion, propelled by a confluence of powerful growth drivers and evolving market dynamics. The robust demand emanating from pivotal sectors such as construction, where enhanced performance and cost-efficiency are paramount, and the healthcare industry, driven by an ever-increasing need for hygiene and disposable medical supplies, are key catalysts. Furthermore, the automotive sector's adoption of lightweight and versatile non-woven materials for interiors, insulation, and filtration is contributing substantially to this growth. The market is projected to witness a Compound Annual Growth Rate (CAGR) of approximately XX% between 2025 and 2033, signaling a period of sustained upward momentum. Emerging economies within the APAC region are anticipated to play a pivotal role in this expansion, with increasing market penetration fueled by burgeoning industrialization and rising disposable incomes.
Technological advancements are at the forefront of shaping this dynamic landscape. The integration of advanced fiber technologies, leading to materials with superior properties, and the widespread adoption of automation in manufacturing processes are enhancing production efficiency, reducing costs, and enabling the creation of novel non-woven products. In tandem with technological progress, a significant shift in consumer preferences towards sustainability and eco-friendly alternatives is creating new avenues for growth. This trend is directly driving the demand for bio-component and recycled materials, pushing manufacturers to innovate in material sourcing and product development. The competitive environment is characterized by intense rivalry among established global players and agile new entrants, fostering an atmosphere of continuous innovation and strategic market positioning.
Dominant Regions & Segments in APAC Non-Woven Fabrics Industry
This section provides an in-depth analysis of the leading geographical areas and the most impactful segments within the dynamic APAC non-woven fabrics market. Understanding these dominant forces is crucial for strategic planning and market entry.
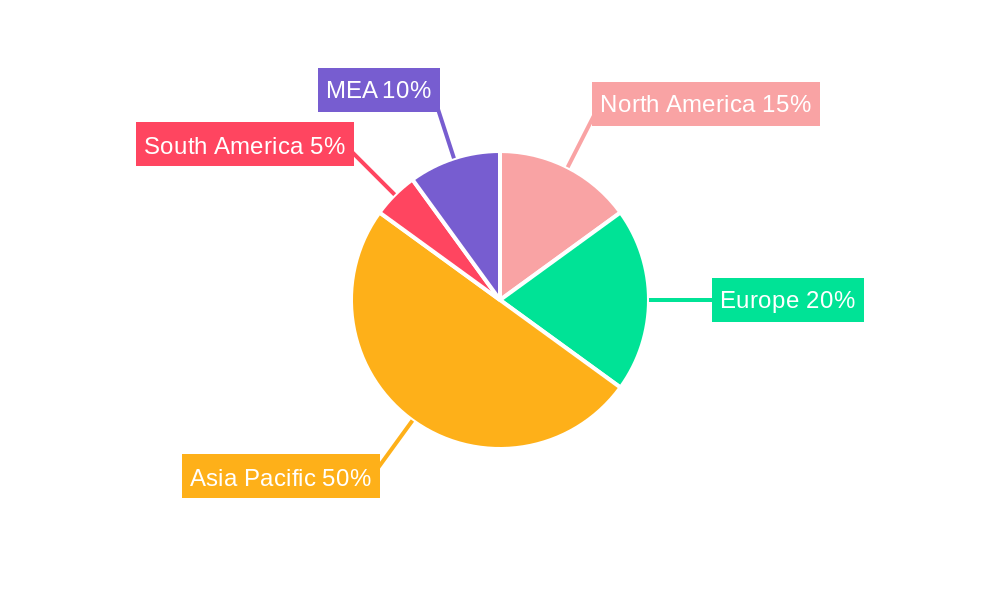
Dominant Regions: The market's epicenter of influence resides in China, a powerhouse driven by its extensive manufacturing capabilities and substantial industrial output. Close on its heels are India, experiencing rapid industrialization and infrastructure development, and a collective of other Southeast Asian countries, collectively contributing to the region's overall dominance. This widespread industrial growth and ambitious infrastructure development projects are the primary engines powering demand in these leading regions.
Dominant Segments:
- Technology: The Spun-bond technology stands as the most dominant segment. Its widespread adoption is attributed to its inherent versatility, enabling the production of a broad spectrum of non-woven fabrics with varying properties, coupled with its significant cost-effectiveness.
- Material: Polypropylene (PP) reigns supreme as the leading material. Its dominance is a testament to its exceptional balance of strength, durability, and affordability, making it the material of choice for a multitude of applications.
- End-User Industry: The healthcare sector, with its continuous demand for sterile and disposable products, and the automotive industry, increasingly leveraging non-wovens for lightweighting and performance enhancement, are identified as the major growth drivers, dictating significant market demand.
Key Drivers:
- Economic Policies: Proactive government incentives aimed at stimulating infrastructure development and fostering industrial growth are playing a critical role in bolstering demand across numerous APAC economies.
- Infrastructure: The continuous and expansive infrastructure development projects underway throughout the APAC region are a significant propellant for the non-woven fabrics market, especially within the construction and allied industries.
APAC Non-Woven Fabrics Industry Product Innovations
Recent innovations include the development of biodegradable and compostable non-woven fabrics, advanced filtration materials, and high-performance materials for specialized applications. These innovations cater to growing environmental concerns and address the need for enhanced product functionalities in various sectors like hygiene and automotive. Competition is driving innovation in material science, manufacturing processes, and product design.
Report Scope & Segmentation Analysis
This report segments the APAC non-woven fabrics market based on technology (spun-bond, wet-laid, dry-laid, others), material (polyester, polypropylene, polyethylene, rayon, others), and end-user industry (construction, textiles, healthcare, automotive, others). Each segment's growth trajectory is analyzed, considering market size, competitive dynamics, and future projections. The market is expected to witness significant growth across all segments, with variations based on regional and technological factors.
Key Drivers of APAC Non-Woven Fabrics Industry Growth
Growth is driven by rapid industrialization and urbanization across APAC. The increasing demand for hygiene products, automotive components, and construction materials fuels this growth. Technological advancements such as the development of sustainable materials and improved manufacturing processes further accelerate market expansion. Favorable government policies and infrastructure investments also contribute significantly.
Challenges in the APAC Non-Woven Fabrics Industry Sector
The industry faces challenges such as fluctuating raw material prices, intense competition, and stringent environmental regulations. Supply chain disruptions and the impact of global economic uncertainty also pose significant risks. These factors can impact profitability and overall market growth.
Emerging Opportunities in APAC Non-Woven Fabrics Industry
The APAC non-woven fabrics industry is ripe with burgeoning opportunities, presenting significant avenues for innovation and market expansion. A primary driver is the escalating demand for sustainable and eco-friendly non-woven fabrics, fueled by increasing environmental consciousness among consumers and stricter regulatory frameworks. This trend is spurring innovation in the development and utilization of biodegradable, compostable, and recycled materials. Concurrently, the continuous expansion of the healthcare sector across the region, driven by an aging population, rising healthcare expenditure, and a persistent need for advanced medical textiles and hygiene products, presents substantial growth potential.
Furthermore, the rise of innovative applications in personal care and consumer goods is opening new market frontiers. This includes specialized non-woven fabrics for premium feminine hygiene products, advanced baby diapers, and sophisticated home textiles. The increasing adoption of cutting-edge technologies, such as nanotechnology, offers transformative potential for creating high-performance non-woven materials with unique functionalities, such as enhanced filtration, antimicrobial properties, and superior barrier protection. These advancements are paving the way for novel applications and premium product offerings, driving future growth and market differentiation.
Leading Players in the APAC Non-Woven Fabrics Industry Market
- Ahlstrom
- Glatfelter Corporation
- Global Non Wovens Limited
- Ginni Filaments
- Freudenberg Performance Materials
- Cygnus Group
- Eximius Innovative Pvt Ltd
- Fitesa S.A.
- DuPont
- Autotech Nonwovens Pvt Ltd
- TORAY INDUSTRIES INC
- Johns Manville
- Berry Global Inc
- Reliance Non-woven Industry LLC
Key Developments in APAC Non-Woven Fabrics Industry
- November 2022: Fitesa announced the expansion of its production capacity for nonwoven fabrics for medical applications. This signifies a significant investment in meeting growing demand within the healthcare sector.
Future Outlook for APAC Non-Woven Fabrics Industry Market
The APAC non-woven fabrics market is exceptionally well-positioned for sustained and robust growth in the foreseeable future. This optimistic outlook is underpinned by a potent combination of increasing demand across a diverse range of end-use sectors and the relentless pace of technological advancements. Strategic investments will be paramount for companies aiming for enduring success. Focus on sustainable materials, including the development and wider adoption of bio-based and recycled feedstocks, will not only align with global environmental imperatives but also unlock new market segments and consumer loyalty. Simultaneously, innovation in advanced manufacturing processes, such as improved melt-blown techniques and novel bonding technologies, will be critical for enhancing product performance, reducing manufacturing costs, and enabling the creation of specialized, high-value non-woven solutions. The overarching trend towards eco-friendly solutions is not merely a market segment but a fundamental industry shift that will continue to shape the trajectory of the APAC non-woven fabrics market, driving innovation, influencing investment decisions, and defining competitive advantages for years to come.
APAC Non-Woven Fabrics Industry Segmentation
-
1. Technology
- 1.1. Spun-Bond
- 1.2. Wet Laid
- 1.3. Dry Laid
- 1.4. Others (Electrostatic spinning, Flash-spun, etc.)
-
2. Material
- 2.1. Polyester
- 2.2. Polypropylene
- 2.3. Polyethylene
- 2.4. Rayon
- 2.5. Others (Wood Pulp, Bio-Component, etc.)
-
3. End-User Industry
- 3.1. Construction
- 3.2. Textiles
- 3.3. Healthcare
- 3.4. Automotive
- 3.5. Others (Personal Care, Consumer Goods, etc.)
-
4. Geography
- 4.1. China
- 4.2. India
- 4.3. Japan
- 4.4. South Korea
- 4.5. Indonesia
- 4.6. Malaysia
- 4.7. Thailand
- 4.8. Vietnam
- 4.9. Rest of Asia-Pacific
APAC Non-Woven Fabrics Industry Segmentation By Geography
- 1. China
- 2. India
- 3. Japan
- 4. South Korea
- 5. Indonesia
- 6. Malaysia
- 7. Thailand
- 8. Vietnam
- 9. Rest of Asia Pacific
APAC Non-Woven Fabrics Industry Regional Market Share
Geographic Coverage of APAC Non-Woven Fabrics Industry
APAC Non-Woven Fabrics Industry REPORT HIGHLIGHTS
| Aspects | Details |
|---|---|
| Study Period | 2020-2034 |
| Base Year | 2025 |
| Estimated Year | 2026 |
| Forecast Period | 2026-2034 |
| Historical Period | 2020-2025 |
| Growth Rate | CAGR of > 8.00% from 2020-2034 |
| Segmentation |
|
Table of Contents
- 1. Introduction
- 1.1. Research Scope
- 1.2. Market Segmentation
- 1.3. Research Objective
- 1.4. Definitions and Assumptions
- 2. Executive Summary
- 2.1. Market Snapshot
- 3. Market Dynamics
- 3.1. Market Drivers
- 3.2. Market Restrains
- 3.3. Market Trends
- 3.4. Market Opportunities
- 4. Market Factor Analysis
- 4.1. Porters Five Forces
- 4.1.1. Bargaining Power of Suppliers
- 4.1.2. Bargaining Power of Buyers
- 4.1.3. Threat of New Entrants
- 4.1.4. Threat of Substitutes
- 4.1.5. Competitive Rivalry
- 4.2. PESTEL analysis
- 4.3. BCG Analysis
- 4.3.1. Stars (High Growth, High Market Share)
- 4.3.2. Cash Cows (Low Growth, High Market Share)
- 4.3.3. Question Mark (High Growth, Low Market Share)
- 4.3.4. Dogs (Low Growth, Low Market Share)
- 4.4. Ansoff Matrix Analysis
- 4.5. Supply Chain Analysis
- 4.6. Regulatory Landscape
- 4.7. Current Market Potential and Opportunity Assessment (TAM–SAM–SOM Framework)
- 4.8. PRI Analyst Note
- 4.1. Porters Five Forces
- 5. Market Analysis, Insights and Forecast 2021-2033
- 5.1. Market Analysis, Insights and Forecast - by Technology
- 5.1.1. Spun-Bond
- 5.1.2. Wet Laid
- 5.1.3. Dry Laid
- 5.1.4. Others (Electrostatic spinning, Flash-spun, etc.)
- 5.2. Market Analysis, Insights and Forecast - by Material
- 5.2.1. Polyester
- 5.2.2. Polypropylene
- 5.2.3. Polyethylene
- 5.2.4. Rayon
- 5.2.5. Others (Wood Pulp, Bio-Component, etc.)
- 5.3. Market Analysis, Insights and Forecast - by End-User Industry
- 5.3.1. Construction
- 5.3.2. Textiles
- 5.3.3. Healthcare
- 5.3.4. Automotive
- 5.3.5. Others (Personal Care, Consumer Goods, etc.)
- 5.4. Market Analysis, Insights and Forecast - by Geography
- 5.4.1. China
- 5.4.2. India
- 5.4.3. Japan
- 5.4.4. South Korea
- 5.4.5. Indonesia
- 5.4.6. Malaysia
- 5.4.7. Thailand
- 5.4.8. Vietnam
- 5.4.9. Rest of Asia-Pacific
- 5.5. Market Analysis, Insights and Forecast - by Region
- 5.5.1. China
- 5.5.2. India
- 5.5.3. Japan
- 5.5.4. South Korea
- 5.5.5. Indonesia
- 5.5.6. Malaysia
- 5.5.7. Thailand
- 5.5.8. Vietnam
- 5.5.9. Rest of Asia Pacific
- 5.1. Market Analysis, Insights and Forecast - by Technology
- 6. Global APAC Non-Woven Fabrics Industry Analysis, Insights and Forecast, 2021-2033
- 6.1. Market Analysis, Insights and Forecast - by Technology
- 6.1.1. Spun-Bond
- 6.1.2. Wet Laid
- 6.1.3. Dry Laid
- 6.1.4. Others (Electrostatic spinning, Flash-spun, etc.)
- 6.2. Market Analysis, Insights and Forecast - by Material
- 6.2.1. Polyester
- 6.2.2. Polypropylene
- 6.2.3. Polyethylene
- 6.2.4. Rayon
- 6.2.5. Others (Wood Pulp, Bio-Component, etc.)
- 6.3. Market Analysis, Insights and Forecast - by End-User Industry
- 6.3.1. Construction
- 6.3.2. Textiles
- 6.3.3. Healthcare
- 6.3.4. Automotive
- 6.3.5. Others (Personal Care, Consumer Goods, etc.)
- 6.4. Market Analysis, Insights and Forecast - by Geography
- 6.4.1. China
- 6.4.2. India
- 6.4.3. Japan
- 6.4.4. South Korea
- 6.4.5. Indonesia
- 6.4.6. Malaysia
- 6.4.7. Thailand
- 6.4.8. Vietnam
- 6.4.9. Rest of Asia-Pacific
- 6.1. Market Analysis, Insights and Forecast - by Technology
- 7. China APAC Non-Woven Fabrics Industry Analysis, Insights and Forecast, 2020-2032
- 7.1. Market Analysis, Insights and Forecast - by Technology
- 7.1.1. Spun-Bond
- 7.1.2. Wet Laid
- 7.1.3. Dry Laid
- 7.1.4. Others (Electrostatic spinning, Flash-spun, etc.)
- 7.2. Market Analysis, Insights and Forecast - by Material
- 7.2.1. Polyester
- 7.2.2. Polypropylene
- 7.2.3. Polyethylene
- 7.2.4. Rayon
- 7.2.5. Others (Wood Pulp, Bio-Component, etc.)
- 7.3. Market Analysis, Insights and Forecast - by End-User Industry
- 7.3.1. Construction
- 7.3.2. Textiles
- 7.3.3. Healthcare
- 7.3.4. Automotive
- 7.3.5. Others (Personal Care, Consumer Goods, etc.)
- 7.4. Market Analysis, Insights and Forecast - by Geography
- 7.4.1. China
- 7.4.2. India
- 7.4.3. Japan
- 7.4.4. South Korea
- 7.4.5. Indonesia
- 7.4.6. Malaysia
- 7.4.7. Thailand
- 7.4.8. Vietnam
- 7.4.9. Rest of Asia-Pacific
- 7.1. Market Analysis, Insights and Forecast - by Technology
- 8. India APAC Non-Woven Fabrics Industry Analysis, Insights and Forecast, 2020-2032
- 8.1. Market Analysis, Insights and Forecast - by Technology
- 8.1.1. Spun-Bond
- 8.1.2. Wet Laid
- 8.1.3. Dry Laid
- 8.1.4. Others (Electrostatic spinning, Flash-spun, etc.)
- 8.2. Market Analysis, Insights and Forecast - by Material
- 8.2.1. Polyester
- 8.2.2. Polypropylene
- 8.2.3. Polyethylene
- 8.2.4. Rayon
- 8.2.5. Others (Wood Pulp, Bio-Component, etc.)
- 8.3. Market Analysis, Insights and Forecast - by End-User Industry
- 8.3.1. Construction
- 8.3.2. Textiles
- 8.3.3. Healthcare
- 8.3.4. Automotive
- 8.3.5. Others (Personal Care, Consumer Goods, etc.)
- 8.4. Market Analysis, Insights and Forecast - by Geography
- 8.4.1. China
- 8.4.2. India
- 8.4.3. Japan
- 8.4.4. South Korea
- 8.4.5. Indonesia
- 8.4.6. Malaysia
- 8.4.7. Thailand
- 8.4.8. Vietnam
- 8.4.9. Rest of Asia-Pacific
- 8.1. Market Analysis, Insights and Forecast - by Technology
- 9. Japan APAC Non-Woven Fabrics Industry Analysis, Insights and Forecast, 2020-2032
- 9.1. Market Analysis, Insights and Forecast - by Technology
- 9.1.1. Spun-Bond
- 9.1.2. Wet Laid
- 9.1.3. Dry Laid
- 9.1.4. Others (Electrostatic spinning, Flash-spun, etc.)
- 9.2. Market Analysis, Insights and Forecast - by Material
- 9.2.1. Polyester
- 9.2.2. Polypropylene
- 9.2.3. Polyethylene
- 9.2.4. Rayon
- 9.2.5. Others (Wood Pulp, Bio-Component, etc.)
- 9.3. Market Analysis, Insights and Forecast - by End-User Industry
- 9.3.1. Construction
- 9.3.2. Textiles
- 9.3.3. Healthcare
- 9.3.4. Automotive
- 9.3.5. Others (Personal Care, Consumer Goods, etc.)
- 9.4. Market Analysis, Insights and Forecast - by Geography
- 9.4.1. China
- 9.4.2. India
- 9.4.3. Japan
- 9.4.4. South Korea
- 9.4.5. Indonesia
- 9.4.6. Malaysia
- 9.4.7. Thailand
- 9.4.8. Vietnam
- 9.4.9. Rest of Asia-Pacific
- 9.1. Market Analysis, Insights and Forecast - by Technology
- 10. South Korea APAC Non-Woven Fabrics Industry Analysis, Insights and Forecast, 2020-2032
- 10.1. Market Analysis, Insights and Forecast - by Technology
- 10.1.1. Spun-Bond
- 10.1.2. Wet Laid
- 10.1.3. Dry Laid
- 10.1.4. Others (Electrostatic spinning, Flash-spun, etc.)
- 10.2. Market Analysis, Insights and Forecast - by Material
- 10.2.1. Polyester
- 10.2.2. Polypropylene
- 10.2.3. Polyethylene
- 10.2.4. Rayon
- 10.2.5. Others (Wood Pulp, Bio-Component, etc.)
- 10.3. Market Analysis, Insights and Forecast - by End-User Industry
- 10.3.1. Construction
- 10.3.2. Textiles
- 10.3.3. Healthcare
- 10.3.4. Automotive
- 10.3.5. Others (Personal Care, Consumer Goods, etc.)
- 10.4. Market Analysis, Insights and Forecast - by Geography
- 10.4.1. China
- 10.4.2. India
- 10.4.3. Japan
- 10.4.4. South Korea
- 10.4.5. Indonesia
- 10.4.6. Malaysia
- 10.4.7. Thailand
- 10.4.8. Vietnam
- 10.4.9. Rest of Asia-Pacific
- 10.1. Market Analysis, Insights and Forecast - by Technology
- 11. Indonesia APAC Non-Woven Fabrics Industry Analysis, Insights and Forecast, 2020-2032
- 11.1. Market Analysis, Insights and Forecast - by Technology
- 11.1.1. Spun-Bond
- 11.1.2. Wet Laid
- 11.1.3. Dry Laid
- 11.1.4. Others (Electrostatic spinning, Flash-spun, etc.)
- 11.2. Market Analysis, Insights and Forecast - by Material
- 11.2.1. Polyester
- 11.2.2. Polypropylene
- 11.2.3. Polyethylene
- 11.2.4. Rayon
- 11.2.5. Others (Wood Pulp, Bio-Component, etc.)
- 11.3. Market Analysis, Insights and Forecast - by End-User Industry
- 11.3.1. Construction
- 11.3.2. Textiles
- 11.3.3. Healthcare
- 11.3.4. Automotive
- 11.3.5. Others (Personal Care, Consumer Goods, etc.)
- 11.4. Market Analysis, Insights and Forecast - by Geography
- 11.4.1. China
- 11.4.2. India
- 11.4.3. Japan
- 11.4.4. South Korea
- 11.4.5. Indonesia
- 11.4.6. Malaysia
- 11.4.7. Thailand
- 11.4.8. Vietnam
- 11.4.9. Rest of Asia-Pacific
- 11.1. Market Analysis, Insights and Forecast - by Technology
- 12. Malaysia APAC Non-Woven Fabrics Industry Analysis, Insights and Forecast, 2020-2032
- 12.1. Market Analysis, Insights and Forecast - by Technology
- 12.1.1. Spun-Bond
- 12.1.2. Wet Laid
- 12.1.3. Dry Laid
- 12.1.4. Others (Electrostatic spinning, Flash-spun, etc.)
- 12.2. Market Analysis, Insights and Forecast - by Material
- 12.2.1. Polyester
- 12.2.2. Polypropylene
- 12.2.3. Polyethylene
- 12.2.4. Rayon
- 12.2.5. Others (Wood Pulp, Bio-Component, etc.)
- 12.3. Market Analysis, Insights and Forecast - by End-User Industry
- 12.3.1. Construction
- 12.3.2. Textiles
- 12.3.3. Healthcare
- 12.3.4. Automotive
- 12.3.5. Others (Personal Care, Consumer Goods, etc.)
- 12.4. Market Analysis, Insights and Forecast - by Geography
- 12.4.1. China
- 12.4.2. India
- 12.4.3. Japan
- 12.4.4. South Korea
- 12.4.5. Indonesia
- 12.4.6. Malaysia
- 12.4.7. Thailand
- 12.4.8. Vietnam
- 12.4.9. Rest of Asia-Pacific
- 12.1. Market Analysis, Insights and Forecast - by Technology
- 13. Thailand APAC Non-Woven Fabrics Industry Analysis, Insights and Forecast, 2020-2032
- 13.1. Market Analysis, Insights and Forecast - by Technology
- 13.1.1. Spun-Bond
- 13.1.2. Wet Laid
- 13.1.3. Dry Laid
- 13.1.4. Others (Electrostatic spinning, Flash-spun, etc.)
- 13.2. Market Analysis, Insights and Forecast - by Material
- 13.2.1. Polyester
- 13.2.2. Polypropylene
- 13.2.3. Polyethylene
- 13.2.4. Rayon
- 13.2.5. Others (Wood Pulp, Bio-Component, etc.)
- 13.3. Market Analysis, Insights and Forecast - by End-User Industry
- 13.3.1. Construction
- 13.3.2. Textiles
- 13.3.3. Healthcare
- 13.3.4. Automotive
- 13.3.5. Others (Personal Care, Consumer Goods, etc.)
- 13.4. Market Analysis, Insights and Forecast - by Geography
- 13.4.1. China
- 13.4.2. India
- 13.4.3. Japan
- 13.4.4. South Korea
- 13.4.5. Indonesia
- 13.4.6. Malaysia
- 13.4.7. Thailand
- 13.4.8. Vietnam
- 13.4.9. Rest of Asia-Pacific
- 13.1. Market Analysis, Insights and Forecast - by Technology
- 14. Vietnam APAC Non-Woven Fabrics Industry Analysis, Insights and Forecast, 2020-2032
- 14.1. Market Analysis, Insights and Forecast - by Technology
- 14.1.1. Spun-Bond
- 14.1.2. Wet Laid
- 14.1.3. Dry Laid
- 14.1.4. Others (Electrostatic spinning, Flash-spun, etc.)
- 14.2. Market Analysis, Insights and Forecast - by Material
- 14.2.1. Polyester
- 14.2.2. Polypropylene
- 14.2.3. Polyethylene
- 14.2.4. Rayon
- 14.2.5. Others (Wood Pulp, Bio-Component, etc.)
- 14.3. Market Analysis, Insights and Forecast - by End-User Industry
- 14.3.1. Construction
- 14.3.2. Textiles
- 14.3.3. Healthcare
- 14.3.4. Automotive
- 14.3.5. Others (Personal Care, Consumer Goods, etc.)
- 14.4. Market Analysis, Insights and Forecast - by Geography
- 14.4.1. China
- 14.4.2. India
- 14.4.3. Japan
- 14.4.4. South Korea
- 14.4.5. Indonesia
- 14.4.6. Malaysia
- 14.4.7. Thailand
- 14.4.8. Vietnam
- 14.4.9. Rest of Asia-Pacific
- 14.1. Market Analysis, Insights and Forecast - by Technology
- 15. Rest of Asia Pacific APAC Non-Woven Fabrics Industry Analysis, Insights and Forecast, 2020-2032
- 15.1. Market Analysis, Insights and Forecast - by Technology
- 15.1.1. Spun-Bond
- 15.1.2. Wet Laid
- 15.1.3. Dry Laid
- 15.1.4. Others (Electrostatic spinning, Flash-spun, etc.)
- 15.2. Market Analysis, Insights and Forecast - by Material
- 15.2.1. Polyester
- 15.2.2. Polypropylene
- 15.2.3. Polyethylene
- 15.2.4. Rayon
- 15.2.5. Others (Wood Pulp, Bio-Component, etc.)
- 15.3. Market Analysis, Insights and Forecast - by End-User Industry
- 15.3.1. Construction
- 15.3.2. Textiles
- 15.3.3. Healthcare
- 15.3.4. Automotive
- 15.3.5. Others (Personal Care, Consumer Goods, etc.)
- 15.4. Market Analysis, Insights and Forecast - by Geography
- 15.4.1. China
- 15.4.2. India
- 15.4.3. Japan
- 15.4.4. South Korea
- 15.4.5. Indonesia
- 15.4.6. Malaysia
- 15.4.7. Thailand
- 15.4.8. Vietnam
- 15.4.9. Rest of Asia-Pacific
- 15.1. Market Analysis, Insights and Forecast - by Technology
- 16. Competitive Analysis
- 16.1. Company Profiles
- 16.1.1 Ahlstrom
- 16.1.1.1. Company Overview
- 16.1.1.2. Products
- 16.1.1.3. Company Financials
- 16.1.1.4. SWOT Analysis
- 16.1.2 Glatfelter Corporation
- 16.1.2.1. Company Overview
- 16.1.2.2. Products
- 16.1.2.3. Company Financials
- 16.1.2.4. SWOT Analysis
- 16.1.3 Global Non Wovens Limited
- 16.1.3.1. Company Overview
- 16.1.3.2. Products
- 16.1.3.3. Company Financials
- 16.1.3.4. SWOT Analysis
- 16.1.4 Ginni Filaments
- 16.1.4.1. Company Overview
- 16.1.4.2. Products
- 16.1.4.3. Company Financials
- 16.1.4.4. SWOT Analysis
- 16.1.5 Freudenberg Performance Materials
- 16.1.5.1. Company Overview
- 16.1.5.2. Products
- 16.1.5.3. Company Financials
- 16.1.5.4. SWOT Analysis
- 16.1.6 Cygnus Group
- 16.1.6.1. Company Overview
- 16.1.6.2. Products
- 16.1.6.3. Company Financials
- 16.1.6.4. SWOT Analysis
- 16.1.7 Eximius Innovative Pvt Ltd
- 16.1.7.1. Company Overview
- 16.1.7.2. Products
- 16.1.7.3. Company Financials
- 16.1.7.4. SWOT Analysis
- 16.1.8 Fitesa S A
- 16.1.8.1. Company Overview
- 16.1.8.2. Products
- 16.1.8.3. Company Financials
- 16.1.8.4. SWOT Analysis
- 16.1.9 DuPont
- 16.1.9.1. Company Overview
- 16.1.9.2. Products
- 16.1.9.3. Company Financials
- 16.1.9.4. SWOT Analysis
- 16.1.10 Autotech Nonwovens Pvt Ltd
- 16.1.10.1. Company Overview
- 16.1.10.2. Products
- 16.1.10.3. Company Financials
- 16.1.10.4. SWOT Analysis
- 16.1.11 TORAY INDUSTRIES INC *List Not Exhaustive
- 16.1.11.1. Company Overview
- 16.1.11.2. Products
- 16.1.11.3. Company Financials
- 16.1.11.4. SWOT Analysis
- 16.1.12 Johns Manville
- 16.1.12.1. Company Overview
- 16.1.12.2. Products
- 16.1.12.3. Company Financials
- 16.1.12.4. SWOT Analysis
- 16.1.13 Berry Global Inc
- 16.1.13.1. Company Overview
- 16.1.13.2. Products
- 16.1.13.3. Company Financials
- 16.1.13.4. SWOT Analysis
- 16.1.14 Reliance Non-woven Industry LLC
- 16.1.14.1. Company Overview
- 16.1.14.2. Products
- 16.1.14.3. Company Financials
- 16.1.14.4. SWOT Analysis
- 16.1.1 Ahlstrom
- 16.2. Market Entropy
- 16.2.1 Company's Key Areas Served
- 16.2.2 Recent Developments
- 16.3. Company Market Share Analysis 2025
- 16.3.1 Top 5 Companies Market Share Analysis
- 16.3.2 Top 3 Companies Market Share Analysis
- 16.4. List of Potential Customers
- 17. Research Methodology
List of Figures
- Figure 1: Global APAC Non-Woven Fabrics Industry Revenue Breakdown (Million, %) by Region 2025 & 2033
- Figure 2: Global APAC Non-Woven Fabrics Industry Volume Breakdown (K Tons, %) by Region 2025 & 2033
- Figure 3: China APAC Non-Woven Fabrics Industry Revenue (Million), by Technology 2025 & 2033
- Figure 4: China APAC Non-Woven Fabrics Industry Volume (K Tons), by Technology 2025 & 2033
- Figure 5: China APAC Non-Woven Fabrics Industry Revenue Share (%), by Technology 2025 & 2033
- Figure 6: China APAC Non-Woven Fabrics Industry Volume Share (%), by Technology 2025 & 2033
- Figure 7: China APAC Non-Woven Fabrics Industry Revenue (Million), by Material 2025 & 2033
- Figure 8: China APAC Non-Woven Fabrics Industry Volume (K Tons), by Material 2025 & 2033
- Figure 9: China APAC Non-Woven Fabrics Industry Revenue Share (%), by Material 2025 & 2033
- Figure 10: China APAC Non-Woven Fabrics Industry Volume Share (%), by Material 2025 & 2033
- Figure 11: China APAC Non-Woven Fabrics Industry Revenue (Million), by End-User Industry 2025 & 2033
- Figure 12: China APAC Non-Woven Fabrics Industry Volume (K Tons), by End-User Industry 2025 & 2033
- Figure 13: China APAC Non-Woven Fabrics Industry Revenue Share (%), by End-User Industry 2025 & 2033
- Figure 14: China APAC Non-Woven Fabrics Industry Volume Share (%), by End-User Industry 2025 & 2033
- Figure 15: China APAC Non-Woven Fabrics Industry Revenue (Million), by Geography 2025 & 2033
- Figure 16: China APAC Non-Woven Fabrics Industry Volume (K Tons), by Geography 2025 & 2033
- Figure 17: China APAC Non-Woven Fabrics Industry Revenue Share (%), by Geography 2025 & 2033
- Figure 18: China APAC Non-Woven Fabrics Industry Volume Share (%), by Geography 2025 & 2033
- Figure 19: China APAC Non-Woven Fabrics Industry Revenue (Million), by Country 2025 & 2033
- Figure 20: China APAC Non-Woven Fabrics Industry Volume (K Tons), by Country 2025 & 2033
- Figure 21: China APAC Non-Woven Fabrics Industry Revenue Share (%), by Country 2025 & 2033
- Figure 22: China APAC Non-Woven Fabrics Industry Volume Share (%), by Country 2025 & 2033
- Figure 23: India APAC Non-Woven Fabrics Industry Revenue (Million), by Technology 2025 & 2033
- Figure 24: India APAC Non-Woven Fabrics Industry Volume (K Tons), by Technology 2025 & 2033
- Figure 25: India APAC Non-Woven Fabrics Industry Revenue Share (%), by Technology 2025 & 2033
- Figure 26: India APAC Non-Woven Fabrics Industry Volume Share (%), by Technology 2025 & 2033
- Figure 27: India APAC Non-Woven Fabrics Industry Revenue (Million), by Material 2025 & 2033
- Figure 28: India APAC Non-Woven Fabrics Industry Volume (K Tons), by Material 2025 & 2033
- Figure 29: India APAC Non-Woven Fabrics Industry Revenue Share (%), by Material 2025 & 2033
- Figure 30: India APAC Non-Woven Fabrics Industry Volume Share (%), by Material 2025 & 2033
- Figure 31: India APAC Non-Woven Fabrics Industry Revenue (Million), by End-User Industry 2025 & 2033
- Figure 32: India APAC Non-Woven Fabrics Industry Volume (K Tons), by End-User Industry 2025 & 2033
- Figure 33: India APAC Non-Woven Fabrics Industry Revenue Share (%), by End-User Industry 2025 & 2033
- Figure 34: India APAC Non-Woven Fabrics Industry Volume Share (%), by End-User Industry 2025 & 2033
- Figure 35: India APAC Non-Woven Fabrics Industry Revenue (Million), by Geography 2025 & 2033
- Figure 36: India APAC Non-Woven Fabrics Industry Volume (K Tons), by Geography 2025 & 2033
- Figure 37: India APAC Non-Woven Fabrics Industry Revenue Share (%), by Geography 2025 & 2033
- Figure 38: India APAC Non-Woven Fabrics Industry Volume Share (%), by Geography 2025 & 2033
- Figure 39: India APAC Non-Woven Fabrics Industry Revenue (Million), by Country 2025 & 2033
- Figure 40: India APAC Non-Woven Fabrics Industry Volume (K Tons), by Country 2025 & 2033
- Figure 41: India APAC Non-Woven Fabrics Industry Revenue Share (%), by Country 2025 & 2033
- Figure 42: India APAC Non-Woven Fabrics Industry Volume Share (%), by Country 2025 & 2033
- Figure 43: Japan APAC Non-Woven Fabrics Industry Revenue (Million), by Technology 2025 & 2033
- Figure 44: Japan APAC Non-Woven Fabrics Industry Volume (K Tons), by Technology 2025 & 2033
- Figure 45: Japan APAC Non-Woven Fabrics Industry Revenue Share (%), by Technology 2025 & 2033
- Figure 46: Japan APAC Non-Woven Fabrics Industry Volume Share (%), by Technology 2025 & 2033
- Figure 47: Japan APAC Non-Woven Fabrics Industry Revenue (Million), by Material 2025 & 2033
- Figure 48: Japan APAC Non-Woven Fabrics Industry Volume (K Tons), by Material 2025 & 2033
- Figure 49: Japan APAC Non-Woven Fabrics Industry Revenue Share (%), by Material 2025 & 2033
- Figure 50: Japan APAC Non-Woven Fabrics Industry Volume Share (%), by Material 2025 & 2033
- Figure 51: Japan APAC Non-Woven Fabrics Industry Revenue (Million), by End-User Industry 2025 & 2033
- Figure 52: Japan APAC Non-Woven Fabrics Industry Volume (K Tons), by End-User Industry 2025 & 2033
- Figure 53: Japan APAC Non-Woven Fabrics Industry Revenue Share (%), by End-User Industry 2025 & 2033
- Figure 54: Japan APAC Non-Woven Fabrics Industry Volume Share (%), by End-User Industry 2025 & 2033
- Figure 55: Japan APAC Non-Woven Fabrics Industry Revenue (Million), by Geography 2025 & 2033
- Figure 56: Japan APAC Non-Woven Fabrics Industry Volume (K Tons), by Geography 2025 & 2033
- Figure 57: Japan APAC Non-Woven Fabrics Industry Revenue Share (%), by Geography 2025 & 2033
- Figure 58: Japan APAC Non-Woven Fabrics Industry Volume Share (%), by Geography 2025 & 2033
- Figure 59: Japan APAC Non-Woven Fabrics Industry Revenue (Million), by Country 2025 & 2033
- Figure 60: Japan APAC Non-Woven Fabrics Industry Volume (K Tons), by Country 2025 & 2033
- Figure 61: Japan APAC Non-Woven Fabrics Industry Revenue Share (%), by Country 2025 & 2033
- Figure 62: Japan APAC Non-Woven Fabrics Industry Volume Share (%), by Country 2025 & 2033
- Figure 63: South Korea APAC Non-Woven Fabrics Industry Revenue (Million), by Technology 2025 & 2033
- Figure 64: South Korea APAC Non-Woven Fabrics Industry Volume (K Tons), by Technology 2025 & 2033
- Figure 65: South Korea APAC Non-Woven Fabrics Industry Revenue Share (%), by Technology 2025 & 2033
- Figure 66: South Korea APAC Non-Woven Fabrics Industry Volume Share (%), by Technology 2025 & 2033
- Figure 67: South Korea APAC Non-Woven Fabrics Industry Revenue (Million), by Material 2025 & 2033
- Figure 68: South Korea APAC Non-Woven Fabrics Industry Volume (K Tons), by Material 2025 & 2033
- Figure 69: South Korea APAC Non-Woven Fabrics Industry Revenue Share (%), by Material 2025 & 2033
- Figure 70: South Korea APAC Non-Woven Fabrics Industry Volume Share (%), by Material 2025 & 2033
- Figure 71: South Korea APAC Non-Woven Fabrics Industry Revenue (Million), by End-User Industry 2025 & 2033
- Figure 72: South Korea APAC Non-Woven Fabrics Industry Volume (K Tons), by End-User Industry 2025 & 2033
- Figure 73: South Korea APAC Non-Woven Fabrics Industry Revenue Share (%), by End-User Industry 2025 & 2033
- Figure 74: South Korea APAC Non-Woven Fabrics Industry Volume Share (%), by End-User Industry 2025 & 2033
- Figure 75: South Korea APAC Non-Woven Fabrics Industry Revenue (Million), by Geography 2025 & 2033
- Figure 76: South Korea APAC Non-Woven Fabrics Industry Volume (K Tons), by Geography 2025 & 2033
- Figure 77: South Korea APAC Non-Woven Fabrics Industry Revenue Share (%), by Geography 2025 & 2033
- Figure 78: South Korea APAC Non-Woven Fabrics Industry Volume Share (%), by Geography 2025 & 2033
- Figure 79: South Korea APAC Non-Woven Fabrics Industry Revenue (Million), by Country 2025 & 2033
- Figure 80: South Korea APAC Non-Woven Fabrics Industry Volume (K Tons), by Country 2025 & 2033
- Figure 81: South Korea APAC Non-Woven Fabrics Industry Revenue Share (%), by Country 2025 & 2033
- Figure 82: South Korea APAC Non-Woven Fabrics Industry Volume Share (%), by Country 2025 & 2033
- Figure 83: Indonesia APAC Non-Woven Fabrics Industry Revenue (Million), by Technology 2025 & 2033
- Figure 84: Indonesia APAC Non-Woven Fabrics Industry Volume (K Tons), by Technology 2025 & 2033
- Figure 85: Indonesia APAC Non-Woven Fabrics Industry Revenue Share (%), by Technology 2025 & 2033
- Figure 86: Indonesia APAC Non-Woven Fabrics Industry Volume Share (%), by Technology 2025 & 2033
- Figure 87: Indonesia APAC Non-Woven Fabrics Industry Revenue (Million), by Material 2025 & 2033
- Figure 88: Indonesia APAC Non-Woven Fabrics Industry Volume (K Tons), by Material 2025 & 2033
- Figure 89: Indonesia APAC Non-Woven Fabrics Industry Revenue Share (%), by Material 2025 & 2033
- Figure 90: Indonesia APAC Non-Woven Fabrics Industry Volume Share (%), by Material 2025 & 2033
- Figure 91: Indonesia APAC Non-Woven Fabrics Industry Revenue (Million), by End-User Industry 2025 & 2033
- Figure 92: Indonesia APAC Non-Woven Fabrics Industry Volume (K Tons), by End-User Industry 2025 & 2033
- Figure 93: Indonesia APAC Non-Woven Fabrics Industry Revenue Share (%), by End-User Industry 2025 & 2033
- Figure 94: Indonesia APAC Non-Woven Fabrics Industry Volume Share (%), by End-User Industry 2025 & 2033
- Figure 95: Indonesia APAC Non-Woven Fabrics Industry Revenue (Million), by Geography 2025 & 2033
- Figure 96: Indonesia APAC Non-Woven Fabrics Industry Volume (K Tons), by Geography 2025 & 2033
- Figure 97: Indonesia APAC Non-Woven Fabrics Industry Revenue Share (%), by Geography 2025 & 2033
- Figure 98: Indonesia APAC Non-Woven Fabrics Industry Volume Share (%), by Geography 2025 & 2033
- Figure 99: Indonesia APAC Non-Woven Fabrics Industry Revenue (Million), by Country 2025 & 2033
- Figure 100: Indonesia APAC Non-Woven Fabrics Industry Volume (K Tons), by Country 2025 & 2033
- Figure 101: Indonesia APAC Non-Woven Fabrics Industry Revenue Share (%), by Country 2025 & 2033
- Figure 102: Indonesia APAC Non-Woven Fabrics Industry Volume Share (%), by Country 2025 & 2033
- Figure 103: Malaysia APAC Non-Woven Fabrics Industry Revenue (Million), by Technology 2025 & 2033
- Figure 104: Malaysia APAC Non-Woven Fabrics Industry Volume (K Tons), by Technology 2025 & 2033
- Figure 105: Malaysia APAC Non-Woven Fabrics Industry Revenue Share (%), by Technology 2025 & 2033
- Figure 106: Malaysia APAC Non-Woven Fabrics Industry Volume Share (%), by Technology 2025 & 2033
- Figure 107: Malaysia APAC Non-Woven Fabrics Industry Revenue (Million), by Material 2025 & 2033
- Figure 108: Malaysia APAC Non-Woven Fabrics Industry Volume (K Tons), by Material 2025 & 2033
- Figure 109: Malaysia APAC Non-Woven Fabrics Industry Revenue Share (%), by Material 2025 & 2033
- Figure 110: Malaysia APAC Non-Woven Fabrics Industry Volume Share (%), by Material 2025 & 2033
- Figure 111: Malaysia APAC Non-Woven Fabrics Industry Revenue (Million), by End-User Industry 2025 & 2033
- Figure 112: Malaysia APAC Non-Woven Fabrics Industry Volume (K Tons), by End-User Industry 2025 & 2033
- Figure 113: Malaysia APAC Non-Woven Fabrics Industry Revenue Share (%), by End-User Industry 2025 & 2033
- Figure 114: Malaysia APAC Non-Woven Fabrics Industry Volume Share (%), by End-User Industry 2025 & 2033
- Figure 115: Malaysia APAC Non-Woven Fabrics Industry Revenue (Million), by Geography 2025 & 2033
- Figure 116: Malaysia APAC Non-Woven Fabrics Industry Volume (K Tons), by Geography 2025 & 2033
- Figure 117: Malaysia APAC Non-Woven Fabrics Industry Revenue Share (%), by Geography 2025 & 2033
- Figure 118: Malaysia APAC Non-Woven Fabrics Industry Volume Share (%), by Geography 2025 & 2033
- Figure 119: Malaysia APAC Non-Woven Fabrics Industry Revenue (Million), by Country 2025 & 2033
- Figure 120: Malaysia APAC Non-Woven Fabrics Industry Volume (K Tons), by Country 2025 & 2033
- Figure 121: Malaysia APAC Non-Woven Fabrics Industry Revenue Share (%), by Country 2025 & 2033
- Figure 122: Malaysia APAC Non-Woven Fabrics Industry Volume Share (%), by Country 2025 & 2033
- Figure 123: Thailand APAC Non-Woven Fabrics Industry Revenue (Million), by Technology 2025 & 2033
- Figure 124: Thailand APAC Non-Woven Fabrics Industry Volume (K Tons), by Technology 2025 & 2033
- Figure 125: Thailand APAC Non-Woven Fabrics Industry Revenue Share (%), by Technology 2025 & 2033
- Figure 126: Thailand APAC Non-Woven Fabrics Industry Volume Share (%), by Technology 2025 & 2033
- Figure 127: Thailand APAC Non-Woven Fabrics Industry Revenue (Million), by Material 2025 & 2033
- Figure 128: Thailand APAC Non-Woven Fabrics Industry Volume (K Tons), by Material 2025 & 2033
- Figure 129: Thailand APAC Non-Woven Fabrics Industry Revenue Share (%), by Material 2025 & 2033
- Figure 130: Thailand APAC Non-Woven Fabrics Industry Volume Share (%), by Material 2025 & 2033
- Figure 131: Thailand APAC Non-Woven Fabrics Industry Revenue (Million), by End-User Industry 2025 & 2033
- Figure 132: Thailand APAC Non-Woven Fabrics Industry Volume (K Tons), by End-User Industry 2025 & 2033
- Figure 133: Thailand APAC Non-Woven Fabrics Industry Revenue Share (%), by End-User Industry 2025 & 2033
- Figure 134: Thailand APAC Non-Woven Fabrics Industry Volume Share (%), by End-User Industry 2025 & 2033
- Figure 135: Thailand APAC Non-Woven Fabrics Industry Revenue (Million), by Geography 2025 & 2033
- Figure 136: Thailand APAC Non-Woven Fabrics Industry Volume (K Tons), by Geography 2025 & 2033
- Figure 137: Thailand APAC Non-Woven Fabrics Industry Revenue Share (%), by Geography 2025 & 2033
- Figure 138: Thailand APAC Non-Woven Fabrics Industry Volume Share (%), by Geography 2025 & 2033
- Figure 139: Thailand APAC Non-Woven Fabrics Industry Revenue (Million), by Country 2025 & 2033
- Figure 140: Thailand APAC Non-Woven Fabrics Industry Volume (K Tons), by Country 2025 & 2033
- Figure 141: Thailand APAC Non-Woven Fabrics Industry Revenue Share (%), by Country 2025 & 2033
- Figure 142: Thailand APAC Non-Woven Fabrics Industry Volume Share (%), by Country 2025 & 2033
- Figure 143: Vietnam APAC Non-Woven Fabrics Industry Revenue (Million), by Technology 2025 & 2033
- Figure 144: Vietnam APAC Non-Woven Fabrics Industry Volume (K Tons), by Technology 2025 & 2033
- Figure 145: Vietnam APAC Non-Woven Fabrics Industry Revenue Share (%), by Technology 2025 & 2033
- Figure 146: Vietnam APAC Non-Woven Fabrics Industry Volume Share (%), by Technology 2025 & 2033
- Figure 147: Vietnam APAC Non-Woven Fabrics Industry Revenue (Million), by Material 2025 & 2033
- Figure 148: Vietnam APAC Non-Woven Fabrics Industry Volume (K Tons), by Material 2025 & 2033
- Figure 149: Vietnam APAC Non-Woven Fabrics Industry Revenue Share (%), by Material 2025 & 2033
- Figure 150: Vietnam APAC Non-Woven Fabrics Industry Volume Share (%), by Material 2025 & 2033
- Figure 151: Vietnam APAC Non-Woven Fabrics Industry Revenue (Million), by End-User Industry 2025 & 2033
- Figure 152: Vietnam APAC Non-Woven Fabrics Industry Volume (K Tons), by End-User Industry 2025 & 2033
- Figure 153: Vietnam APAC Non-Woven Fabrics Industry Revenue Share (%), by End-User Industry 2025 & 2033
- Figure 154: Vietnam APAC Non-Woven Fabrics Industry Volume Share (%), by End-User Industry 2025 & 2033
- Figure 155: Vietnam APAC Non-Woven Fabrics Industry Revenue (Million), by Geography 2025 & 2033
- Figure 156: Vietnam APAC Non-Woven Fabrics Industry Volume (K Tons), by Geography 2025 & 2033
- Figure 157: Vietnam APAC Non-Woven Fabrics Industry Revenue Share (%), by Geography 2025 & 2033
- Figure 158: Vietnam APAC Non-Woven Fabrics Industry Volume Share (%), by Geography 2025 & 2033
- Figure 159: Vietnam APAC Non-Woven Fabrics Industry Revenue (Million), by Country 2025 & 2033
- Figure 160: Vietnam APAC Non-Woven Fabrics Industry Volume (K Tons), by Country 2025 & 2033
- Figure 161: Vietnam APAC Non-Woven Fabrics Industry Revenue Share (%), by Country 2025 & 2033
- Figure 162: Vietnam APAC Non-Woven Fabrics Industry Volume Share (%), by Country 2025 & 2033
- Figure 163: Rest of Asia Pacific APAC Non-Woven Fabrics Industry Revenue (Million), by Technology 2025 & 2033
- Figure 164: Rest of Asia Pacific APAC Non-Woven Fabrics Industry Volume (K Tons), by Technology 2025 & 2033
- Figure 165: Rest of Asia Pacific APAC Non-Woven Fabrics Industry Revenue Share (%), by Technology 2025 & 2033
- Figure 166: Rest of Asia Pacific APAC Non-Woven Fabrics Industry Volume Share (%), by Technology 2025 & 2033
- Figure 167: Rest of Asia Pacific APAC Non-Woven Fabrics Industry Revenue (Million), by Material 2025 & 2033
- Figure 168: Rest of Asia Pacific APAC Non-Woven Fabrics Industry Volume (K Tons), by Material 2025 & 2033
- Figure 169: Rest of Asia Pacific APAC Non-Woven Fabrics Industry Revenue Share (%), by Material 2025 & 2033
- Figure 170: Rest of Asia Pacific APAC Non-Woven Fabrics Industry Volume Share (%), by Material 2025 & 2033
- Figure 171: Rest of Asia Pacific APAC Non-Woven Fabrics Industry Revenue (Million), by End-User Industry 2025 & 2033
- Figure 172: Rest of Asia Pacific APAC Non-Woven Fabrics Industry Volume (K Tons), by End-User Industry 2025 & 2033
- Figure 173: Rest of Asia Pacific APAC Non-Woven Fabrics Industry Revenue Share (%), by End-User Industry 2025 & 2033
- Figure 174: Rest of Asia Pacific APAC Non-Woven Fabrics Industry Volume Share (%), by End-User Industry 2025 & 2033
- Figure 175: Rest of Asia Pacific APAC Non-Woven Fabrics Industry Revenue (Million), by Geography 2025 & 2033
- Figure 176: Rest of Asia Pacific APAC Non-Woven Fabrics Industry Volume (K Tons), by Geography 2025 & 2033
- Figure 177: Rest of Asia Pacific APAC Non-Woven Fabrics Industry Revenue Share (%), by Geography 2025 & 2033
- Figure 178: Rest of Asia Pacific APAC Non-Woven Fabrics Industry Volume Share (%), by Geography 2025 & 2033
- Figure 179: Rest of Asia Pacific APAC Non-Woven Fabrics Industry Revenue (Million), by Country 2025 & 2033
- Figure 180: Rest of Asia Pacific APAC Non-Woven Fabrics Industry Volume (K Tons), by Country 2025 & 2033
- Figure 181: Rest of Asia Pacific APAC Non-Woven Fabrics Industry Revenue Share (%), by Country 2025 & 2033
- Figure 182: Rest of Asia Pacific APAC Non-Woven Fabrics Industry Volume Share (%), by Country 2025 & 2033
List of Tables
- Table 1: Global APAC Non-Woven Fabrics Industry Revenue Million Forecast, by Technology 2020 & 2033
- Table 2: Global APAC Non-Woven Fabrics Industry Volume K Tons Forecast, by Technology 2020 & 2033
- Table 3: Global APAC Non-Woven Fabrics Industry Revenue Million Forecast, by Material 2020 & 2033
- Table 4: Global APAC Non-Woven Fabrics Industry Volume K Tons Forecast, by Material 2020 & 2033
- Table 5: Global APAC Non-Woven Fabrics Industry Revenue Million Forecast, by End-User Industry 2020 & 2033
- Table 6: Global APAC Non-Woven Fabrics Industry Volume K Tons Forecast, by End-User Industry 2020 & 2033
- Table 7: Global APAC Non-Woven Fabrics Industry Revenue Million Forecast, by Geography 2020 & 2033
- Table 8: Global APAC Non-Woven Fabrics Industry Volume K Tons Forecast, by Geography 2020 & 2033
- Table 9: Global APAC Non-Woven Fabrics Industry Revenue Million Forecast, by Region 2020 & 2033
- Table 10: Global APAC Non-Woven Fabrics Industry Volume K Tons Forecast, by Region 2020 & 2033
- Table 11: Global APAC Non-Woven Fabrics Industry Revenue Million Forecast, by Technology 2020 & 2033
- Table 12: Global APAC Non-Woven Fabrics Industry Volume K Tons Forecast, by Technology 2020 & 2033
- Table 13: Global APAC Non-Woven Fabrics Industry Revenue Million Forecast, by Material 2020 & 2033
- Table 14: Global APAC Non-Woven Fabrics Industry Volume K Tons Forecast, by Material 2020 & 2033
- Table 15: Global APAC Non-Woven Fabrics Industry Revenue Million Forecast, by End-User Industry 2020 & 2033
- Table 16: Global APAC Non-Woven Fabrics Industry Volume K Tons Forecast, by End-User Industry 2020 & 2033
- Table 17: Global APAC Non-Woven Fabrics Industry Revenue Million Forecast, by Geography 2020 & 2033
- Table 18: Global APAC Non-Woven Fabrics Industry Volume K Tons Forecast, by Geography 2020 & 2033
- Table 19: Global APAC Non-Woven Fabrics Industry Revenue Million Forecast, by Country 2020 & 2033
- Table 20: Global APAC Non-Woven Fabrics Industry Volume K Tons Forecast, by Country 2020 & 2033
- Table 21: Global APAC Non-Woven Fabrics Industry Revenue Million Forecast, by Technology 2020 & 2033
- Table 22: Global APAC Non-Woven Fabrics Industry Volume K Tons Forecast, by Technology 2020 & 2033
- Table 23: Global APAC Non-Woven Fabrics Industry Revenue Million Forecast, by Material 2020 & 2033
- Table 24: Global APAC Non-Woven Fabrics Industry Volume K Tons Forecast, by Material 2020 & 2033
- Table 25: Global APAC Non-Woven Fabrics Industry Revenue Million Forecast, by End-User Industry 2020 & 2033
- Table 26: Global APAC Non-Woven Fabrics Industry Volume K Tons Forecast, by End-User Industry 2020 & 2033
- Table 27: Global APAC Non-Woven Fabrics Industry Revenue Million Forecast, by Geography 2020 & 2033
- Table 28: Global APAC Non-Woven Fabrics Industry Volume K Tons Forecast, by Geography 2020 & 2033
- Table 29: Global APAC Non-Woven Fabrics Industry Revenue Million Forecast, by Country 2020 & 2033
- Table 30: Global APAC Non-Woven Fabrics Industry Volume K Tons Forecast, by Country 2020 & 2033
- Table 31: Global APAC Non-Woven Fabrics Industry Revenue Million Forecast, by Technology 2020 & 2033
- Table 32: Global APAC Non-Woven Fabrics Industry Volume K Tons Forecast, by Technology 2020 & 2033
- Table 33: Global APAC Non-Woven Fabrics Industry Revenue Million Forecast, by Material 2020 & 2033
- Table 34: Global APAC Non-Woven Fabrics Industry Volume K Tons Forecast, by Material 2020 & 2033
- Table 35: Global APAC Non-Woven Fabrics Industry Revenue Million Forecast, by End-User Industry 2020 & 2033
- Table 36: Global APAC Non-Woven Fabrics Industry Volume K Tons Forecast, by End-User Industry 2020 & 2033
- Table 37: Global APAC Non-Woven Fabrics Industry Revenue Million Forecast, by Geography 2020 & 2033
- Table 38: Global APAC Non-Woven Fabrics Industry Volume K Tons Forecast, by Geography 2020 & 2033
- Table 39: Global APAC Non-Woven Fabrics Industry Revenue Million Forecast, by Country 2020 & 2033
- Table 40: Global APAC Non-Woven Fabrics Industry Volume K Tons Forecast, by Country 2020 & 2033
- Table 41: Global APAC Non-Woven Fabrics Industry Revenue Million Forecast, by Technology 2020 & 2033
- Table 42: Global APAC Non-Woven Fabrics Industry Volume K Tons Forecast, by Technology 2020 & 2033
- Table 43: Global APAC Non-Woven Fabrics Industry Revenue Million Forecast, by Material 2020 & 2033
- Table 44: Global APAC Non-Woven Fabrics Industry Volume K Tons Forecast, by Material 2020 & 2033
- Table 45: Global APAC Non-Woven Fabrics Industry Revenue Million Forecast, by End-User Industry 2020 & 2033
- Table 46: Global APAC Non-Woven Fabrics Industry Volume K Tons Forecast, by End-User Industry 2020 & 2033
- Table 47: Global APAC Non-Woven Fabrics Industry Revenue Million Forecast, by Geography 2020 & 2033
- Table 48: Global APAC Non-Woven Fabrics Industry Volume K Tons Forecast, by Geography 2020 & 2033
- Table 49: Global APAC Non-Woven Fabrics Industry Revenue Million Forecast, by Country 2020 & 2033
- Table 50: Global APAC Non-Woven Fabrics Industry Volume K Tons Forecast, by Country 2020 & 2033
- Table 51: Global APAC Non-Woven Fabrics Industry Revenue Million Forecast, by Technology 2020 & 2033
- Table 52: Global APAC Non-Woven Fabrics Industry Volume K Tons Forecast, by Technology 2020 & 2033
- Table 53: Global APAC Non-Woven Fabrics Industry Revenue Million Forecast, by Material 2020 & 2033
- Table 54: Global APAC Non-Woven Fabrics Industry Volume K Tons Forecast, by Material 2020 & 2033
- Table 55: Global APAC Non-Woven Fabrics Industry Revenue Million Forecast, by End-User Industry 2020 & 2033
- Table 56: Global APAC Non-Woven Fabrics Industry Volume K Tons Forecast, by End-User Industry 2020 & 2033
- Table 57: Global APAC Non-Woven Fabrics Industry Revenue Million Forecast, by Geography 2020 & 2033
- Table 58: Global APAC Non-Woven Fabrics Industry Volume K Tons Forecast, by Geography 2020 & 2033
- Table 59: Global APAC Non-Woven Fabrics Industry Revenue Million Forecast, by Country 2020 & 2033
- Table 60: Global APAC Non-Woven Fabrics Industry Volume K Tons Forecast, by Country 2020 & 2033
- Table 61: Global APAC Non-Woven Fabrics Industry Revenue Million Forecast, by Technology 2020 & 2033
- Table 62: Global APAC Non-Woven Fabrics Industry Volume K Tons Forecast, by Technology 2020 & 2033
- Table 63: Global APAC Non-Woven Fabrics Industry Revenue Million Forecast, by Material 2020 & 2033
- Table 64: Global APAC Non-Woven Fabrics Industry Volume K Tons Forecast, by Material 2020 & 2033
- Table 65: Global APAC Non-Woven Fabrics Industry Revenue Million Forecast, by End-User Industry 2020 & 2033
- Table 66: Global APAC Non-Woven Fabrics Industry Volume K Tons Forecast, by End-User Industry 2020 & 2033
- Table 67: Global APAC Non-Woven Fabrics Industry Revenue Million Forecast, by Geography 2020 & 2033
- Table 68: Global APAC Non-Woven Fabrics Industry Volume K Tons Forecast, by Geography 2020 & 2033
- Table 69: Global APAC Non-Woven Fabrics Industry Revenue Million Forecast, by Country 2020 & 2033
- Table 70: Global APAC Non-Woven Fabrics Industry Volume K Tons Forecast, by Country 2020 & 2033
- Table 71: Global APAC Non-Woven Fabrics Industry Revenue Million Forecast, by Technology 2020 & 2033
- Table 72: Global APAC Non-Woven Fabrics Industry Volume K Tons Forecast, by Technology 2020 & 2033
- Table 73: Global APAC Non-Woven Fabrics Industry Revenue Million Forecast, by Material 2020 & 2033
- Table 74: Global APAC Non-Woven Fabrics Industry Volume K Tons Forecast, by Material 2020 & 2033
- Table 75: Global APAC Non-Woven Fabrics Industry Revenue Million Forecast, by End-User Industry 2020 & 2033
- Table 76: Global APAC Non-Woven Fabrics Industry Volume K Tons Forecast, by End-User Industry 2020 & 2033
- Table 77: Global APAC Non-Woven Fabrics Industry Revenue Million Forecast, by Geography 2020 & 2033
- Table 78: Global APAC Non-Woven Fabrics Industry Volume K Tons Forecast, by Geography 2020 & 2033
- Table 79: Global APAC Non-Woven Fabrics Industry Revenue Million Forecast, by Country 2020 & 2033
- Table 80: Global APAC Non-Woven Fabrics Industry Volume K Tons Forecast, by Country 2020 & 2033
- Table 81: Global APAC Non-Woven Fabrics Industry Revenue Million Forecast, by Technology 2020 & 2033
- Table 82: Global APAC Non-Woven Fabrics Industry Volume K Tons Forecast, by Technology 2020 & 2033
- Table 83: Global APAC Non-Woven Fabrics Industry Revenue Million Forecast, by Material 2020 & 2033
- Table 84: Global APAC Non-Woven Fabrics Industry Volume K Tons Forecast, by Material 2020 & 2033
- Table 85: Global APAC Non-Woven Fabrics Industry Revenue Million Forecast, by End-User Industry 2020 & 2033
- Table 86: Global APAC Non-Woven Fabrics Industry Volume K Tons Forecast, by End-User Industry 2020 & 2033
- Table 87: Global APAC Non-Woven Fabrics Industry Revenue Million Forecast, by Geography 2020 & 2033
- Table 88: Global APAC Non-Woven Fabrics Industry Volume K Tons Forecast, by Geography 2020 & 2033
- Table 89: Global APAC Non-Woven Fabrics Industry Revenue Million Forecast, by Country 2020 & 2033
- Table 90: Global APAC Non-Woven Fabrics Industry Volume K Tons Forecast, by Country 2020 & 2033
- Table 91: Global APAC Non-Woven Fabrics Industry Revenue Million Forecast, by Technology 2020 & 2033
- Table 92: Global APAC Non-Woven Fabrics Industry Volume K Tons Forecast, by Technology 2020 & 2033
- Table 93: Global APAC Non-Woven Fabrics Industry Revenue Million Forecast, by Material 2020 & 2033
- Table 94: Global APAC Non-Woven Fabrics Industry Volume K Tons Forecast, by Material 2020 & 2033
- Table 95: Global APAC Non-Woven Fabrics Industry Revenue Million Forecast, by End-User Industry 2020 & 2033
- Table 96: Global APAC Non-Woven Fabrics Industry Volume K Tons Forecast, by End-User Industry 2020 & 2033
- Table 97: Global APAC Non-Woven Fabrics Industry Revenue Million Forecast, by Geography 2020 & 2033
- Table 98: Global APAC Non-Woven Fabrics Industry Volume K Tons Forecast, by Geography 2020 & 2033
- Table 99: Global APAC Non-Woven Fabrics Industry Revenue Million Forecast, by Country 2020 & 2033
- Table 100: Global APAC Non-Woven Fabrics Industry Volume K Tons Forecast, by Country 2020 & 2033
Frequently Asked Questions
1. What is the projected Compound Annual Growth Rate (CAGR) of the APAC Non-Woven Fabrics Industry?
The projected CAGR is approximately > 8.00%.
2. Which companies are prominent players in the APAC Non-Woven Fabrics Industry?
Key companies in the market include Ahlstrom, Glatfelter Corporation, Global Non Wovens Limited, Ginni Filaments, Freudenberg Performance Materials, Cygnus Group, Eximius Innovative Pvt Ltd, Fitesa S A, DuPont, Autotech Nonwovens Pvt Ltd, TORAY INDUSTRIES INC *List Not Exhaustive, Johns Manville, Berry Global Inc, Reliance Non-woven Industry LLC.
3. What are the main segments of the APAC Non-Woven Fabrics Industry?
The market segments include Technology, Material, End-User Industry, Geography.
4. Can you provide details about the market size?
The market size is estimated to be USD 36.76 Million as of 2022.
5. What are some drivers contributing to market growth?
Increasing Application Base in the Healthcare Industry; Growth in The Automotive Industry; Increasing Demand for Non-Woven Fabrics in The Textile Industry.
6. What are the notable trends driving market growth?
Healthcare End-User Industry to Dominate The Market.
7. Are there any restraints impacting market growth?
Lack of Awareness Among Consumers; Volatility in Raw Material Prices.
8. Can you provide examples of recent developments in the market?
November 2022: Fitesa announced the expansion of its production capacity for nonwoven fabrics for medical applications. The company is expected to invest in new machinery to meet the growing demand for these products.
9. What pricing options are available for accessing the report?
Pricing options include single-user, multi-user, and enterprise licenses priced at USD 4750, USD 5250, and USD 8750 respectively.
10. Is the market size provided in terms of value or volume?
The market size is provided in terms of value, measured in Million and volume, measured in K Tons.
11. Are there any specific market keywords associated with the report?
Yes, the market keyword associated with the report is "APAC Non-Woven Fabrics Industry," which aids in identifying and referencing the specific market segment covered.
12. How do I determine which pricing option suits my needs best?
The pricing options vary based on user requirements and access needs. Individual users may opt for single-user licenses, while businesses requiring broader access may choose multi-user or enterprise licenses for cost-effective access to the report.
13. Are there any additional resources or data provided in the APAC Non-Woven Fabrics Industry report?
While the report offers comprehensive insights, it's advisable to review the specific contents or supplementary materials provided to ascertain if additional resources or data are available.
14. How can I stay updated on further developments or reports in the APAC Non-Woven Fabrics Industry?
To stay informed about further developments, trends, and reports in the APAC Non-Woven Fabrics Industry, consider subscribing to industry newsletters, following relevant companies and organizations, or regularly checking reputable industry news sources and publications.
Methodology
Step 1 - Identification of Relevant Samples Size from Population Database


Step 2 - Approaches for Defining Global Market Size (Value, Volume* & Price*)

Note*: In applicable scenarios
Step 3 - Data Sources
Primary Research
- Web Analytics
- Survey Reports
- Research Institute
- Latest Research Reports
- Opinion Leaders
Secondary Research
- Annual Reports
- White Paper
- Latest Press Release
- Industry Association
- Paid Database
- Investor Presentations

Step 4 - Data Triangulation
Involves using different sources of information in order to increase the validity of a study
These sources are likely to be stakeholders in a program - participants, other researchers, program staff, other community members, and so on.
Then we put all data in single framework & apply various statistical tools to find out the dynamic on the market.
During the analysis stage, feedback from the stakeholder groups would be compared to determine areas of agreement as well as areas of divergence