

Key Insights
The Asia-Pacific (APAC) sealants and adhesives market is experiencing robust growth, driven by the region's burgeoning construction, automotive, and packaging sectors. A significant portion of this growth stems from increasing infrastructure development across countries like China, India, and Southeast Asia, fueling demand for high-performance adhesives and sealants in building and construction projects. The rising adoption of advanced technologies, such as UV-cured adhesives, in various applications further propels market expansion. Furthermore, the increasing focus on lightweighting in the automotive industry necessitates the use of specialized adhesives that enhance fuel efficiency and reduce vehicle weight, creating a substantial market opportunity. Consumer demand for convenient and durable products in packaging and consumer goods sectors also contributes positively to growth. While economic fluctuations and raw material price volatility present challenges, the overall outlook for the APAC sealants and adhesives market remains positive, with a projected Compound Annual Growth Rate (CAGR) exceeding 6% over the forecast period (2025-2033).
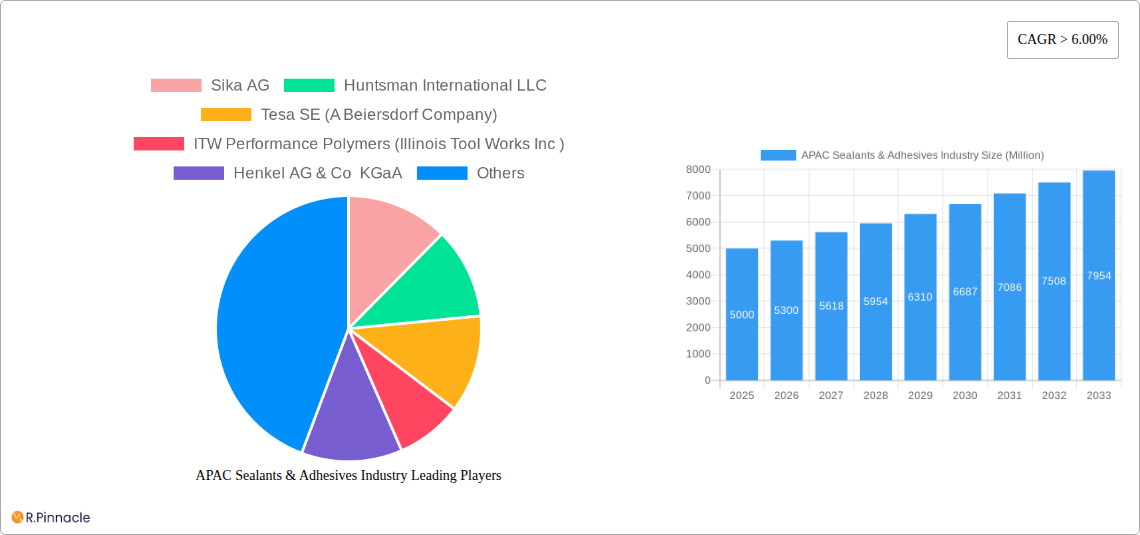
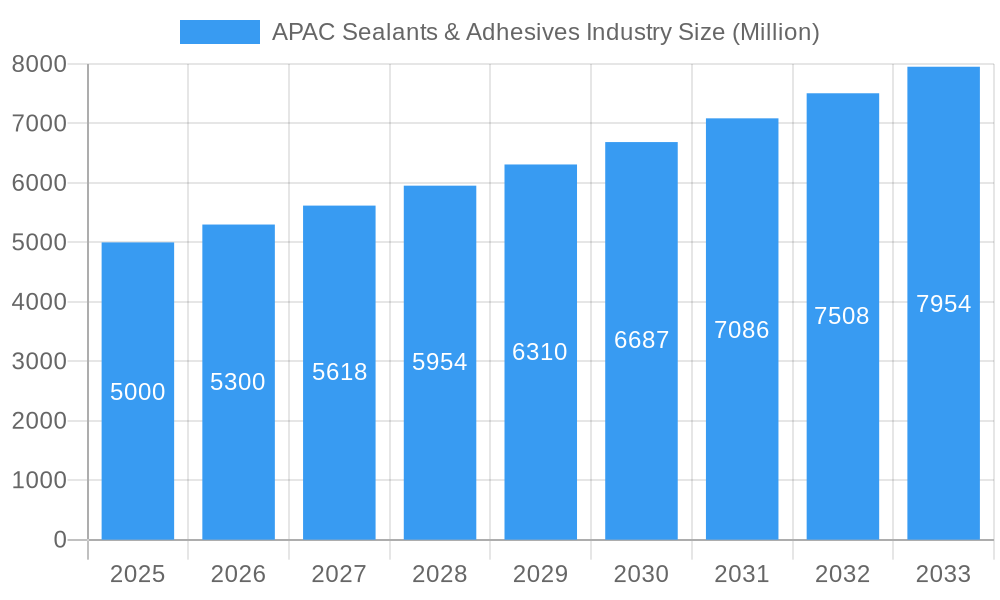
APAC Sealants & Adhesives Industry Market Size (In Billion)
The market segmentation within APAC reveals strong performance across various adhesive technologies, including solvent-borne, reactive, and hot-melt adhesives. Silicone and polyurethane-based sealants dominate the sealants segment due to their versatility and superior performance characteristics. The end-user industry breakdown highlights the significant contributions of the building and construction, automotive, and packaging industries to overall market revenue. Major players are focusing on product innovation, strategic partnerships, and regional expansion to consolidate their market share. However, the increasing competition from regional manufacturers requires established companies to adopt strategies to maintain their market presence. The growth prospects are further influenced by government regulations aimed at promoting sustainable and environmentally friendly adhesive and sealant solutions, encouraging the development of water-borne and bio-based alternatives. This shift towards sustainability is anticipated to shape future market dynamics.
APAC Sealants & Adhesives Industry Company Market Share
This comprehensive report provides a detailed analysis of the Asia-Pacific (APAC) sealants and adhesives industry, offering invaluable insights for industry professionals, investors, and strategic planners. Covering the period from 2019 to 2033, with a focus on 2025, this report meticulously examines market dynamics, growth drivers, challenges, and future opportunities. The study incorporates a robust segmentation analysis across adhesives technology, sealant resin, and end-user industries, providing granular data for informed decision-making. The market size is projected to reach xx Million by 2033.
APAC Sealants & Adhesives Industry Market Structure & Innovation Trends
This section analyzes the competitive landscape of the APAC sealants and adhesives market, focusing on market concentration, innovation drivers, regulatory frameworks, and mergers & acquisitions (M&A) activities. The report assesses the market share of key players such as Sika AG, Huntsman International LLC, Henkel AG & Co KGaA, 3M, and others, highlighting their strategic initiatives and competitive advantages. The analysis also explores the impact of regulatory changes, the emergence of substitute products, and evolving end-user demographics on market dynamics.
- Market Concentration: The APAC sealants and adhesives market exhibits a moderately concentrated structure, with the top five players holding an estimated xx% market share in 2025.
- Innovation Drivers: Increased demand for high-performance materials in diverse end-use sectors, coupled with advancements in adhesive and sealant technologies, are driving innovation.
- Regulatory Frameworks: Government regulations concerning environmental protection and worker safety influence product formulations and manufacturing processes.
- M&A Activities: The report details significant M&A activities in the APAC region, including deal values and their impact on market consolidation. For example, in 2024, a major merger between two key players resulted in a xx Million deal value, significantly altering the market landscape.
APAC Sealants & Adhesives Industry Market Dynamics & Trends
This section delves into the market dynamics of the APAC sealants and adhesives industry, examining key growth drivers, technological advancements, evolving consumer preferences, and competitive forces. The report projects a Compound Annual Growth Rate (CAGR) of xx% during the forecast period (2025-2033). The analysis will encompass factors such as increasing infrastructure development, rising demand from the construction sector, the growth of the automotive industry, and the expanding electronics sector. Market penetration rates for various sealant and adhesive types across different end-use industries are also analyzed.
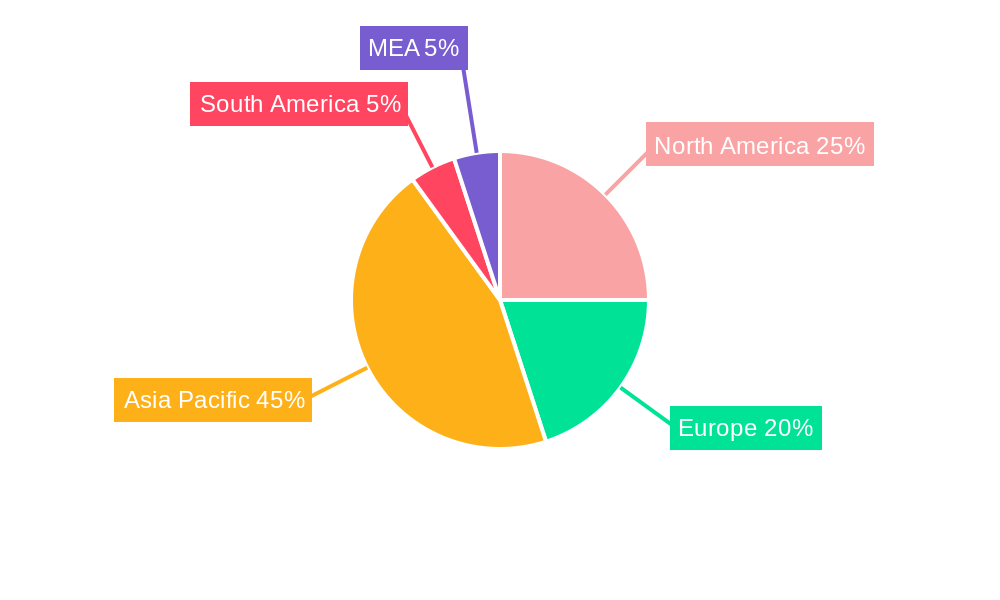
Dominant Regions & Segments in APAC Sealants & Adhesives Industry
This section identifies the leading regions and segments within the APAC sealants and adhesives market. A detailed analysis reveals the key growth drivers for each segment, including economic policies, infrastructure development, and consumer trends. The report highlights the dominance of specific countries within the region, based on factors such as economic growth, industrialization, and government initiatives.
- Leading Region: [Name of Leading Region, e.g., China] due to its robust construction activity and rapid industrialization.
- Dominant Adhesives Technology: [Name of Dominant Technology, e.g., Polyurethane] driven by its versatility and superior performance characteristics.
- Leading Sealant Resin: [Name of Dominant Resin, e.g., Silicone] owing to its high durability and resistance to environmental factors.
- Key End-User Industry: [Name of Dominant Industry, e.g., Building & Construction] due to the significant investment in infrastructure projects.
APAC Sealants & Adhesives Industry Product Innovations
This section summarizes recent product developments, highlighting key technological advancements and their market impact. The analysis underscores the increasing demand for environmentally friendly, high-performance sealants and adhesives, driving innovation in sustainable materials and manufacturing processes. Competitive advantages are analyzed, focusing on factors such as product differentiation, performance characteristics, and cost-effectiveness.
Report Scope & Segmentation Analysis
This report provides a comprehensive segmentation analysis of the APAC sealants and adhesives market across various parameters:
Adhesives Technology: Solvent-borne, Reactive, Hot Melt, UV Cured Adhesives, Water-borne. Growth projections and market sizes are detailed for each technology, along with an analysis of competitive dynamics.
Sealants Resin: Silicone, Polyurethane, Acrylic, Epoxy, Other Resins (Bituminous, Polysulfide UV-Curable, etc.). The report details the market size and growth prospects for each resin type, along with the competitive landscape.
End-User Industry: Aerospace, Automotive, Building and Construction, Footwear and Leather, Healthcare, Packaging, Woodworking And Joinery, Other End-user Industries (Electronics, Consumer/DIY, etc.). The analysis identifies the leading end-use segments, and explains their growth drivers and market dynamics.
Adhesives Resin: Polyurethane, Epoxy, Acrylic, Silicone, Cyanoacrylate, VAE/EVA, Other Resins (Polyester, Rubber, etc.). Each resin type's market size, growth projections, and competitive aspects are detailed.
Key Drivers of APAC Sealants & Adhesives Industry Growth
Several factors drive the growth of the APAC sealants and adhesives industry. These include the burgeoning construction sector, expanding automotive industry, and increasing demand for advanced materials in various end-use applications. Government initiatives promoting infrastructure development further boost market growth. Technological advancements, such as the development of eco-friendly formulations, also play a significant role.
Challenges in the APAP Sealants & Adhesives Industry Sector
The APAC sealants and adhesives industry faces various challenges, including fluctuations in raw material prices, stringent environmental regulations, and intense competition from established and emerging players. Supply chain disruptions and the increasing complexity of product development also pose significant challenges. These factors can negatively impact profitability and market share.
Emerging Opportunities in APAC Sealants & Adhesives Industry
The APAC sealants and adhesives industry presents several emerging opportunities. The growth of the renewable energy sector, increasing demand for high-performance adhesives in electronics manufacturing, and the rise of eco-conscious consumers create significant growth potential. The adoption of advanced manufacturing techniques and the development of innovative product formulations further present substantial opportunities.
Leading Players in the APAC Sealants & Adhesives Industry Market
- Sika AG
- Huntsman International LLC
- Tesa SE (A Beiersdorf Company)
- ITW Performance Polymers (Illinois Tool Works Inc)
- Henkel AG & Co KGaA
- Pidilite Industries Ltd
- Beardow Adams
- DuPont
- Dow
- Arkema
- H B Fuller Company
- 3M
- Mapei Inc
- Dymax Corporation
- Avery Dennison Corporation
- Wacker Chemie AG
- Jowat AG
- Ashland
- Franklin International
Key Developments in APAC Sealants & Adhesives Industry Industry
- [Month Year]: [Company Name] launches a new line of eco-friendly adhesives.
- [Month Year]: [Company Name] acquires [Company Name], expanding its market presence in [Region].
- [Month Year]: A new regulatory framework impacting the use of certain chemicals comes into effect.
Future Outlook for APAC Sealants & Adhesives Industry Market
The APAC sealants and adhesives market is poised for significant growth, driven by continuous innovation, expanding end-use applications, and favorable economic conditions. Strategic partnerships, mergers and acquisitions, and investments in research and development are expected to further shape the market landscape. The focus on sustainability and the development of eco-friendly products will be key drivers of growth.
APAC Sealants & Adhesives Industry Segmentation
-
1. Adhesives Resin
- 1.1. Polyurethane
- 1.2. Epoxy
- 1.3. Acrylic
- 1.4. Silicone
- 1.5. Cyanoacrylate
- 1.6. VAE/EVA
- 1.7. Other Resins (Polyester, Rubber, etc.)
-
2. Adhesives Technology
- 2.1. Solvent-borne
- 2.2. Reactive
- 2.3. Hot Melt
- 2.4. UV Cured Adhesives
- 2.5. Water-borne
-
3. Sealants Resin
- 3.1. Silicone
- 3.2. Polyurethane
- 3.3. Acrylic
- 3.4. Epoxy
- 3.5. Other Re
-
4. End-User Industry
- 4.1. Aerospace
- 4.2. Automotive
- 4.3. Building and Construction
- 4.4. Footwear and Leather
- 4.5. Healthcare
- 4.6. Packaging
- 4.7. Woodworking And Joinery
- 4.8. Other En
-
5. Geography
- 5.1. China
- 5.2. India
- 5.3. Japan
- 5.4. South Korea
- 5.5. Indonesia
- 5.6. Malaysia
- 5.7. Thailand
- 5.8. Vietnam
- 5.9. Rest of Asia-Pacific
APAC Sealants & Adhesives Industry Segmentation By Geography
- 1. China
- 2. India
- 3. Japan
- 4. South Korea
- 5. Indonesia
- 6. Malaysia
- 7. Thailand
- 8. Vietnam
- 9. Rest of Asia Pacific
APAC Sealants & Adhesives Industry Regional Market Share
Geographic Coverage of APAC Sealants & Adhesives Industry
APAC Sealants & Adhesives Industry REPORT HIGHLIGHTS
| Aspects | Details |
|---|---|
| Study Period | 2020-2034 |
| Base Year | 2025 |
| Estimated Year | 2026 |
| Forecast Period | 2026-2034 |
| Historical Period | 2020-2025 |
| Growth Rate | CAGR of > 6.00% from 2020-2034 |
| Segmentation |
|
Table of Contents
- 1. Introduction
- 1.1. Research Scope
- 1.2. Market Segmentation
- 1.3. Research Objective
- 1.4. Definitions and Assumptions
- 2. Executive Summary
- 2.1. Market Snapshot
- 3. Market Dynamics
- 3.1. Market Drivers
- 3.2. Market Restrains
- 3.3. Market Trends
- 3.4. Market Opportunities
- 4. Market Factor Analysis
- 4.1. Porters Five Forces
- 4.1.1. Bargaining Power of Suppliers
- 4.1.2. Bargaining Power of Buyers
- 4.1.3. Threat of New Entrants
- 4.1.4. Threat of Substitutes
- 4.1.5. Competitive Rivalry
- 4.2. PESTEL analysis
- 4.3. BCG Analysis
- 4.3.1. Stars (High Growth, High Market Share)
- 4.3.2. Cash Cows (Low Growth, High Market Share)
- 4.3.3. Question Mark (High Growth, Low Market Share)
- 4.3.4. Dogs (Low Growth, Low Market Share)
- 4.4. Ansoff Matrix Analysis
- 4.5. Supply Chain Analysis
- 4.6. Regulatory Landscape
- 4.7. Current Market Potential and Opportunity Assessment (TAM–SAM–SOM Framework)
- 4.8. PRI Analyst Note
- 4.1. Porters Five Forces
- 5. Market Analysis, Insights and Forecast 2021-2033
- 5.1. Market Analysis, Insights and Forecast - by Adhesives Resin
- 5.1.1. Polyurethane
- 5.1.2. Epoxy
- 5.1.3. Acrylic
- 5.1.4. Silicone
- 5.1.5. Cyanoacrylate
- 5.1.6. VAE/EVA
- 5.1.7. Other Resins (Polyester, Rubber, etc.)
- 5.2. Market Analysis, Insights and Forecast - by Adhesives Technology
- 5.2.1. Solvent-borne
- 5.2.2. Reactive
- 5.2.3. Hot Melt
- 5.2.4. UV Cured Adhesives
- 5.2.5. Water-borne
- 5.3. Market Analysis, Insights and Forecast - by Sealants Resin
- 5.3.1. Silicone
- 5.3.2. Polyurethane
- 5.3.3. Acrylic
- 5.3.4. Epoxy
- 5.3.5. Other Re
- 5.4. Market Analysis, Insights and Forecast - by End-User Industry
- 5.4.1. Aerospace
- 5.4.2. Automotive
- 5.4.3. Building and Construction
- 5.4.4. Footwear and Leather
- 5.4.5. Healthcare
- 5.4.6. Packaging
- 5.4.7. Woodworking And Joinery
- 5.4.8. Other En
- 5.5. Market Analysis, Insights and Forecast - by Geography
- 5.5.1. China
- 5.5.2. India
- 5.5.3. Japan
- 5.5.4. South Korea
- 5.5.5. Indonesia
- 5.5.6. Malaysia
- 5.5.7. Thailand
- 5.5.8. Vietnam
- 5.5.9. Rest of Asia-Pacific
- 5.6. Market Analysis, Insights and Forecast - by Region
- 5.6.1. China
- 5.6.2. India
- 5.6.3. Japan
- 5.6.4. South Korea
- 5.6.5. Indonesia
- 5.6.6. Malaysia
- 5.6.7. Thailand
- 5.6.8. Vietnam
- 5.6.9. Rest of Asia Pacific
- 5.1. Market Analysis, Insights and Forecast - by Adhesives Resin
- 6. Global APAC Sealants & Adhesives Industry Analysis, Insights and Forecast, 2021-2033
- 6.1. Market Analysis, Insights and Forecast - by Adhesives Resin
- 6.1.1. Polyurethane
- 6.1.2. Epoxy
- 6.1.3. Acrylic
- 6.1.4. Silicone
- 6.1.5. Cyanoacrylate
- 6.1.6. VAE/EVA
- 6.1.7. Other Resins (Polyester, Rubber, etc.)
- 6.2. Market Analysis, Insights and Forecast - by Adhesives Technology
- 6.2.1. Solvent-borne
- 6.2.2. Reactive
- 6.2.3. Hot Melt
- 6.2.4. UV Cured Adhesives
- 6.2.5. Water-borne
- 6.3. Market Analysis, Insights and Forecast - by Sealants Resin
- 6.3.1. Silicone
- 6.3.2. Polyurethane
- 6.3.3. Acrylic
- 6.3.4. Epoxy
- 6.3.5. Other Re
- 6.4. Market Analysis, Insights and Forecast - by End-User Industry
- 6.4.1. Aerospace
- 6.4.2. Automotive
- 6.4.3. Building and Construction
- 6.4.4. Footwear and Leather
- 6.4.5. Healthcare
- 6.4.6. Packaging
- 6.4.7. Woodworking And Joinery
- 6.4.8. Other En
- 6.5. Market Analysis, Insights and Forecast - by Geography
- 6.5.1. China
- 6.5.2. India
- 6.5.3. Japan
- 6.5.4. South Korea
- 6.5.5. Indonesia
- 6.5.6. Malaysia
- 6.5.7. Thailand
- 6.5.8. Vietnam
- 6.5.9. Rest of Asia-Pacific
- 6.1. Market Analysis, Insights and Forecast - by Adhesives Resin
- 7. China APAC Sealants & Adhesives Industry Analysis, Insights and Forecast, 2020-2032
- 7.1. Market Analysis, Insights and Forecast - by Adhesives Resin
- 7.1.1. Polyurethane
- 7.1.2. Epoxy
- 7.1.3. Acrylic
- 7.1.4. Silicone
- 7.1.5. Cyanoacrylate
- 7.1.6. VAE/EVA
- 7.1.7. Other Resins (Polyester, Rubber, etc.)
- 7.2. Market Analysis, Insights and Forecast - by Adhesives Technology
- 7.2.1. Solvent-borne
- 7.2.2. Reactive
- 7.2.3. Hot Melt
- 7.2.4. UV Cured Adhesives
- 7.2.5. Water-borne
- 7.3. Market Analysis, Insights and Forecast - by Sealants Resin
- 7.3.1. Silicone
- 7.3.2. Polyurethane
- 7.3.3. Acrylic
- 7.3.4. Epoxy
- 7.3.5. Other Re
- 7.4. Market Analysis, Insights and Forecast - by End-User Industry
- 7.4.1. Aerospace
- 7.4.2. Automotive
- 7.4.3. Building and Construction
- 7.4.4. Footwear and Leather
- 7.4.5. Healthcare
- 7.4.6. Packaging
- 7.4.7. Woodworking And Joinery
- 7.4.8. Other En
- 7.5. Market Analysis, Insights and Forecast - by Geography
- 7.5.1. China
- 7.5.2. India
- 7.5.3. Japan
- 7.5.4. South Korea
- 7.5.5. Indonesia
- 7.5.6. Malaysia
- 7.5.7. Thailand
- 7.5.8. Vietnam
- 7.5.9. Rest of Asia-Pacific
- 7.1. Market Analysis, Insights and Forecast - by Adhesives Resin
- 8. India APAC Sealants & Adhesives Industry Analysis, Insights and Forecast, 2020-2032
- 8.1. Market Analysis, Insights and Forecast - by Adhesives Resin
- 8.1.1. Polyurethane
- 8.1.2. Epoxy
- 8.1.3. Acrylic
- 8.1.4. Silicone
- 8.1.5. Cyanoacrylate
- 8.1.6. VAE/EVA
- 8.1.7. Other Resins (Polyester, Rubber, etc.)
- 8.2. Market Analysis, Insights and Forecast - by Adhesives Technology
- 8.2.1. Solvent-borne
- 8.2.2. Reactive
- 8.2.3. Hot Melt
- 8.2.4. UV Cured Adhesives
- 8.2.5. Water-borne
- 8.3. Market Analysis, Insights and Forecast - by Sealants Resin
- 8.3.1. Silicone
- 8.3.2. Polyurethane
- 8.3.3. Acrylic
- 8.3.4. Epoxy
- 8.3.5. Other Re
- 8.4. Market Analysis, Insights and Forecast - by End-User Industry
- 8.4.1. Aerospace
- 8.4.2. Automotive
- 8.4.3. Building and Construction
- 8.4.4. Footwear and Leather
- 8.4.5. Healthcare
- 8.4.6. Packaging
- 8.4.7. Woodworking And Joinery
- 8.4.8. Other En
- 8.5. Market Analysis, Insights and Forecast - by Geography
- 8.5.1. China
- 8.5.2. India
- 8.5.3. Japan
- 8.5.4. South Korea
- 8.5.5. Indonesia
- 8.5.6. Malaysia
- 8.5.7. Thailand
- 8.5.8. Vietnam
- 8.5.9. Rest of Asia-Pacific
- 8.1. Market Analysis, Insights and Forecast - by Adhesives Resin
- 9. Japan APAC Sealants & Adhesives Industry Analysis, Insights and Forecast, 2020-2032
- 9.1. Market Analysis, Insights and Forecast - by Adhesives Resin
- 9.1.1. Polyurethane
- 9.1.2. Epoxy
- 9.1.3. Acrylic
- 9.1.4. Silicone
- 9.1.5. Cyanoacrylate
- 9.1.6. VAE/EVA
- 9.1.7. Other Resins (Polyester, Rubber, etc.)
- 9.2. Market Analysis, Insights and Forecast - by Adhesives Technology
- 9.2.1. Solvent-borne
- 9.2.2. Reactive
- 9.2.3. Hot Melt
- 9.2.4. UV Cured Adhesives
- 9.2.5. Water-borne
- 9.3. Market Analysis, Insights and Forecast - by Sealants Resin
- 9.3.1. Silicone
- 9.3.2. Polyurethane
- 9.3.3. Acrylic
- 9.3.4. Epoxy
- 9.3.5. Other Re
- 9.4. Market Analysis, Insights and Forecast - by End-User Industry
- 9.4.1. Aerospace
- 9.4.2. Automotive
- 9.4.3. Building and Construction
- 9.4.4. Footwear and Leather
- 9.4.5. Healthcare
- 9.4.6. Packaging
- 9.4.7. Woodworking And Joinery
- 9.4.8. Other En
- 9.5. Market Analysis, Insights and Forecast - by Geography
- 9.5.1. China
- 9.5.2. India
- 9.5.3. Japan
- 9.5.4. South Korea
- 9.5.5. Indonesia
- 9.5.6. Malaysia
- 9.5.7. Thailand
- 9.5.8. Vietnam
- 9.5.9. Rest of Asia-Pacific
- 9.1. Market Analysis, Insights and Forecast - by Adhesives Resin
- 10. South Korea APAC Sealants & Adhesives Industry Analysis, Insights and Forecast, 2020-2032
- 10.1. Market Analysis, Insights and Forecast - by Adhesives Resin
- 10.1.1. Polyurethane
- 10.1.2. Epoxy
- 10.1.3. Acrylic
- 10.1.4. Silicone
- 10.1.5. Cyanoacrylate
- 10.1.6. VAE/EVA
- 10.1.7. Other Resins (Polyester, Rubber, etc.)
- 10.2. Market Analysis, Insights and Forecast - by Adhesives Technology
- 10.2.1. Solvent-borne
- 10.2.2. Reactive
- 10.2.3. Hot Melt
- 10.2.4. UV Cured Adhesives
- 10.2.5. Water-borne
- 10.3. Market Analysis, Insights and Forecast - by Sealants Resin
- 10.3.1. Silicone
- 10.3.2. Polyurethane
- 10.3.3. Acrylic
- 10.3.4. Epoxy
- 10.3.5. Other Re
- 10.4. Market Analysis, Insights and Forecast - by End-User Industry
- 10.4.1. Aerospace
- 10.4.2. Automotive
- 10.4.3. Building and Construction
- 10.4.4. Footwear and Leather
- 10.4.5. Healthcare
- 10.4.6. Packaging
- 10.4.7. Woodworking And Joinery
- 10.4.8. Other En
- 10.5. Market Analysis, Insights and Forecast - by Geography
- 10.5.1. China
- 10.5.2. India
- 10.5.3. Japan
- 10.5.4. South Korea
- 10.5.5. Indonesia
- 10.5.6. Malaysia
- 10.5.7. Thailand
- 10.5.8. Vietnam
- 10.5.9. Rest of Asia-Pacific
- 10.1. Market Analysis, Insights and Forecast - by Adhesives Resin
- 11. Indonesia APAC Sealants & Adhesives Industry Analysis, Insights and Forecast, 2020-2032
- 11.1. Market Analysis, Insights and Forecast - by Adhesives Resin
- 11.1.1. Polyurethane
- 11.1.2. Epoxy
- 11.1.3. Acrylic
- 11.1.4. Silicone
- 11.1.5. Cyanoacrylate
- 11.1.6. VAE/EVA
- 11.1.7. Other Resins (Polyester, Rubber, etc.)
- 11.2. Market Analysis, Insights and Forecast - by Adhesives Technology
- 11.2.1. Solvent-borne
- 11.2.2. Reactive
- 11.2.3. Hot Melt
- 11.2.4. UV Cured Adhesives
- 11.2.5. Water-borne
- 11.3. Market Analysis, Insights and Forecast - by Sealants Resin
- 11.3.1. Silicone
- 11.3.2. Polyurethane
- 11.3.3. Acrylic
- 11.3.4. Epoxy
- 11.3.5. Other Re
- 11.4. Market Analysis, Insights and Forecast - by End-User Industry
- 11.4.1. Aerospace
- 11.4.2. Automotive
- 11.4.3. Building and Construction
- 11.4.4. Footwear and Leather
- 11.4.5. Healthcare
- 11.4.6. Packaging
- 11.4.7. Woodworking And Joinery
- 11.4.8. Other En
- 11.5. Market Analysis, Insights and Forecast - by Geography
- 11.5.1. China
- 11.5.2. India
- 11.5.3. Japan
- 11.5.4. South Korea
- 11.5.5. Indonesia
- 11.5.6. Malaysia
- 11.5.7. Thailand
- 11.5.8. Vietnam
- 11.5.9. Rest of Asia-Pacific
- 11.1. Market Analysis, Insights and Forecast - by Adhesives Resin
- 12. Malaysia APAC Sealants & Adhesives Industry Analysis, Insights and Forecast, 2020-2032
- 12.1. Market Analysis, Insights and Forecast - by Adhesives Resin
- 12.1.1. Polyurethane
- 12.1.2. Epoxy
- 12.1.3. Acrylic
- 12.1.4. Silicone
- 12.1.5. Cyanoacrylate
- 12.1.6. VAE/EVA
- 12.1.7. Other Resins (Polyester, Rubber, etc.)
- 12.2. Market Analysis, Insights and Forecast - by Adhesives Technology
- 12.2.1. Solvent-borne
- 12.2.2. Reactive
- 12.2.3. Hot Melt
- 12.2.4. UV Cured Adhesives
- 12.2.5. Water-borne
- 12.3. Market Analysis, Insights and Forecast - by Sealants Resin
- 12.3.1. Silicone
- 12.3.2. Polyurethane
- 12.3.3. Acrylic
- 12.3.4. Epoxy
- 12.3.5. Other Re
- 12.4. Market Analysis, Insights and Forecast - by End-User Industry
- 12.4.1. Aerospace
- 12.4.2. Automotive
- 12.4.3. Building and Construction
- 12.4.4. Footwear and Leather
- 12.4.5. Healthcare
- 12.4.6. Packaging
- 12.4.7. Woodworking And Joinery
- 12.4.8. Other En
- 12.5. Market Analysis, Insights and Forecast - by Geography
- 12.5.1. China
- 12.5.2. India
- 12.5.3. Japan
- 12.5.4. South Korea
- 12.5.5. Indonesia
- 12.5.6. Malaysia
- 12.5.7. Thailand
- 12.5.8. Vietnam
- 12.5.9. Rest of Asia-Pacific
- 12.1. Market Analysis, Insights and Forecast - by Adhesives Resin
- 13. Thailand APAC Sealants & Adhesives Industry Analysis, Insights and Forecast, 2020-2032
- 13.1. Market Analysis, Insights and Forecast - by Adhesives Resin
- 13.1.1. Polyurethane
- 13.1.2. Epoxy
- 13.1.3. Acrylic
- 13.1.4. Silicone
- 13.1.5. Cyanoacrylate
- 13.1.6. VAE/EVA
- 13.1.7. Other Resins (Polyester, Rubber, etc.)
- 13.2. Market Analysis, Insights and Forecast - by Adhesives Technology
- 13.2.1. Solvent-borne
- 13.2.2. Reactive
- 13.2.3. Hot Melt
- 13.2.4. UV Cured Adhesives
- 13.2.5. Water-borne
- 13.3. Market Analysis, Insights and Forecast - by Sealants Resin
- 13.3.1. Silicone
- 13.3.2. Polyurethane
- 13.3.3. Acrylic
- 13.3.4. Epoxy
- 13.3.5. Other Re
- 13.4. Market Analysis, Insights and Forecast - by End-User Industry
- 13.4.1. Aerospace
- 13.4.2. Automotive
- 13.4.3. Building and Construction
- 13.4.4. Footwear and Leather
- 13.4.5. Healthcare
- 13.4.6. Packaging
- 13.4.7. Woodworking And Joinery
- 13.4.8. Other En
- 13.5. Market Analysis, Insights and Forecast - by Geography
- 13.5.1. China
- 13.5.2. India
- 13.5.3. Japan
- 13.5.4. South Korea
- 13.5.5. Indonesia
- 13.5.6. Malaysia
- 13.5.7. Thailand
- 13.5.8. Vietnam
- 13.5.9. Rest of Asia-Pacific
- 13.1. Market Analysis, Insights and Forecast - by Adhesives Resin
- 14. Vietnam APAC Sealants & Adhesives Industry Analysis, Insights and Forecast, 2020-2032
- 14.1. Market Analysis, Insights and Forecast - by Adhesives Resin
- 14.1.1. Polyurethane
- 14.1.2. Epoxy
- 14.1.3. Acrylic
- 14.1.4. Silicone
- 14.1.5. Cyanoacrylate
- 14.1.6. VAE/EVA
- 14.1.7. Other Resins (Polyester, Rubber, etc.)
- 14.2. Market Analysis, Insights and Forecast - by Adhesives Technology
- 14.2.1. Solvent-borne
- 14.2.2. Reactive
- 14.2.3. Hot Melt
- 14.2.4. UV Cured Adhesives
- 14.2.5. Water-borne
- 14.3. Market Analysis, Insights and Forecast - by Sealants Resin
- 14.3.1. Silicone
- 14.3.2. Polyurethane
- 14.3.3. Acrylic
- 14.3.4. Epoxy
- 14.3.5. Other Re
- 14.4. Market Analysis, Insights and Forecast - by End-User Industry
- 14.4.1. Aerospace
- 14.4.2. Automotive
- 14.4.3. Building and Construction
- 14.4.4. Footwear and Leather
- 14.4.5. Healthcare
- 14.4.6. Packaging
- 14.4.7. Woodworking And Joinery
- 14.4.8. Other En
- 14.5. Market Analysis, Insights and Forecast - by Geography
- 14.5.1. China
- 14.5.2. India
- 14.5.3. Japan
- 14.5.4. South Korea
- 14.5.5. Indonesia
- 14.5.6. Malaysia
- 14.5.7. Thailand
- 14.5.8. Vietnam
- 14.5.9. Rest of Asia-Pacific
- 14.1. Market Analysis, Insights and Forecast - by Adhesives Resin
- 15. Rest of Asia Pacific APAC Sealants & Adhesives Industry Analysis, Insights and Forecast, 2020-2032
- 15.1. Market Analysis, Insights and Forecast - by Adhesives Resin
- 15.1.1. Polyurethane
- 15.1.2. Epoxy
- 15.1.3. Acrylic
- 15.1.4. Silicone
- 15.1.5. Cyanoacrylate
- 15.1.6. VAE/EVA
- 15.1.7. Other Resins (Polyester, Rubber, etc.)
- 15.2. Market Analysis, Insights and Forecast - by Adhesives Technology
- 15.2.1. Solvent-borne
- 15.2.2. Reactive
- 15.2.3. Hot Melt
- 15.2.4. UV Cured Adhesives
- 15.2.5. Water-borne
- 15.3. Market Analysis, Insights and Forecast - by Sealants Resin
- 15.3.1. Silicone
- 15.3.2. Polyurethane
- 15.3.3. Acrylic
- 15.3.4. Epoxy
- 15.3.5. Other Re
- 15.4. Market Analysis, Insights and Forecast - by End-User Industry
- 15.4.1. Aerospace
- 15.4.2. Automotive
- 15.4.3. Building and Construction
- 15.4.4. Footwear and Leather
- 15.4.5. Healthcare
- 15.4.6. Packaging
- 15.4.7. Woodworking And Joinery
- 15.4.8. Other En
- 15.5. Market Analysis, Insights and Forecast - by Geography
- 15.5.1. China
- 15.5.2. India
- 15.5.3. Japan
- 15.5.4. South Korea
- 15.5.5. Indonesia
- 15.5.6. Malaysia
- 15.5.7. Thailand
- 15.5.8. Vietnam
- 15.5.9. Rest of Asia-Pacific
- 15.1. Market Analysis, Insights and Forecast - by Adhesives Resin
- 16. Competitive Analysis
- 16.1. Company Profiles
- 16.1.1 Sika AG
- 16.1.1.1. Company Overview
- 16.1.1.2. Products
- 16.1.1.3. Company Financials
- 16.1.1.4. SWOT Analysis
- 16.1.2 Huntsman International LLC
- 16.1.2.1. Company Overview
- 16.1.2.2. Products
- 16.1.2.3. Company Financials
- 16.1.2.4. SWOT Analysis
- 16.1.3 Tesa SE (A Beiersdorf Company)
- 16.1.3.1. Company Overview
- 16.1.3.2. Products
- 16.1.3.3. Company Financials
- 16.1.3.4. SWOT Analysis
- 16.1.4 ITW Performance Polymers (Illinois Tool Works Inc )
- 16.1.4.1. Company Overview
- 16.1.4.2. Products
- 16.1.4.3. Company Financials
- 16.1.4.4. SWOT Analysis
- 16.1.5 Henkel AG & Co KGaA
- 16.1.5.1. Company Overview
- 16.1.5.2. Products
- 16.1.5.3. Company Financials
- 16.1.5.4. SWOT Analysis
- 16.1.6 Pidilite Industries Ltd
- 16.1.6.1. Company Overview
- 16.1.6.2. Products
- 16.1.6.3. Company Financials
- 16.1.6.4. SWOT Analysis
- 16.1.7 Beardow Adams
- 16.1.7.1. Company Overview
- 16.1.7.2. Products
- 16.1.7.3. Company Financials
- 16.1.7.4. SWOT Analysis
- 16.1.8 DuPont
- 16.1.8.1. Company Overview
- 16.1.8.2. Products
- 16.1.8.3. Company Financials
- 16.1.8.4. SWOT Analysis
- 16.1.9 Dow
- 16.1.9.1. Company Overview
- 16.1.9.2. Products
- 16.1.9.3. Company Financials
- 16.1.9.4. SWOT Analysis
- 16.1.10 Arkema
- 16.1.10.1. Company Overview
- 16.1.10.2. Products
- 16.1.10.3. Company Financials
- 16.1.10.4. SWOT Analysis
- 16.1.11 H B Fuller Company
- 16.1.11.1. Company Overview
- 16.1.11.2. Products
- 16.1.11.3. Company Financials
- 16.1.11.4. SWOT Analysis
- 16.1.12 3M
- 16.1.12.1. Company Overview
- 16.1.12.2. Products
- 16.1.12.3. Company Financials
- 16.1.12.4. SWOT Analysis
- 16.1.13 Mapei Inc
- 16.1.13.1. Company Overview
- 16.1.13.2. Products
- 16.1.13.3. Company Financials
- 16.1.13.4. SWOT Analysis
- 16.1.14 Dymax Corporation
- 16.1.14.1. Company Overview
- 16.1.14.2. Products
- 16.1.14.3. Company Financials
- 16.1.14.4. SWOT Analysis
- 16.1.15 Avery Dennison Corporation
- 16.1.15.1. Company Overview
- 16.1.15.2. Products
- 16.1.15.3. Company Financials
- 16.1.15.4. SWOT Analysis
- 16.1.16 Wacker Chemie AG*List Not Exhaustive
- 16.1.16.1. Company Overview
- 16.1.16.2. Products
- 16.1.16.3. Company Financials
- 16.1.16.4. SWOT Analysis
- 16.1.17 Jowat AG
- 16.1.17.1. Company Overview
- 16.1.17.2. Products
- 16.1.17.3. Company Financials
- 16.1.17.4. SWOT Analysis
- 16.1.18 Ashland
- 16.1.18.1. Company Overview
- 16.1.18.2. Products
- 16.1.18.3. Company Financials
- 16.1.18.4. SWOT Analysis
- 16.1.19 Franklin International
- 16.1.19.1. Company Overview
- 16.1.19.2. Products
- 16.1.19.3. Company Financials
- 16.1.19.4. SWOT Analysis
- 16.1.1 Sika AG
- 16.2. Market Entropy
- 16.2.1 Company's Key Areas Served
- 16.2.2 Recent Developments
- 16.3. Company Market Share Analysis 2025
- 16.3.1 Top 5 Companies Market Share Analysis
- 16.3.2 Top 3 Companies Market Share Analysis
- 16.4. List of Potential Customers
- 17. Research Methodology
List of Figures
- Figure 1: Global APAC Sealants & Adhesives Industry Revenue Breakdown (Million, %) by Region 2025 & 2033
- Figure 2: China APAC Sealants & Adhesives Industry Revenue (Million), by Adhesives Resin 2025 & 2033
- Figure 3: China APAC Sealants & Adhesives Industry Revenue Share (%), by Adhesives Resin 2025 & 2033
- Figure 4: China APAC Sealants & Adhesives Industry Revenue (Million), by Adhesives Technology 2025 & 2033
- Figure 5: China APAC Sealants & Adhesives Industry Revenue Share (%), by Adhesives Technology 2025 & 2033
- Figure 6: China APAC Sealants & Adhesives Industry Revenue (Million), by Sealants Resin 2025 & 2033
- Figure 7: China APAC Sealants & Adhesives Industry Revenue Share (%), by Sealants Resin 2025 & 2033
- Figure 8: China APAC Sealants & Adhesives Industry Revenue (Million), by End-User Industry 2025 & 2033
- Figure 9: China APAC Sealants & Adhesives Industry Revenue Share (%), by End-User Industry 2025 & 2033
- Figure 10: China APAC Sealants & Adhesives Industry Revenue (Million), by Geography 2025 & 2033
- Figure 11: China APAC Sealants & Adhesives Industry Revenue Share (%), by Geography 2025 & 2033
- Figure 12: China APAC Sealants & Adhesives Industry Revenue (Million), by Country 2025 & 2033
- Figure 13: China APAC Sealants & Adhesives Industry Revenue Share (%), by Country 2025 & 2033
- Figure 14: India APAC Sealants & Adhesives Industry Revenue (Million), by Adhesives Resin 2025 & 2033
- Figure 15: India APAC Sealants & Adhesives Industry Revenue Share (%), by Adhesives Resin 2025 & 2033
- Figure 16: India APAC Sealants & Adhesives Industry Revenue (Million), by Adhesives Technology 2025 & 2033
- Figure 17: India APAC Sealants & Adhesives Industry Revenue Share (%), by Adhesives Technology 2025 & 2033
- Figure 18: India APAC Sealants & Adhesives Industry Revenue (Million), by Sealants Resin 2025 & 2033
- Figure 19: India APAC Sealants & Adhesives Industry Revenue Share (%), by Sealants Resin 2025 & 2033
- Figure 20: India APAC Sealants & Adhesives Industry Revenue (Million), by End-User Industry 2025 & 2033
- Figure 21: India APAC Sealants & Adhesives Industry Revenue Share (%), by End-User Industry 2025 & 2033
- Figure 22: India APAC Sealants & Adhesives Industry Revenue (Million), by Geography 2025 & 2033
- Figure 23: India APAC Sealants & Adhesives Industry Revenue Share (%), by Geography 2025 & 2033
- Figure 24: India APAC Sealants & Adhesives Industry Revenue (Million), by Country 2025 & 2033
- Figure 25: India APAC Sealants & Adhesives Industry Revenue Share (%), by Country 2025 & 2033
- Figure 26: Japan APAC Sealants & Adhesives Industry Revenue (Million), by Adhesives Resin 2025 & 2033
- Figure 27: Japan APAC Sealants & Adhesives Industry Revenue Share (%), by Adhesives Resin 2025 & 2033
- Figure 28: Japan APAC Sealants & Adhesives Industry Revenue (Million), by Adhesives Technology 2025 & 2033
- Figure 29: Japan APAC Sealants & Adhesives Industry Revenue Share (%), by Adhesives Technology 2025 & 2033
- Figure 30: Japan APAC Sealants & Adhesives Industry Revenue (Million), by Sealants Resin 2025 & 2033
- Figure 31: Japan APAC Sealants & Adhesives Industry Revenue Share (%), by Sealants Resin 2025 & 2033
- Figure 32: Japan APAC Sealants & Adhesives Industry Revenue (Million), by End-User Industry 2025 & 2033
- Figure 33: Japan APAC Sealants & Adhesives Industry Revenue Share (%), by End-User Industry 2025 & 2033
- Figure 34: Japan APAC Sealants & Adhesives Industry Revenue (Million), by Geography 2025 & 2033
- Figure 35: Japan APAC Sealants & Adhesives Industry Revenue Share (%), by Geography 2025 & 2033
- Figure 36: Japan APAC Sealants & Adhesives Industry Revenue (Million), by Country 2025 & 2033
- Figure 37: Japan APAC Sealants & Adhesives Industry Revenue Share (%), by Country 2025 & 2033
- Figure 38: South Korea APAC Sealants & Adhesives Industry Revenue (Million), by Adhesives Resin 2025 & 2033
- Figure 39: South Korea APAC Sealants & Adhesives Industry Revenue Share (%), by Adhesives Resin 2025 & 2033
- Figure 40: South Korea APAC Sealants & Adhesives Industry Revenue (Million), by Adhesives Technology 2025 & 2033
- Figure 41: South Korea APAC Sealants & Adhesives Industry Revenue Share (%), by Adhesives Technology 2025 & 2033
- Figure 42: South Korea APAC Sealants & Adhesives Industry Revenue (Million), by Sealants Resin 2025 & 2033
- Figure 43: South Korea APAC Sealants & Adhesives Industry Revenue Share (%), by Sealants Resin 2025 & 2033
- Figure 44: South Korea APAC Sealants & Adhesives Industry Revenue (Million), by End-User Industry 2025 & 2033
- Figure 45: South Korea APAC Sealants & Adhesives Industry Revenue Share (%), by End-User Industry 2025 & 2033
- Figure 46: South Korea APAC Sealants & Adhesives Industry Revenue (Million), by Geography 2025 & 2033
- Figure 47: South Korea APAC Sealants & Adhesives Industry Revenue Share (%), by Geography 2025 & 2033
- Figure 48: South Korea APAC Sealants & Adhesives Industry Revenue (Million), by Country 2025 & 2033
- Figure 49: South Korea APAC Sealants & Adhesives Industry Revenue Share (%), by Country 2025 & 2033
- Figure 50: Indonesia APAC Sealants & Adhesives Industry Revenue (Million), by Adhesives Resin 2025 & 2033
- Figure 51: Indonesia APAC Sealants & Adhesives Industry Revenue Share (%), by Adhesives Resin 2025 & 2033
- Figure 52: Indonesia APAC Sealants & Adhesives Industry Revenue (Million), by Adhesives Technology 2025 & 2033
- Figure 53: Indonesia APAC Sealants & Adhesives Industry Revenue Share (%), by Adhesives Technology 2025 & 2033
- Figure 54: Indonesia APAC Sealants & Adhesives Industry Revenue (Million), by Sealants Resin 2025 & 2033
- Figure 55: Indonesia APAC Sealants & Adhesives Industry Revenue Share (%), by Sealants Resin 2025 & 2033
- Figure 56: Indonesia APAC Sealants & Adhesives Industry Revenue (Million), by End-User Industry 2025 & 2033
- Figure 57: Indonesia APAC Sealants & Adhesives Industry Revenue Share (%), by End-User Industry 2025 & 2033
- Figure 58: Indonesia APAC Sealants & Adhesives Industry Revenue (Million), by Geography 2025 & 2033
- Figure 59: Indonesia APAC Sealants & Adhesives Industry Revenue Share (%), by Geography 2025 & 2033
- Figure 60: Indonesia APAC Sealants & Adhesives Industry Revenue (Million), by Country 2025 & 2033
- Figure 61: Indonesia APAC Sealants & Adhesives Industry Revenue Share (%), by Country 2025 & 2033
- Figure 62: Malaysia APAC Sealants & Adhesives Industry Revenue (Million), by Adhesives Resin 2025 & 2033
- Figure 63: Malaysia APAC Sealants & Adhesives Industry Revenue Share (%), by Adhesives Resin 2025 & 2033
- Figure 64: Malaysia APAC Sealants & Adhesives Industry Revenue (Million), by Adhesives Technology 2025 & 2033
- Figure 65: Malaysia APAC Sealants & Adhesives Industry Revenue Share (%), by Adhesives Technology 2025 & 2033
- Figure 66: Malaysia APAC Sealants & Adhesives Industry Revenue (Million), by Sealants Resin 2025 & 2033
- Figure 67: Malaysia APAC Sealants & Adhesives Industry Revenue Share (%), by Sealants Resin 2025 & 2033
- Figure 68: Malaysia APAC Sealants & Adhesives Industry Revenue (Million), by End-User Industry 2025 & 2033
- Figure 69: Malaysia APAC Sealants & Adhesives Industry Revenue Share (%), by End-User Industry 2025 & 2033
- Figure 70: Malaysia APAC Sealants & Adhesives Industry Revenue (Million), by Geography 2025 & 2033
- Figure 71: Malaysia APAC Sealants & Adhesives Industry Revenue Share (%), by Geography 2025 & 2033
- Figure 72: Malaysia APAC Sealants & Adhesives Industry Revenue (Million), by Country 2025 & 2033
- Figure 73: Malaysia APAC Sealants & Adhesives Industry Revenue Share (%), by Country 2025 & 2033
- Figure 74: Thailand APAC Sealants & Adhesives Industry Revenue (Million), by Adhesives Resin 2025 & 2033
- Figure 75: Thailand APAC Sealants & Adhesives Industry Revenue Share (%), by Adhesives Resin 2025 & 2033
- Figure 76: Thailand APAC Sealants & Adhesives Industry Revenue (Million), by Adhesives Technology 2025 & 2033
- Figure 77: Thailand APAC Sealants & Adhesives Industry Revenue Share (%), by Adhesives Technology 2025 & 2033
- Figure 78: Thailand APAC Sealants & Adhesives Industry Revenue (Million), by Sealants Resin 2025 & 2033
- Figure 79: Thailand APAC Sealants & Adhesives Industry Revenue Share (%), by Sealants Resin 2025 & 2033
- Figure 80: Thailand APAC Sealants & Adhesives Industry Revenue (Million), by End-User Industry 2025 & 2033
- Figure 81: Thailand APAC Sealants & Adhesives Industry Revenue Share (%), by End-User Industry 2025 & 2033
- Figure 82: Thailand APAC Sealants & Adhesives Industry Revenue (Million), by Geography 2025 & 2033
- Figure 83: Thailand APAC Sealants & Adhesives Industry Revenue Share (%), by Geography 2025 & 2033
- Figure 84: Thailand APAC Sealants & Adhesives Industry Revenue (Million), by Country 2025 & 2033
- Figure 85: Thailand APAC Sealants & Adhesives Industry Revenue Share (%), by Country 2025 & 2033
- Figure 86: Vietnam APAC Sealants & Adhesives Industry Revenue (Million), by Adhesives Resin 2025 & 2033
- Figure 87: Vietnam APAC Sealants & Adhesives Industry Revenue Share (%), by Adhesives Resin 2025 & 2033
- Figure 88: Vietnam APAC Sealants & Adhesives Industry Revenue (Million), by Adhesives Technology 2025 & 2033
- Figure 89: Vietnam APAC Sealants & Adhesives Industry Revenue Share (%), by Adhesives Technology 2025 & 2033
- Figure 90: Vietnam APAC Sealants & Adhesives Industry Revenue (Million), by Sealants Resin 2025 & 2033
- Figure 91: Vietnam APAC Sealants & Adhesives Industry Revenue Share (%), by Sealants Resin 2025 & 2033
- Figure 92: Vietnam APAC Sealants & Adhesives Industry Revenue (Million), by End-User Industry 2025 & 2033
- Figure 93: Vietnam APAC Sealants & Adhesives Industry Revenue Share (%), by End-User Industry 2025 & 2033
- Figure 94: Vietnam APAC Sealants & Adhesives Industry Revenue (Million), by Geography 2025 & 2033
- Figure 95: Vietnam APAC Sealants & Adhesives Industry Revenue Share (%), by Geography 2025 & 2033
- Figure 96: Vietnam APAC Sealants & Adhesives Industry Revenue (Million), by Country 2025 & 2033
- Figure 97: Vietnam APAC Sealants & Adhesives Industry Revenue Share (%), by Country 2025 & 2033
- Figure 98: Rest of Asia Pacific APAC Sealants & Adhesives Industry Revenue (Million), by Adhesives Resin 2025 & 2033
- Figure 99: Rest of Asia Pacific APAC Sealants & Adhesives Industry Revenue Share (%), by Adhesives Resin 2025 & 2033
- Figure 100: Rest of Asia Pacific APAC Sealants & Adhesives Industry Revenue (Million), by Adhesives Technology 2025 & 2033
- Figure 101: Rest of Asia Pacific APAC Sealants & Adhesives Industry Revenue Share (%), by Adhesives Technology 2025 & 2033
- Figure 102: Rest of Asia Pacific APAC Sealants & Adhesives Industry Revenue (Million), by Sealants Resin 2025 & 2033
- Figure 103: Rest of Asia Pacific APAC Sealants & Adhesives Industry Revenue Share (%), by Sealants Resin 2025 & 2033
- Figure 104: Rest of Asia Pacific APAC Sealants & Adhesives Industry Revenue (Million), by End-User Industry 2025 & 2033
- Figure 105: Rest of Asia Pacific APAC Sealants & Adhesives Industry Revenue Share (%), by End-User Industry 2025 & 2033
- Figure 106: Rest of Asia Pacific APAC Sealants & Adhesives Industry Revenue (Million), by Geography 2025 & 2033
- Figure 107: Rest of Asia Pacific APAC Sealants & Adhesives Industry Revenue Share (%), by Geography 2025 & 2033
- Figure 108: Rest of Asia Pacific APAC Sealants & Adhesives Industry Revenue (Million), by Country 2025 & 2033
- Figure 109: Rest of Asia Pacific APAC Sealants & Adhesives Industry Revenue Share (%), by Country 2025 & 2033
List of Tables
- Table 1: Global APAC Sealants & Adhesives Industry Revenue Million Forecast, by Adhesives Resin 2020 & 2033
- Table 2: Global APAC Sealants & Adhesives Industry Revenue Million Forecast, by Adhesives Technology 2020 & 2033
- Table 3: Global APAC Sealants & Adhesives Industry Revenue Million Forecast, by Sealants Resin 2020 & 2033
- Table 4: Global APAC Sealants & Adhesives Industry Revenue Million Forecast, by End-User Industry 2020 & 2033
- Table 5: Global APAC Sealants & Adhesives Industry Revenue Million Forecast, by Geography 2020 & 2033
- Table 6: Global APAC Sealants & Adhesives Industry Revenue Million Forecast, by Region 2020 & 2033
- Table 7: Global APAC Sealants & Adhesives Industry Revenue Million Forecast, by Adhesives Resin 2020 & 2033
- Table 8: Global APAC Sealants & Adhesives Industry Revenue Million Forecast, by Adhesives Technology 2020 & 2033
- Table 9: Global APAC Sealants & Adhesives Industry Revenue Million Forecast, by Sealants Resin 2020 & 2033
- Table 10: Global APAC Sealants & Adhesives Industry Revenue Million Forecast, by End-User Industry 2020 & 2033
- Table 11: Global APAC Sealants & Adhesives Industry Revenue Million Forecast, by Geography 2020 & 2033
- Table 12: Global APAC Sealants & Adhesives Industry Revenue Million Forecast, by Country 2020 & 2033
- Table 13: Global APAC Sealants & Adhesives Industry Revenue Million Forecast, by Adhesives Resin 2020 & 2033
- Table 14: Global APAC Sealants & Adhesives Industry Revenue Million Forecast, by Adhesives Technology 2020 & 2033
- Table 15: Global APAC Sealants & Adhesives Industry Revenue Million Forecast, by Sealants Resin 2020 & 2033
- Table 16: Global APAC Sealants & Adhesives Industry Revenue Million Forecast, by End-User Industry 2020 & 2033
- Table 17: Global APAC Sealants & Adhesives Industry Revenue Million Forecast, by Geography 2020 & 2033
- Table 18: Global APAC Sealants & Adhesives Industry Revenue Million Forecast, by Country 2020 & 2033
- Table 19: Global APAC Sealants & Adhesives Industry Revenue Million Forecast, by Adhesives Resin 2020 & 2033
- Table 20: Global APAC Sealants & Adhesives Industry Revenue Million Forecast, by Adhesives Technology 2020 & 2033
- Table 21: Global APAC Sealants & Adhesives Industry Revenue Million Forecast, by Sealants Resin 2020 & 2033
- Table 22: Global APAC Sealants & Adhesives Industry Revenue Million Forecast, by End-User Industry 2020 & 2033
- Table 23: Global APAC Sealants & Adhesives Industry Revenue Million Forecast, by Geography 2020 & 2033
- Table 24: Global APAC Sealants & Adhesives Industry Revenue Million Forecast, by Country 2020 & 2033
- Table 25: Global APAC Sealants & Adhesives Industry Revenue Million Forecast, by Adhesives Resin 2020 & 2033
- Table 26: Global APAC Sealants & Adhesives Industry Revenue Million Forecast, by Adhesives Technology 2020 & 2033
- Table 27: Global APAC Sealants & Adhesives Industry Revenue Million Forecast, by Sealants Resin 2020 & 2033
- Table 28: Global APAC Sealants & Adhesives Industry Revenue Million Forecast, by End-User Industry 2020 & 2033
- Table 29: Global APAC Sealants & Adhesives Industry Revenue Million Forecast, by Geography 2020 & 2033
- Table 30: Global APAC Sealants & Adhesives Industry Revenue Million Forecast, by Country 2020 & 2033
- Table 31: Global APAC Sealants & Adhesives Industry Revenue Million Forecast, by Adhesives Resin 2020 & 2033
- Table 32: Global APAC Sealants & Adhesives Industry Revenue Million Forecast, by Adhesives Technology 2020 & 2033
- Table 33: Global APAC Sealants & Adhesives Industry Revenue Million Forecast, by Sealants Resin 2020 & 2033
- Table 34: Global APAC Sealants & Adhesives Industry Revenue Million Forecast, by End-User Industry 2020 & 2033
- Table 35: Global APAC Sealants & Adhesives Industry Revenue Million Forecast, by Geography 2020 & 2033
- Table 36: Global APAC Sealants & Adhesives Industry Revenue Million Forecast, by Country 2020 & 2033
- Table 37: Global APAC Sealants & Adhesives Industry Revenue Million Forecast, by Adhesives Resin 2020 & 2033
- Table 38: Global APAC Sealants & Adhesives Industry Revenue Million Forecast, by Adhesives Technology 2020 & 2033
- Table 39: Global APAC Sealants & Adhesives Industry Revenue Million Forecast, by Sealants Resin 2020 & 2033
- Table 40: Global APAC Sealants & Adhesives Industry Revenue Million Forecast, by End-User Industry 2020 & 2033
- Table 41: Global APAC Sealants & Adhesives Industry Revenue Million Forecast, by Geography 2020 & 2033
- Table 42: Global APAC Sealants & Adhesives Industry Revenue Million Forecast, by Country 2020 & 2033
- Table 43: Global APAC Sealants & Adhesives Industry Revenue Million Forecast, by Adhesives Resin 2020 & 2033
- Table 44: Global APAC Sealants & Adhesives Industry Revenue Million Forecast, by Adhesives Technology 2020 & 2033
- Table 45: Global APAC Sealants & Adhesives Industry Revenue Million Forecast, by Sealants Resin 2020 & 2033
- Table 46: Global APAC Sealants & Adhesives Industry Revenue Million Forecast, by End-User Industry 2020 & 2033
- Table 47: Global APAC Sealants & Adhesives Industry Revenue Million Forecast, by Geography 2020 & 2033
- Table 48: Global APAC Sealants & Adhesives Industry Revenue Million Forecast, by Country 2020 & 2033
- Table 49: Global APAC Sealants & Adhesives Industry Revenue Million Forecast, by Adhesives Resin 2020 & 2033
- Table 50: Global APAC Sealants & Adhesives Industry Revenue Million Forecast, by Adhesives Technology 2020 & 2033
- Table 51: Global APAC Sealants & Adhesives Industry Revenue Million Forecast, by Sealants Resin 2020 & 2033
- Table 52: Global APAC Sealants & Adhesives Industry Revenue Million Forecast, by End-User Industry 2020 & 2033
- Table 53: Global APAC Sealants & Adhesives Industry Revenue Million Forecast, by Geography 2020 & 2033
- Table 54: Global APAC Sealants & Adhesives Industry Revenue Million Forecast, by Country 2020 & 2033
- Table 55: Global APAC Sealants & Adhesives Industry Revenue Million Forecast, by Adhesives Resin 2020 & 2033
- Table 56: Global APAC Sealants & Adhesives Industry Revenue Million Forecast, by Adhesives Technology 2020 & 2033
- Table 57: Global APAC Sealants & Adhesives Industry Revenue Million Forecast, by Sealants Resin 2020 & 2033
- Table 58: Global APAC Sealants & Adhesives Industry Revenue Million Forecast, by End-User Industry 2020 & 2033
- Table 59: Global APAC Sealants & Adhesives Industry Revenue Million Forecast, by Geography 2020 & 2033
- Table 60: Global APAC Sealants & Adhesives Industry Revenue Million Forecast, by Country 2020 & 2033
Frequently Asked Questions
1. What is the projected Compound Annual Growth Rate (CAGR) of the APAC Sealants & Adhesives Industry?
The projected CAGR is approximately > 6.00%.
2. Which companies are prominent players in the APAC Sealants & Adhesives Industry?
Key companies in the market include Sika AG, Huntsman International LLC, Tesa SE (A Beiersdorf Company), ITW Performance Polymers (Illinois Tool Works Inc ), Henkel AG & Co KGaA, Pidilite Industries Ltd, Beardow Adams, DuPont, Dow, Arkema, H B Fuller Company, 3M, Mapei Inc, Dymax Corporation, Avery Dennison Corporation, Wacker Chemie AG*List Not Exhaustive, Jowat AG, Ashland, Franklin International.
3. What are the main segments of the APAC Sealants & Adhesives Industry?
The market segments include Adhesives Resin, Adhesives Technology, Sealants Resin, End-User Industry, Geography.
4. Can you provide details about the market size?
The market size is estimated to be USD 30.26 Million as of 2022.
5. What are some drivers contributing to market growth?
Growing Packaging Industry in South-East Asia Countries; Growing Demand in Construction Sector; Other Drivers.
6. What are the notable trends driving market growth?
Packaging Segment to Dominate the Market.
7. Are there any restraints impacting market growth?
Stringent Environmental Regulations Regarding VOC Emissions; High Fluctuations in Raw Material Pricing.
8. Can you provide examples of recent developments in the market?
N/A
9. What pricing options are available for accessing the report?
Pricing options include single-user, multi-user, and enterprise licenses priced at USD 4750, USD 5250, and USD 8750 respectively.
10. Is the market size provided in terms of value or volume?
The market size is provided in terms of value, measured in Million.
11. Are there any specific market keywords associated with the report?
Yes, the market keyword associated with the report is "APAC Sealants & Adhesives Industry," which aids in identifying and referencing the specific market segment covered.
12. How do I determine which pricing option suits my needs best?
The pricing options vary based on user requirements and access needs. Individual users may opt for single-user licenses, while businesses requiring broader access may choose multi-user or enterprise licenses for cost-effective access to the report.
13. Are there any additional resources or data provided in the APAC Sealants & Adhesives Industry report?
While the report offers comprehensive insights, it's advisable to review the specific contents or supplementary materials provided to ascertain if additional resources or data are available.
14. How can I stay updated on further developments or reports in the APAC Sealants & Adhesives Industry?
To stay informed about further developments, trends, and reports in the APAC Sealants & Adhesives Industry, consider subscribing to industry newsletters, following relevant companies and organizations, or regularly checking reputable industry news sources and publications.
Methodology
Step 1 - Identification of Relevant Samples Size from Population Database


Step 2 - Approaches for Defining Global Market Size (Value, Volume* & Price*)

Note*: In applicable scenarios
Step 3 - Data Sources
Primary Research
- Web Analytics
- Survey Reports
- Research Institute
- Latest Research Reports
- Opinion Leaders
Secondary Research
- Annual Reports
- White Paper
- Latest Press Release
- Industry Association
- Paid Database
- Investor Presentations

Step 4 - Data Triangulation
Involves using different sources of information in order to increase the validity of a study
These sources are likely to be stakeholders in a program - participants, other researchers, program staff, other community members, and so on.
Then we put all data in single framework & apply various statistical tools to find out the dynamic on the market.
During the analysis stage, feedback from the stakeholder groups would be compared to determine areas of agreement as well as areas of divergence