Key Insights
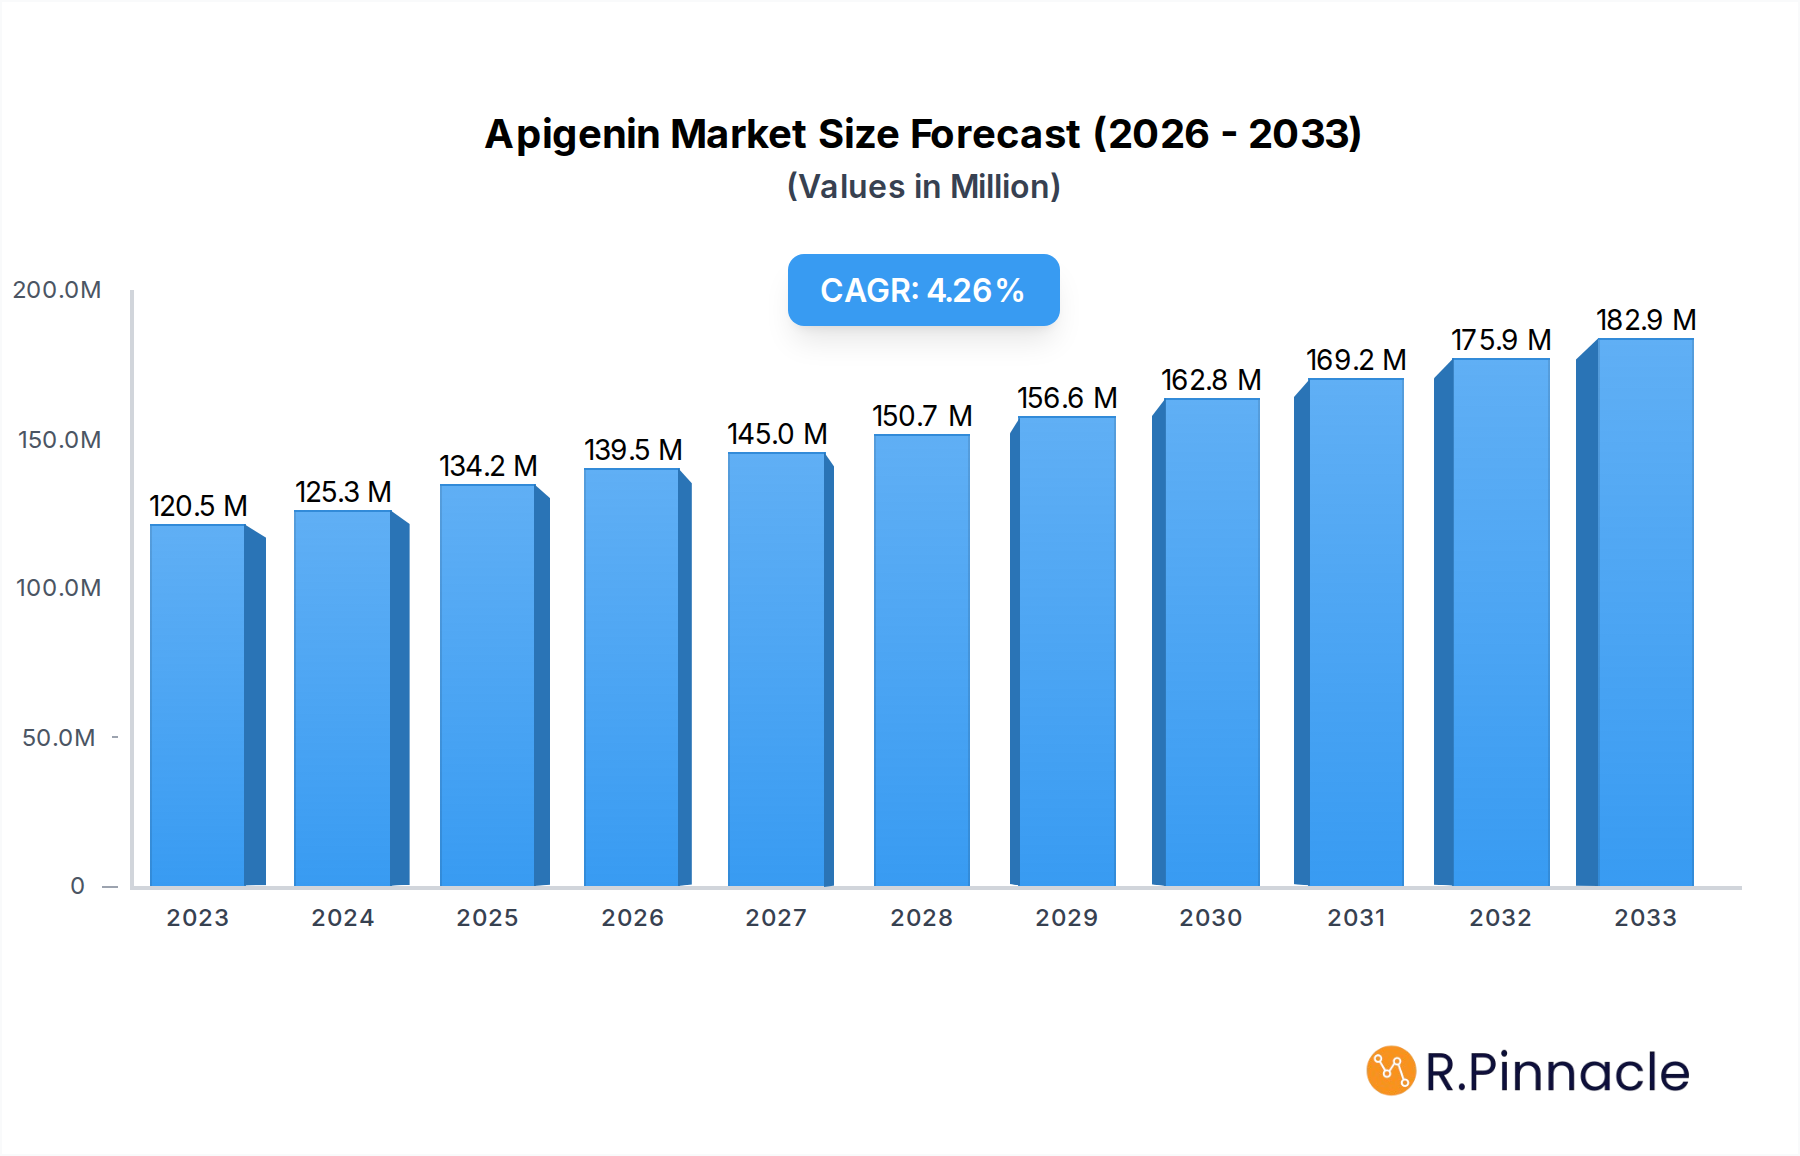
The global Apigenin market is poised for significant expansion, projected to reach a substantial $134.2 million by 2025. This growth is underpinned by a steady Compound Annual Growth Rate (CAGR) of 3.7%, indicating a robust and sustained upward trajectory for the market over the forecast period. The increasing demand for natural ingredients across various industries, particularly in pharmaceuticals and healthcare, is a primary driver. Apigenin, a naturally occurring flavonoid, is gaining traction for its potent antioxidant, anti-inflammatory, and potential anti-cancer properties, making it a sought-after ingredient in dietary supplements and therapeutic formulations. Furthermore, its application in the food additive sector for its natural preservative qualities and in the cosmetic and skincare industry for its anti-aging and skin-soothing benefits are contributing significantly to market buoyancy. Emerging applications in research and development further bolster the market's positive outlook.
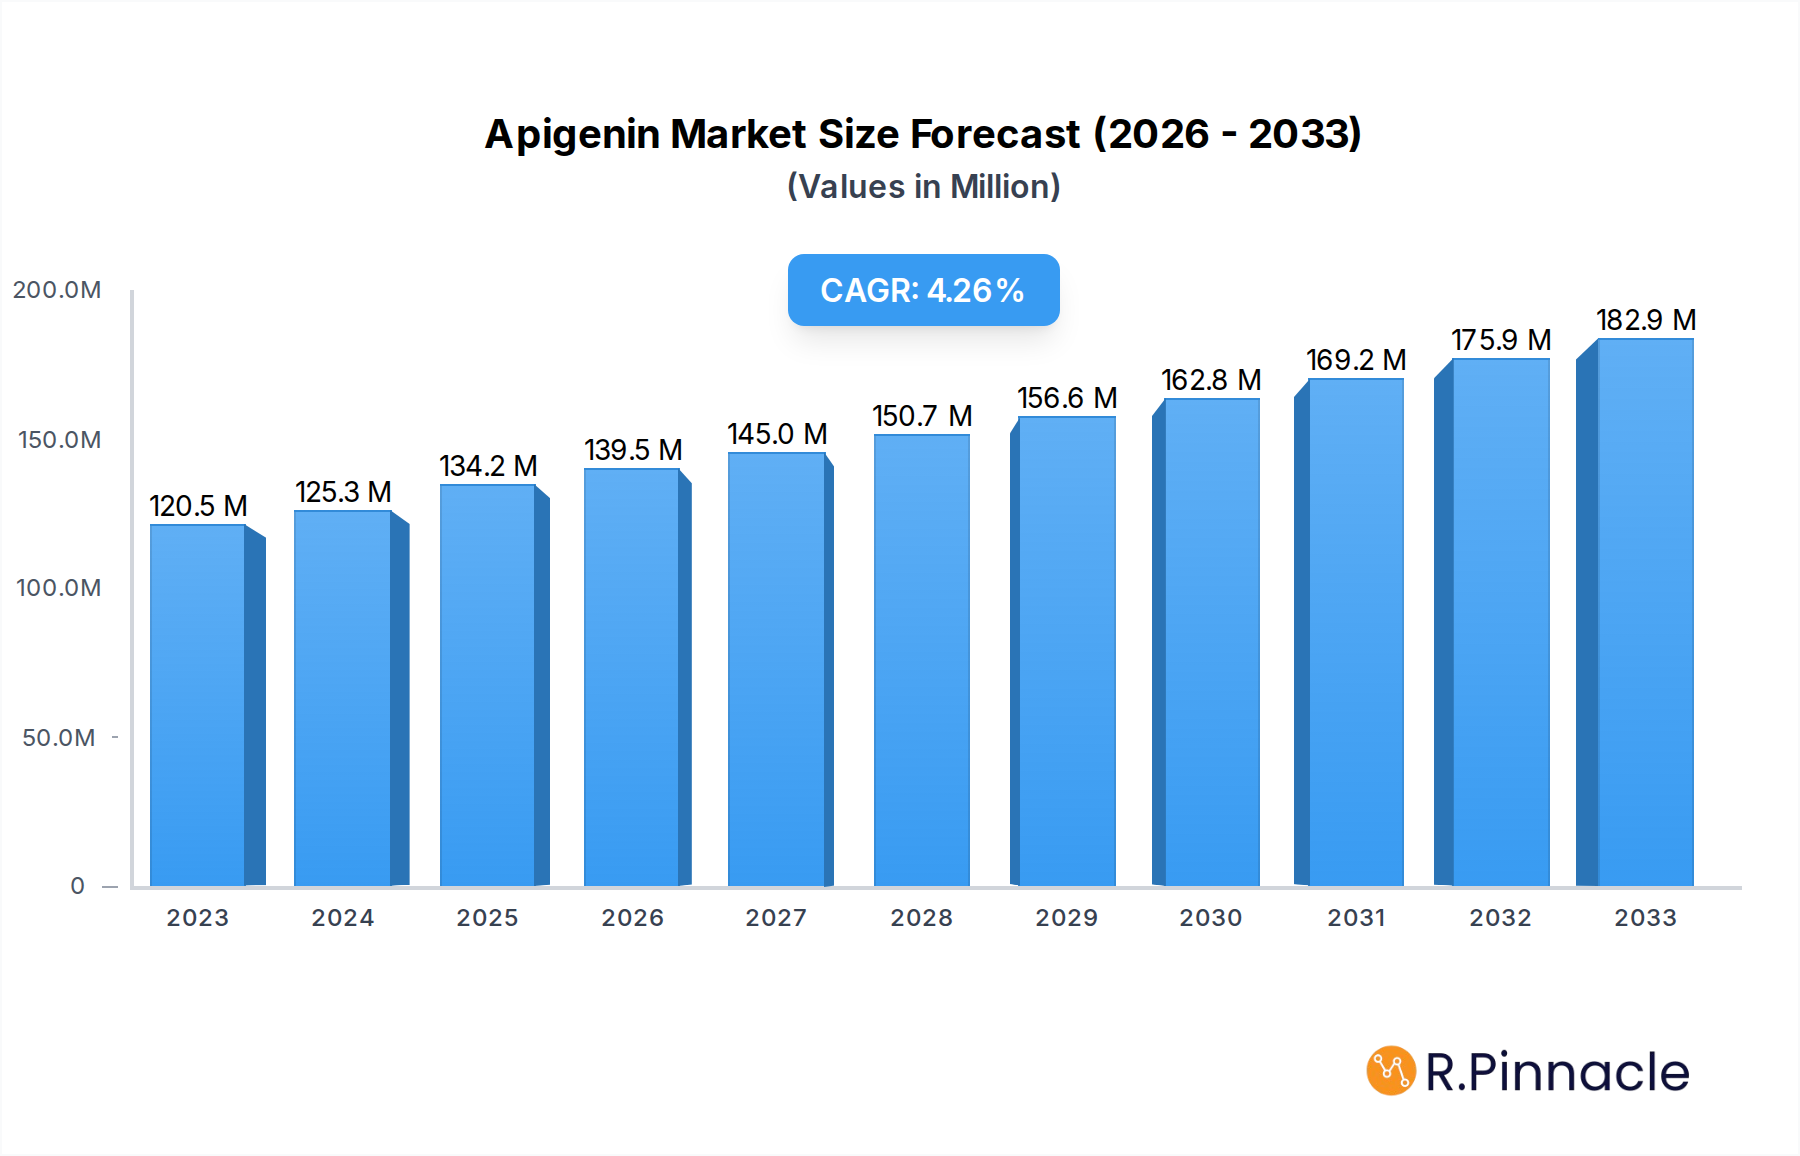
Apigenin Market Size (In Million)

The market's expansion is further fueled by evolving consumer preferences towards natural and plant-based products, a trend that continues to gain momentum globally. Technological advancements in extraction and purification processes are also enhancing the accessibility and quality of Apigenin, thereby supporting its wider adoption. While the market exhibits strong growth, potential restraints such as the fluctuating availability of raw materials and stringent regulatory landscapes in certain regions may pose challenges. However, the overarching positive sentiment driven by research into new therapeutic uses and the increasing awareness of Apigenin's health benefits are expected to outweigh these hurdles. The market is characterized by a competitive landscape with key players focusing on R&D, strategic partnerships, and expanding their product portfolios to cater to diverse industry needs, ensuring continued innovation and market penetration.
Apigenin Company Market Share
Comprehensive Apigenin Market Report: Navigating Innovation and Growth (2019-2033)
This in-depth report offers a strategic analysis of the global Apigenin market, forecasting robust growth driven by its widespread applications in pharmaceuticals, healthcare, food, and cosmetics. Spanning from 2019 to 2033, with a base year of 2025, this report provides actionable insights for industry stakeholders, detailing market dynamics, competitive landscapes, and emerging opportunities.
Apigenin Market Structure & Innovation Trends
The global Apigenin market exhibits a moderately concentrated structure, with key players investing significantly in research and development to enhance product purity and expand application portfolios. Innovation drivers include the growing demand for natural bioactive compounds, advancements in extraction and synthesis technologies, and a deeper understanding of Apigenin's therapeutic and cosmetic benefits. Regulatory frameworks are evolving to support the integration of Apigenin in various product categories, particularly in food and pharmaceuticals, while stringent quality control measures are becoming standard. Product substitutes, primarily other flavonoids and synthetic compounds, pose a moderate competitive threat. End-user demographics are increasingly shifting towards health-conscious consumers seeking natural alternatives. Mergers and acquisitions (M&A) activities are expected to play a crucial role in market consolidation, with estimated M&A deal values reaching over $500 million in the forecast period. Market share for leading companies is projected to be distributed, with the top five players holding approximately 35% of the market.
Apigenin Market Dynamics & Trends
The Apigenin market is poised for substantial expansion, fueled by a confluence of potent growth drivers. The escalating global interest in natural and plant-derived ingredients across diverse sectors is a primary catalyst. Consumers are increasingly prioritizing health and wellness, actively seeking out products with scientifically validated benefits, and Apigenin, renowned for its antioxidant, anti-inflammatory, and anti-cancer properties, perfectly aligns with this trend. The pharmaceutical and healthcare industries are witnessing a significant surge in demand for Apigenin as a therapeutic agent for various conditions, including neurodegenerative diseases, cardiovascular issues, and cancer adjuvant therapy. Its role in dietary supplements and nutraceuticals further amplifies its market penetration.
Technological disruptions in extraction and purification methods are contributing to higher yields and improved purity of Apigenin, making it more cost-effective and accessible for broader applications. Advancements in biotechnology and chemical synthesis are also opening new avenues for its production and application. Consumer preferences are rapidly evolving towards clean-label products, driving the demand for naturally sourced ingredients like Apigenin in food additives and cosmetic formulations. This shift is particularly evident in the premium segment of the cosmetic industry, where Apigenin’s anti-aging and skin-soothing properties are highly valued.
The competitive dynamics within the Apigenin market are characterized by a blend of established manufacturers and emerging players, each vying for market share through product innovation, strategic partnerships, and market penetration strategies. The CAGR for the Apigenin market is estimated to be approximately 7.5% during the forecast period (2025–2033), with market penetration expected to exceed 60% in key developed regions by 2030. The increasing regulatory approvals for Apigenin in various countries further bolster market growth.
Dominant Regions & Segments in Apigenin
North America currently leads the global Apigenin market, driven by a strong emphasis on health and wellness, a robust pharmaceutical industry, and a growing consumer appetite for natural ingredients. The United States, in particular, accounts for a significant share due to extensive research and development activities and established regulatory pathways for nutraceuticals and dietary supplements.
- Application: The Pharma and Healthcare segment is the dominant application, projected to capture over 45% of the market share by 2033. This dominance is attributed to extensive clinical research validating Apigenin’s therapeutic potential in areas such as oncology, neurology, and inflammatory diseases. The growing preference for natural remedies and adjunct therapies further propels this segment.
- Types: The 0.98 purity type of Apigenin is the most sought-after, commanding an estimated 60% market share. This high purity level ensures efficacy and safety, making it ideal for pharmaceutical and high-end cosmetic applications. The demand for 0.95 purity also remains substantial, particularly in food additive and dietary supplement formulations where cost-effectiveness is a key consideration.
- Geographic Dominance within North America: The United States is the leading country within North America, showcasing advanced manufacturing capabilities, high disposable incomes, and a strong regulatory framework supporting the growth of natural product markets. Economic policies favoring research and innovation, coupled with well-established healthcare and cosmetic industries, create a fertile ground for Apigenin.
- Key Drivers of Regional Dominance:
- Economic Policies: Government incentives for R&D in the biopharmaceutical and natural products sector.
- Infrastructure: Advanced manufacturing facilities and robust supply chains for ingredient sourcing and distribution.
- Consumer Awareness: High consumer awareness regarding health benefits of natural compounds.
- Regulatory Landscape: Clear and supportive regulatory pathways for Apigenin in food and pharmaceutical applications.
Apigenin Product Innovations
Recent product innovations in the Apigenin market center on enhanced bioavailability and targeted delivery systems. Companies are developing novel formulations, such as nano-encapsulated Apigenin and liposomal delivery, to improve absorption and efficacy, especially in pharmaceutical applications. Innovations also include the development of standardized Apigenin extracts with specific purity profiles, catering to the stringent requirements of the cosmetic and nutraceutical industries. These advancements offer competitive advantages by addressing limitations of conventional forms and expanding therapeutic and cosmetic applications.
Report Scope & Segmentation Analysis
This report encompasses a comprehensive segmentation of the Apigenin market.
- Application: The market is segmented into Pharma and Healthcare, Food Additives, Cosmetic and Skin Care, and Others. The Pharma and Healthcare segment is projected to witness the highest growth rate, exceeding 8% CAGR, driven by ongoing clinical trials and increasing adoption as a therapeutic agent.
- Types: Apigenin is categorized into 0.95, 0.98, and Others. The 0.98 purity segment is expected to dominate the market with a significant market share, reflecting its demand in high-value applications. The 0.95 segment will maintain a steady presence, especially in the food industry.
Key Drivers of Apigenin Growth
The growth of the Apigenin market is propelled by several key drivers. The increasing global consumer preference for natural and plant-derived ingredients in health and wellness products is a significant factor. Technological advancements in extraction and purification methods are leading to higher yields and improved purity, making Apigenin more accessible and cost-effective. Furthermore, growing scientific evidence supporting Apigenin’s diverse health benefits, including its antioxidant, anti-inflammatory, and potential anti-cancer properties, is driving its adoption in the pharmaceutical and nutraceutical sectors. Favorable regulatory environments in key markets are also facilitating its integration into various product categories.
Challenges in the Apigenin Sector
Despite its promising growth, the Apigenin sector faces several challenges. Regulatory Hurdles: Navigating complex and varied regulatory landscapes across different countries for its approval in specific applications, particularly in pharmaceuticals, can be time-consuming and costly. Supply Chain Issues: Ensuring a consistent and sustainable supply of high-quality Apigenin raw materials, often derived from natural sources like chamomile and parsley, can be challenging due to agricultural variations and geopolitical factors. Competitive Pressures: Intense competition from other natural flavonoids and synthetic compounds offering similar health benefits presents a constant challenge to market share. Standardization and Quality Control: Maintaining consistent purity and efficacy across different batches and manufacturers requires robust standardization and quality control measures, which can be resource-intensive.
Emerging Opportunities in Apigenin
Emerging opportunities in the Apigenin market are significant. The growing trend of personalized nutrition and functional foods presents a substantial avenue for Apigenin-fortified products tailored to specific health needs. Advances in drug delivery systems offer opportunities to enhance Apigenin's therapeutic efficacy, particularly for chronic diseases. The expanding market for anti-aging and natural skincare products is creating a surge in demand for Apigenin in cosmetic formulations due to its potent antioxidant and anti-inflammatory properties. Furthermore, the increasing research into Apigenin's neuroprotective effects opens doors for its application in cognitive health supplements and treatments for neurodegenerative disorders.
Leading Players in the Apigenin Market
- Monteloeder
- Aksuvital
- Bo International
- Indo Phytochem Pharmaceuticals
- Shaanxi QingLan Bio-Technology
- Xian Pincredit Bio-Tech
- Xi an Sost Biotech
- Shaanxi Pioneer Biotech
- Xi'an Lyphar Biotech
- Jiaherb
Key Developments in Apigenin Industry
- 2023/08: Launch of a new nano-encapsulated Apigenin formulation for enhanced bioavailability in nutraceuticals.
- 2023/05: Acquisition of a specialized Apigenin extraction facility by a major player to secure raw material supply.
- 2022/11: Approval of Apigenin as a novel food ingredient in the European Union for functional food applications.
- 2022/07: Publication of significant research detailing Apigenin's efficacy in reducing inflammation in animal models.
- 2021/10: Strategic partnership formed to develop Apigenin-based topical treatments for skin aging.
Future Outlook for Apigenin Market
The future outlook for the Apigenin market is exceptionally positive, driven by its multifaceted benefits and expanding applications. The projected CAGR of approximately 7.5% from 2025 to 2033 underscores its robust growth trajectory. Key growth accelerators include the persistent consumer shift towards natural and scientifically validated health ingredients, coupled with continuous innovation in product formulation and delivery systems. The pharmaceutical sector's increasing reliance on natural compounds for therapeutic interventions, particularly in oncology and neurodegenerative disease research, will remain a significant market driver. Furthermore, the growing demand for clean-label cosmetics and functional foods will continue to fuel market expansion. Strategic opportunities lie in further clinical research to validate new therapeutic uses and in expanding market reach in emerging economies.
Apigenin Segmentation
-
1. Application
- 1.1. Pharma and Healthcare
- 1.2. Food Additives
- 1.3. Cosmetic and Skin Care
- 1.4. Others
-
2. Types
- 2.1. 0.95
- 2.2. 0.98
- 2.3. Others
Apigenin Segmentation By Geography
-
1. North America
- 1.1. United States
- 1.2. Canada
- 1.3. Mexico
-
2. South America
- 2.1. Brazil
- 2.2. Argentina
- 2.3. Rest of South America
-
3. Europe
- 3.1. United Kingdom
- 3.2. Germany
- 3.3. France
- 3.4. Italy
- 3.5. Spain
- 3.6. Russia
- 3.7. Benelux
- 3.8. Nordics
- 3.9. Rest of Europe
-
4. Middle East & Africa
- 4.1. Turkey
- 4.2. Israel
- 4.3. GCC
- 4.4. North Africa
- 4.5. South Africa
- 4.6. Rest of Middle East & Africa
-
5. Asia Pacific
- 5.1. China
- 5.2. India
- 5.3. Japan
- 5.4. South Korea
- 5.5. ASEAN
- 5.6. Oceania
- 5.7. Rest of Asia Pacific
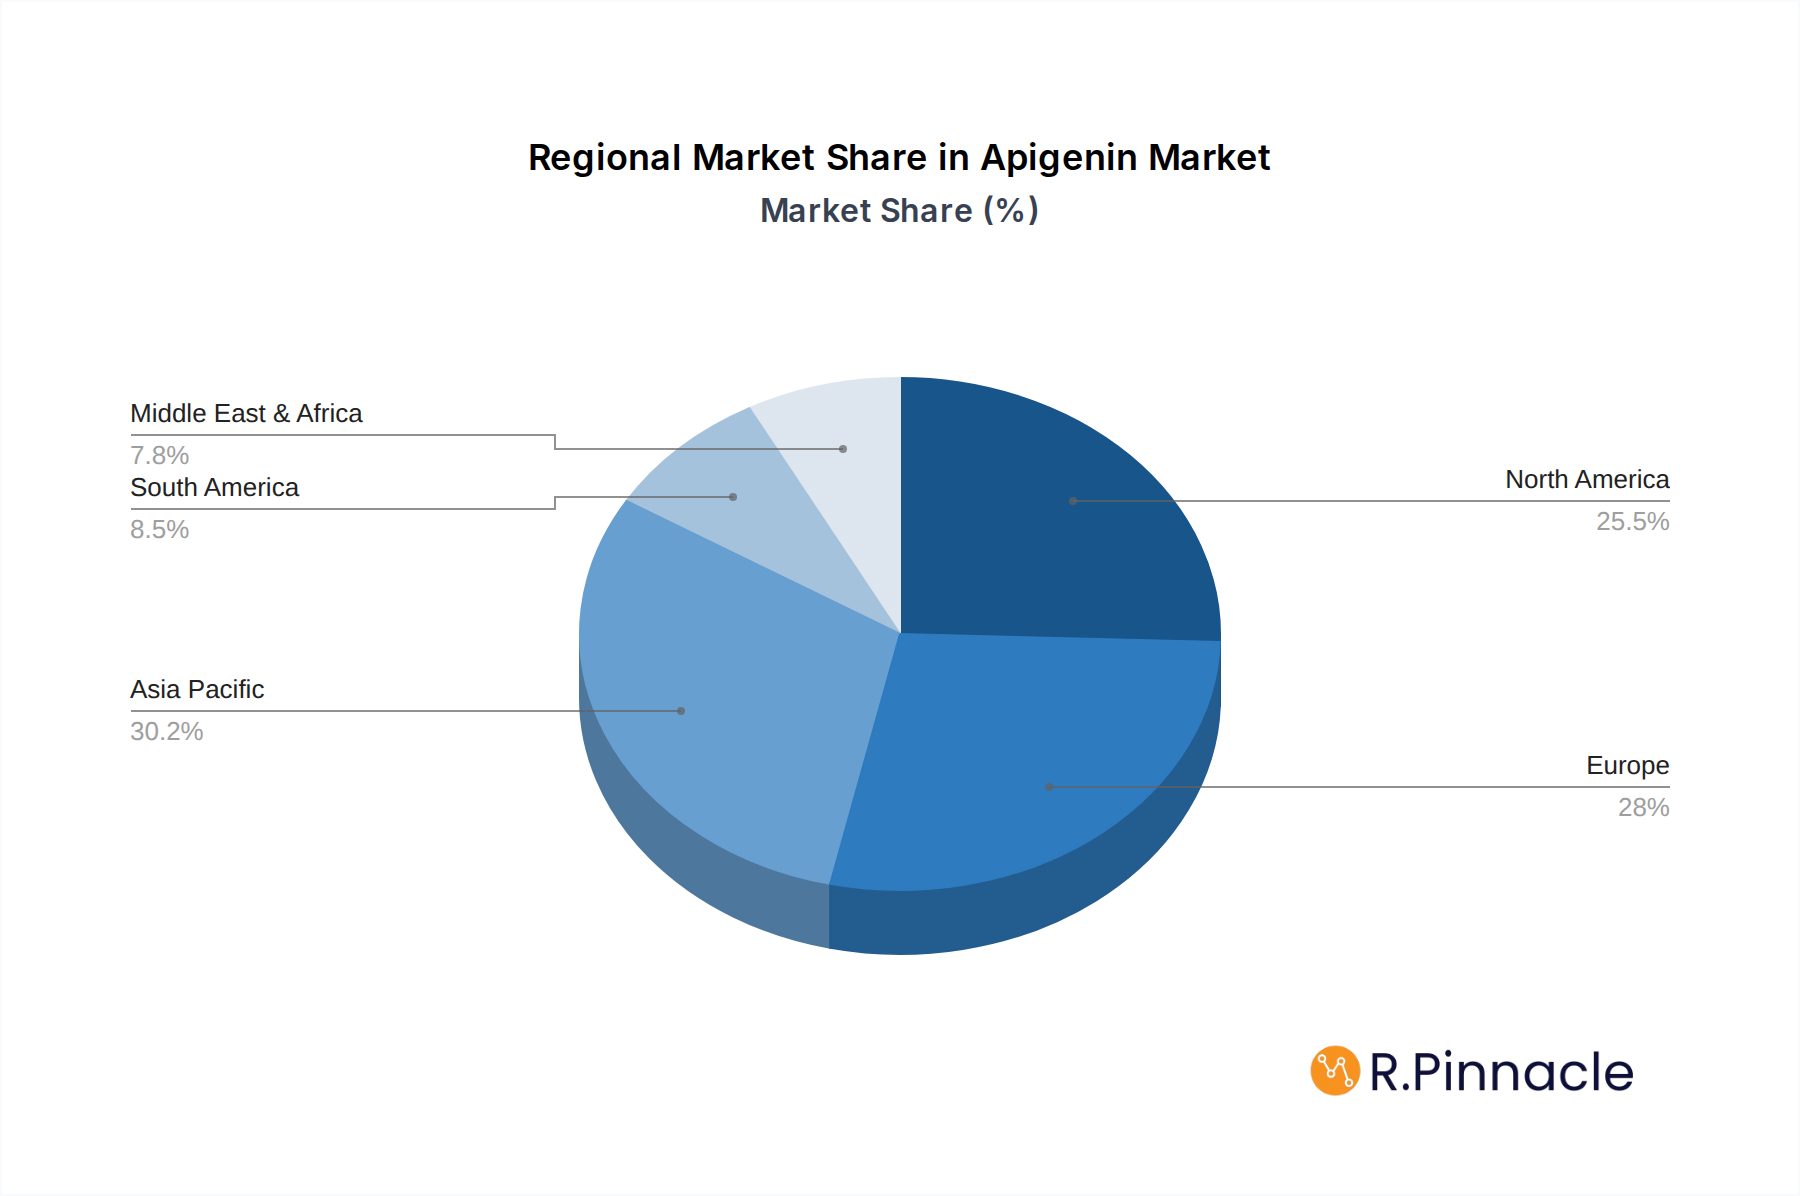
Apigenin Regional Market Share
Geographic Coverage of Apigenin
Apigenin REPORT HIGHLIGHTS
| Aspects | Details |
|---|---|
| Study Period | 2020-2034 |
| Base Year | 2025 |
| Estimated Year | 2026 |
| Forecast Period | 2026-2034 |
| Historical Period | 2020-2025 |
| Growth Rate | CAGR of 3.7% from 2020-2034 |
| Segmentation |
|
Table of Contents
- 1. Introduction
- 1.1. Research Scope
- 1.2. Market Segmentation
- 1.3. Research Objective
- 1.4. Definitions and Assumptions
- 2. Executive Summary
- 2.1. Market Snapshot
- 3. Market Dynamics
- 3.1. Market Drivers
- 3.2. Market Restrains
- 3.3. Market Trends
- 3.4. Market Opportunities
- 4. Market Factor Analysis
- 4.1. Porters Five Forces
- 4.1.1. Bargaining Power of Suppliers
- 4.1.2. Bargaining Power of Buyers
- 4.1.3. Threat of New Entrants
- 4.1.4. Threat of Substitutes
- 4.1.5. Competitive Rivalry
- 4.2. PESTEL analysis
- 4.3. BCG Analysis
- 4.3.1. Stars (High Growth, High Market Share)
- 4.3.2. Cash Cows (Low Growth, High Market Share)
- 4.3.3. Question Mark (High Growth, Low Market Share)
- 4.3.4. Dogs (Low Growth, Low Market Share)
- 4.4. Ansoff Matrix Analysis
- 4.5. Supply Chain Analysis
- 4.6. Regulatory Landscape
- 4.7. Current Market Potential and Opportunity Assessment (TAM–SAM–SOM Framework)
- 4.8. PRI Analyst Note
- 4.1. Porters Five Forces
- 5. Market Analysis, Insights and Forecast 2021-2033
- 5.1. Market Analysis, Insights and Forecast - by Application
- 5.1.1. Pharma and Healthcare
- 5.1.2. Food Additives
- 5.1.3. Cosmetic and Skin Care
- 5.1.4. Others
- 5.2. Market Analysis, Insights and Forecast - by Types
- 5.2.1. 0.95
- 5.2.2. 0.98
- 5.2.3. Others
- 5.3. Market Analysis, Insights and Forecast - by Region
- 5.3.1. North America
- 5.3.2. South America
- 5.3.3. Europe
- 5.3.4. Middle East & Africa
- 5.3.5. Asia Pacific
- 5.1. Market Analysis, Insights and Forecast - by Application
- 6. Global Apigenin Analysis, Insights and Forecast, 2021-2033
- 6.1. Market Analysis, Insights and Forecast - by Application
- 6.1.1. Pharma and Healthcare
- 6.1.2. Food Additives
- 6.1.3. Cosmetic and Skin Care
- 6.1.4. Others
- 6.2. Market Analysis, Insights and Forecast - by Types
- 6.2.1. 0.95
- 6.2.2. 0.98
- 6.2.3. Others
- 6.1. Market Analysis, Insights and Forecast - by Application
- 7. North America Apigenin Analysis, Insights and Forecast, 2020-2032
- 7.1. Market Analysis, Insights and Forecast - by Application
- 7.1.1. Pharma and Healthcare
- 7.1.2. Food Additives
- 7.1.3. Cosmetic and Skin Care
- 7.1.4. Others
- 7.2. Market Analysis, Insights and Forecast - by Types
- 7.2.1. 0.95
- 7.2.2. 0.98
- 7.2.3. Others
- 7.1. Market Analysis, Insights and Forecast - by Application
- 8. South America Apigenin Analysis, Insights and Forecast, 2020-2032
- 8.1. Market Analysis, Insights and Forecast - by Application
- 8.1.1. Pharma and Healthcare
- 8.1.2. Food Additives
- 8.1.3. Cosmetic and Skin Care
- 8.1.4. Others
- 8.2. Market Analysis, Insights and Forecast - by Types
- 8.2.1. 0.95
- 8.2.2. 0.98
- 8.2.3. Others
- 8.1. Market Analysis, Insights and Forecast - by Application
- 9. Europe Apigenin Analysis, Insights and Forecast, 2020-2032
- 9.1. Market Analysis, Insights and Forecast - by Application
- 9.1.1. Pharma and Healthcare
- 9.1.2. Food Additives
- 9.1.3. Cosmetic and Skin Care
- 9.1.4. Others
- 9.2. Market Analysis, Insights and Forecast - by Types
- 9.2.1. 0.95
- 9.2.2. 0.98
- 9.2.3. Others
- 9.1. Market Analysis, Insights and Forecast - by Application
- 10. Middle East & Africa Apigenin Analysis, Insights and Forecast, 2020-2032
- 10.1. Market Analysis, Insights and Forecast - by Application
- 10.1.1. Pharma and Healthcare
- 10.1.2. Food Additives
- 10.1.3. Cosmetic and Skin Care
- 10.1.4. Others
- 10.2. Market Analysis, Insights and Forecast - by Types
- 10.2.1. 0.95
- 10.2.2. 0.98
- 10.2.3. Others
- 10.1. Market Analysis, Insights and Forecast - by Application
- 11. Asia Pacific Apigenin Analysis, Insights and Forecast, 2020-2032
- 11.1. Market Analysis, Insights and Forecast - by Application
- 11.1.1. Pharma and Healthcare
- 11.1.2. Food Additives
- 11.1.3. Cosmetic and Skin Care
- 11.1.4. Others
- 11.2. Market Analysis, Insights and Forecast - by Types
- 11.2.1. 0.95
- 11.2.2. 0.98
- 11.2.3. Others
- 11.1. Market Analysis, Insights and Forecast - by Application
- 12. Competitive Analysis
- 12.1. Company Profiles
- 12.1.1 Monteloeder
- 12.1.1.1. Company Overview
- 12.1.1.2. Products
- 12.1.1.3. Company Financials
- 12.1.1.4. SWOT Analysis
- 12.1.2 Aksuvital
- 12.1.2.1. Company Overview
- 12.1.2.2. Products
- 12.1.2.3. Company Financials
- 12.1.2.4. SWOT Analysis
- 12.1.3 Bo International
- 12.1.3.1. Company Overview
- 12.1.3.2. Products
- 12.1.3.3. Company Financials
- 12.1.3.4. SWOT Analysis
- 12.1.4 Indo Phytochem Pharmaceuticals
- 12.1.4.1. Company Overview
- 12.1.4.2. Products
- 12.1.4.3. Company Financials
- 12.1.4.4. SWOT Analysis
- 12.1.5 Shaanxi QingLan Bio-Technology
- 12.1.5.1. Company Overview
- 12.1.5.2. Products
- 12.1.5.3. Company Financials
- 12.1.5.4. SWOT Analysis
- 12.1.6 Xian Pincredit Bio-Tech
- 12.1.6.1. Company Overview
- 12.1.6.2. Products
- 12.1.6.3. Company Financials
- 12.1.6.4. SWOT Analysis
- 12.1.7 Xi an Sost Biotech
- 12.1.7.1. Company Overview
- 12.1.7.2. Products
- 12.1.7.3. Company Financials
- 12.1.7.4. SWOT Analysis
- 12.1.8 Shaanxi Pioneer Biotech
- 12.1.8.1. Company Overview
- 12.1.8.2. Products
- 12.1.8.3. Company Financials
- 12.1.8.4. SWOT Analysis
- 12.1.9 Xi'an Lyphar Biotech
- 12.1.9.1. Company Overview
- 12.1.9.2. Products
- 12.1.9.3. Company Financials
- 12.1.9.4. SWOT Analysis
- 12.1.10 Jiaherb
- 12.1.10.1. Company Overview
- 12.1.10.2. Products
- 12.1.10.3. Company Financials
- 12.1.10.4. SWOT Analysis
- 12.1.1 Monteloeder
- 12.2. Market Entropy
- 12.2.1 Company's Key Areas Served
- 12.2.2 Recent Developments
- 12.3. Company Market Share Analysis 2025
- 12.3.1 Top 5 Companies Market Share Analysis
- 12.3.2 Top 3 Companies Market Share Analysis
- 12.4. List of Potential Customers
- 13. Research Methodology
List of Figures
- Figure 1: Global Apigenin Revenue Breakdown (million, %) by Region 2025 & 2033
- Figure 2: North America Apigenin Revenue (million), by Application 2025 & 2033
- Figure 3: North America Apigenin Revenue Share (%), by Application 2025 & 2033
- Figure 4: North America Apigenin Revenue (million), by Types 2025 & 2033
- Figure 5: North America Apigenin Revenue Share (%), by Types 2025 & 2033
- Figure 6: North America Apigenin Revenue (million), by Country 2025 & 2033
- Figure 7: North America Apigenin Revenue Share (%), by Country 2025 & 2033
- Figure 8: South America Apigenin Revenue (million), by Application 2025 & 2033
- Figure 9: South America Apigenin Revenue Share (%), by Application 2025 & 2033
- Figure 10: South America Apigenin Revenue (million), by Types 2025 & 2033
- Figure 11: South America Apigenin Revenue Share (%), by Types 2025 & 2033
- Figure 12: South America Apigenin Revenue (million), by Country 2025 & 2033
- Figure 13: South America Apigenin Revenue Share (%), by Country 2025 & 2033
- Figure 14: Europe Apigenin Revenue (million), by Application 2025 & 2033
- Figure 15: Europe Apigenin Revenue Share (%), by Application 2025 & 2033
- Figure 16: Europe Apigenin Revenue (million), by Types 2025 & 2033
- Figure 17: Europe Apigenin Revenue Share (%), by Types 2025 & 2033
- Figure 18: Europe Apigenin Revenue (million), by Country 2025 & 2033
- Figure 19: Europe Apigenin Revenue Share (%), by Country 2025 & 2033
- Figure 20: Middle East & Africa Apigenin Revenue (million), by Application 2025 & 2033
- Figure 21: Middle East & Africa Apigenin Revenue Share (%), by Application 2025 & 2033
- Figure 22: Middle East & Africa Apigenin Revenue (million), by Types 2025 & 2033
- Figure 23: Middle East & Africa Apigenin Revenue Share (%), by Types 2025 & 2033
- Figure 24: Middle East & Africa Apigenin Revenue (million), by Country 2025 & 2033
- Figure 25: Middle East & Africa Apigenin Revenue Share (%), by Country 2025 & 2033
- Figure 26: Asia Pacific Apigenin Revenue (million), by Application 2025 & 2033
- Figure 27: Asia Pacific Apigenin Revenue Share (%), by Application 2025 & 2033
- Figure 28: Asia Pacific Apigenin Revenue (million), by Types 2025 & 2033
- Figure 29: Asia Pacific Apigenin Revenue Share (%), by Types 2025 & 2033
- Figure 30: Asia Pacific Apigenin Revenue (million), by Country 2025 & 2033
- Figure 31: Asia Pacific Apigenin Revenue Share (%), by Country 2025 & 2033
List of Tables
- Table 1: Global Apigenin Revenue million Forecast, by Application 2020 & 2033
- Table 2: Global Apigenin Revenue million Forecast, by Types 2020 & 2033
- Table 3: Global Apigenin Revenue million Forecast, by Region 2020 & 2033
- Table 4: Global Apigenin Revenue million Forecast, by Application 2020 & 2033
- Table 5: Global Apigenin Revenue million Forecast, by Types 2020 & 2033
- Table 6: Global Apigenin Revenue million Forecast, by Country 2020 & 2033
- Table 7: United States Apigenin Revenue (million) Forecast, by Application 2020 & 2033
- Table 8: Canada Apigenin Revenue (million) Forecast, by Application 2020 & 2033
- Table 9: Mexico Apigenin Revenue (million) Forecast, by Application 2020 & 2033
- Table 10: Global Apigenin Revenue million Forecast, by Application 2020 & 2033
- Table 11: Global Apigenin Revenue million Forecast, by Types 2020 & 2033
- Table 12: Global Apigenin Revenue million Forecast, by Country 2020 & 2033
- Table 13: Brazil Apigenin Revenue (million) Forecast, by Application 2020 & 2033
- Table 14: Argentina Apigenin Revenue (million) Forecast, by Application 2020 & 2033
- Table 15: Rest of South America Apigenin Revenue (million) Forecast, by Application 2020 & 2033
- Table 16: Global Apigenin Revenue million Forecast, by Application 2020 & 2033
- Table 17: Global Apigenin Revenue million Forecast, by Types 2020 & 2033
- Table 18: Global Apigenin Revenue million Forecast, by Country 2020 & 2033
- Table 19: United Kingdom Apigenin Revenue (million) Forecast, by Application 2020 & 2033
- Table 20: Germany Apigenin Revenue (million) Forecast, by Application 2020 & 2033
- Table 21: France Apigenin Revenue (million) Forecast, by Application 2020 & 2033
- Table 22: Italy Apigenin Revenue (million) Forecast, by Application 2020 & 2033
- Table 23: Spain Apigenin Revenue (million) Forecast, by Application 2020 & 2033
- Table 24: Russia Apigenin Revenue (million) Forecast, by Application 2020 & 2033
- Table 25: Benelux Apigenin Revenue (million) Forecast, by Application 2020 & 2033
- Table 26: Nordics Apigenin Revenue (million) Forecast, by Application 2020 & 2033
- Table 27: Rest of Europe Apigenin Revenue (million) Forecast, by Application 2020 & 2033
- Table 28: Global Apigenin Revenue million Forecast, by Application 2020 & 2033
- Table 29: Global Apigenin Revenue million Forecast, by Types 2020 & 2033
- Table 30: Global Apigenin Revenue million Forecast, by Country 2020 & 2033
- Table 31: Turkey Apigenin Revenue (million) Forecast, by Application 2020 & 2033
- Table 32: Israel Apigenin Revenue (million) Forecast, by Application 2020 & 2033
- Table 33: GCC Apigenin Revenue (million) Forecast, by Application 2020 & 2033
- Table 34: North Africa Apigenin Revenue (million) Forecast, by Application 2020 & 2033
- Table 35: South Africa Apigenin Revenue (million) Forecast, by Application 2020 & 2033
- Table 36: Rest of Middle East & Africa Apigenin Revenue (million) Forecast, by Application 2020 & 2033
- Table 37: Global Apigenin Revenue million Forecast, by Application 2020 & 2033
- Table 38: Global Apigenin Revenue million Forecast, by Types 2020 & 2033
- Table 39: Global Apigenin Revenue million Forecast, by Country 2020 & 2033
- Table 40: China Apigenin Revenue (million) Forecast, by Application 2020 & 2033
- Table 41: India Apigenin Revenue (million) Forecast, by Application 2020 & 2033
- Table 42: Japan Apigenin Revenue (million) Forecast, by Application 2020 & 2033
- Table 43: South Korea Apigenin Revenue (million) Forecast, by Application 2020 & 2033
- Table 44: ASEAN Apigenin Revenue (million) Forecast, by Application 2020 & 2033
- Table 45: Oceania Apigenin Revenue (million) Forecast, by Application 2020 & 2033
- Table 46: Rest of Asia Pacific Apigenin Revenue (million) Forecast, by Application 2020 & 2033
Frequently Asked Questions
1. What is the projected Compound Annual Growth Rate (CAGR) of the Apigenin?
The projected CAGR is approximately 3.7%.
2. Which companies are prominent players in the Apigenin?
Key companies in the market include Monteloeder, Aksuvital, Bo International, Indo Phytochem Pharmaceuticals, Shaanxi QingLan Bio-Technology, Xian Pincredit Bio-Tech, Xi an Sost Biotech, Shaanxi Pioneer Biotech, Xi'an Lyphar Biotech, Jiaherb.
3. What are the main segments of the Apigenin?
The market segments include Application, Types.
4. Can you provide details about the market size?
The market size is estimated to be USD 134.2 million as of 2022.
5. What are some drivers contributing to market growth?
N/A
6. What are the notable trends driving market growth?
N/A
7. Are there any restraints impacting market growth?
N/A
8. Can you provide examples of recent developments in the market?
N/A
9. What pricing options are available for accessing the report?
Pricing options include single-user, multi-user, and enterprise licenses priced at USD 4900.00, USD 7350.00, and USD 9800.00 respectively.
10. Is the market size provided in terms of value or volume?
The market size is provided in terms of value, measured in million.
11. Are there any specific market keywords associated with the report?
Yes, the market keyword associated with the report is "Apigenin," which aids in identifying and referencing the specific market segment covered.
12. How do I determine which pricing option suits my needs best?
The pricing options vary based on user requirements and access needs. Individual users may opt for single-user licenses, while businesses requiring broader access may choose multi-user or enterprise licenses for cost-effective access to the report.
13. Are there any additional resources or data provided in the Apigenin report?
While the report offers comprehensive insights, it's advisable to review the specific contents or supplementary materials provided to ascertain if additional resources or data are available.
14. How can I stay updated on further developments or reports in the Apigenin?
To stay informed about further developments, trends, and reports in the Apigenin, consider subscribing to industry newsletters, following relevant companies and organizations, or regularly checking reputable industry news sources and publications.
Methodology
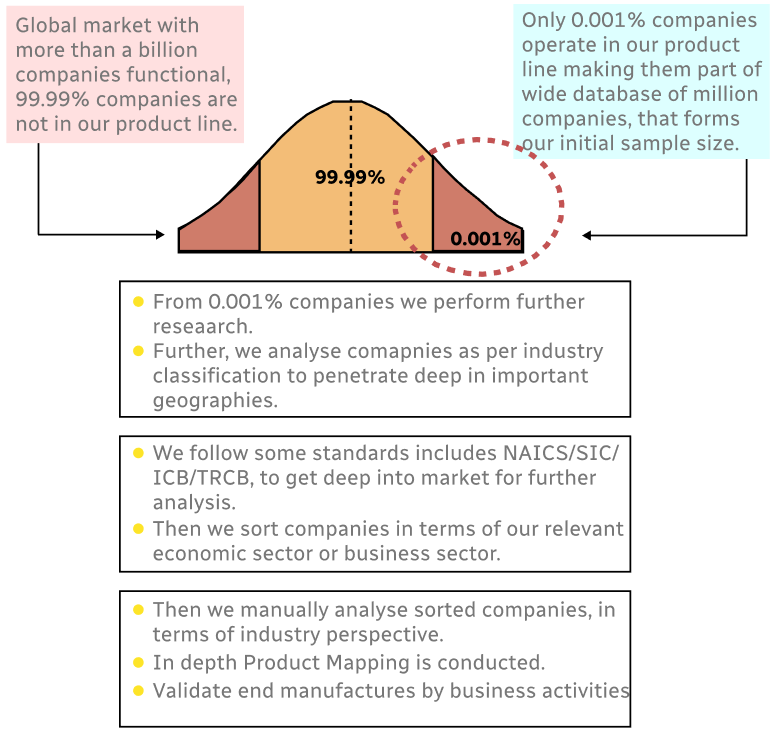
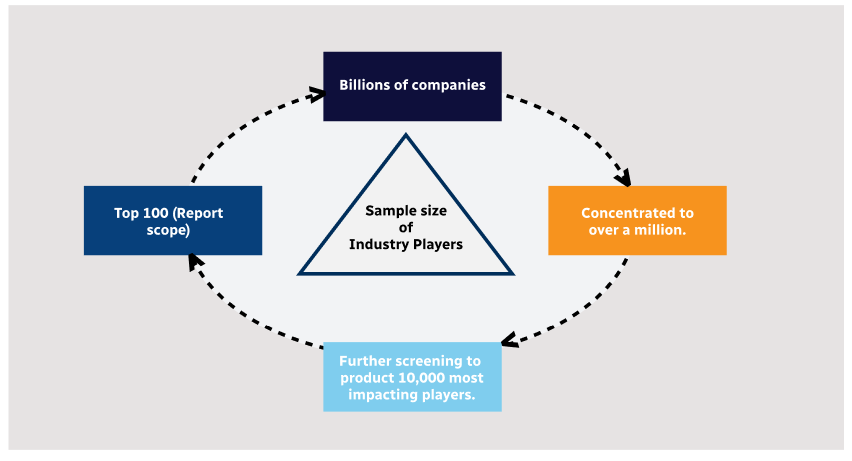
Step 1 - Identification of Relevant Samples Size from Population Database
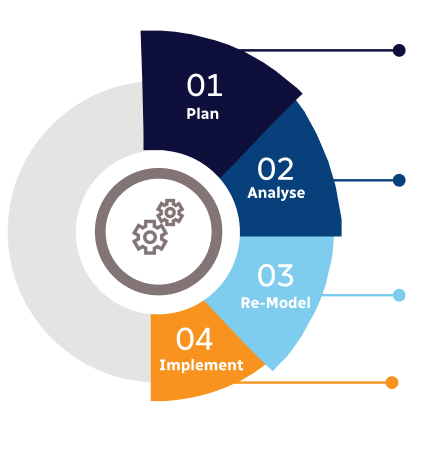
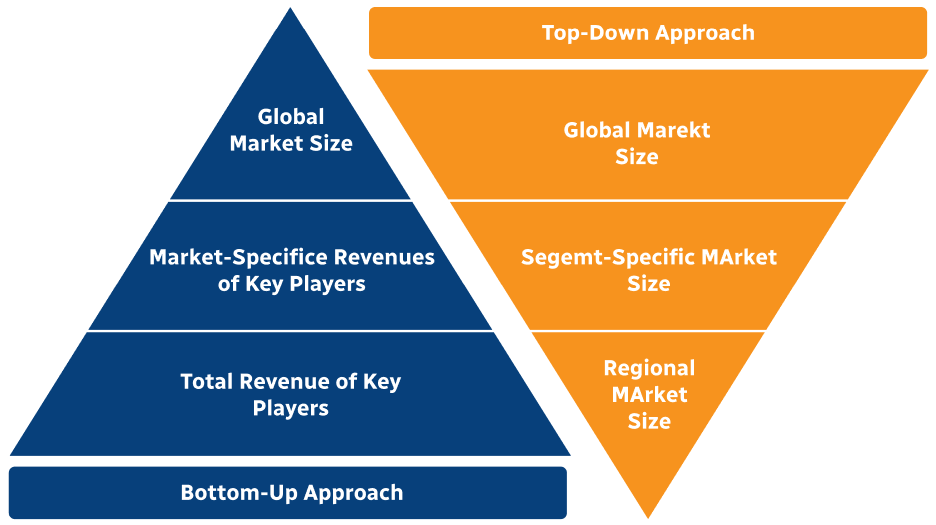
Step 2 - Approaches for Defining Global Market Size (Value, Volume* & Price*)
Note*: In applicable scenarios
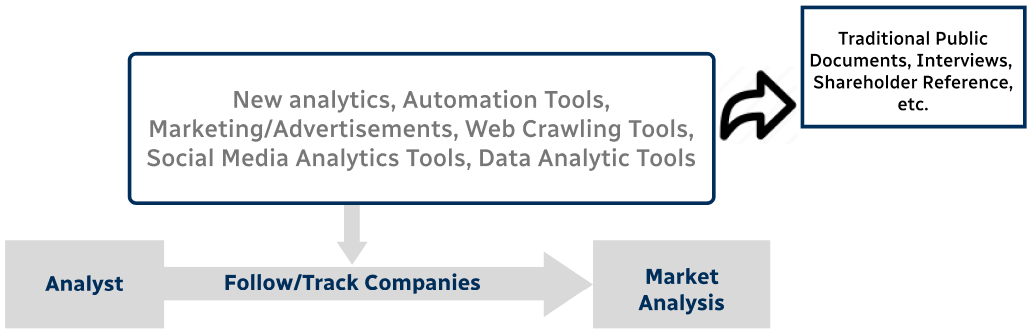
Step 3 - Data Sources
Primary Research
- Web Analytics
- Survey Reports
- Research Institute
- Latest Research Reports
- Opinion Leaders
Secondary Research
- Annual Reports
- White Paper
- Latest Press Release
- Industry Association
- Paid Database
- Investor Presentations
Step 4 - Data Triangulation
Involves using different sources of information in order to increase the validity of a study
These sources are likely to be stakeholders in a program - participants, other researchers, program staff, other community members, and so on.
Then we put all data in single framework & apply various statistical tools to find out the dynamic on the market.
During the analysis stage, feedback from the stakeholder groups would be compared to determine areas of agreement as well as areas of divergence