

Key Insights
The global aquatic therapy market is poised for significant expansion, projected to reach USD 9.44 billion by 2025, driven by an impressive compound annual growth rate (CAGR) of 14.93%. This robust growth is fueled by a confluence of factors, including the increasing prevalence of chronic diseases and musculoskeletal disorders, the growing awareness of water-based rehabilitation benefits for patients of all ages, and advancements in aquatic therapy equipment. The rising demand for non-invasive and low-impact treatment modalities, particularly for conditions like arthritis, fibromyalgia, and post-operative recovery, positions aquatic therapy as a preferred choice for healthcare providers and individuals seeking effective rehabilitation solutions. Moreover, the expanding healthcare infrastructure in emerging economies and the increasing adoption of innovative therapeutic approaches are further accelerating market penetration.
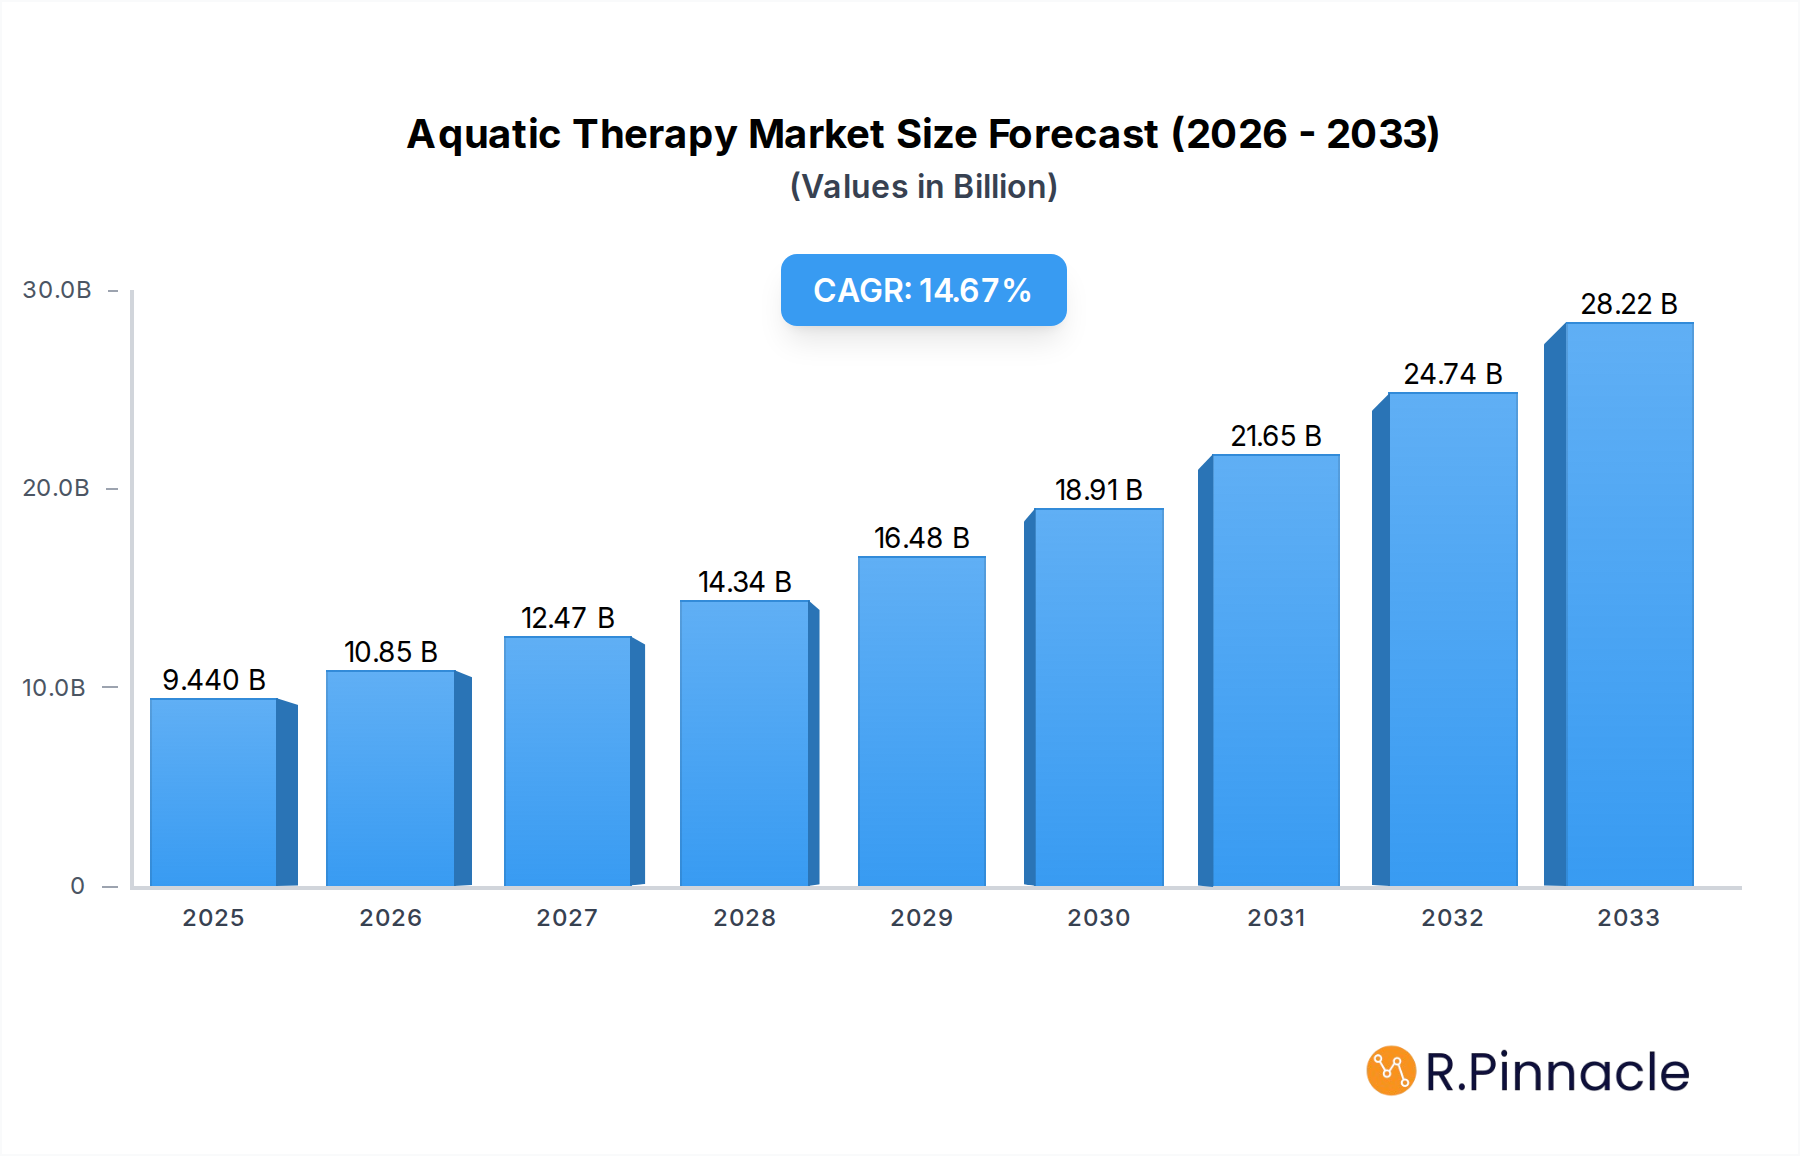
Aquatic Therapy Market Size (In Billion)
The market segmentation reveals a dynamic landscape, with the "Adults" application segment expected to dominate, driven by the aging global population and the associated rise in age-related ailments. In terms of types, the "Aqua Walker" and "Elliptical Water Rider" are anticipated to witness substantial adoption due to their versatility and effectiveness in improving cardiovascular health and lower body strength. Geographically, North America and Europe are expected to remain leading regions due to established healthcare systems and high adoption rates of advanced therapeutic technologies. However, the Asia Pacific region is projected to emerge as the fastest-growing market, propelled by increasing healthcare expenditure, a burgeoning elderly population, and a growing focus on preventive healthcare and rehabilitation services. Key market players are actively engaged in product innovation and strategic collaborations to capture market share and cater to the evolving needs of patients and healthcare professionals.

Aquatic Therapy Company Market Share
Aquatic Therapy Market Report: Comprehensive Insights and Future Projections (2019–2033)
This in-depth report provides a definitive analysis of the global aquatic therapy market, charting its trajectory from historical performance through to robust future projections. Covering a study period from 2019 to 2033, with a base year of 2025 and a forecast period of 2025–2033, this report offers unparalleled insights for industry stakeholders, researchers, and investors. We delve into market structure, dynamics, regional dominance, product innovations, and the critical factors driving growth and presenting challenges. This analysis is vital for understanding the evolving landscape of therapeutic solutions and identifying strategic opportunities within this burgeoning sector, valued at billions of dollars globally.
Aquatic Therapy Market Structure & Innovation Trends
The aquatic therapy market exhibits a moderate level of concentration, with key players like Sprint Aquatics, NZ Manufacturing, Danmar Products Inc, Aqua Creek Products, Fabrication Enterprises, and The Hygenic holding significant market share, estimated to be over 40% collectively. Innovation is primarily driven by advancements in material science for buoyancy aids and resistance equipment, alongside the development of specialized therapeutic pools and integrated digital monitoring systems. Regulatory frameworks, particularly those pertaining to medical device certification and accessibility standards for healthcare facilities, play a crucial role in shaping market entry and product development. The threat of product substitutes, while present in the form of land-based therapies, is mitigated by the unique benefits of water-based treatments for conditions requiring low-impact rehabilitation. End-user demographics are expanding, with a growing focus on geriatric care, neurological rehabilitation, and sports injury recovery. Mergers and acquisition (M&A) activities are anticipated to increase, with an estimated market value for M&A deals projected to reach billions over the forecast period, signaling consolidation and strategic growth for leading enterprises.
Aquatic Therapy Market Dynamics & Trends
The global aquatic therapy market is experiencing robust growth, propelled by an increasing prevalence of chronic diseases, a rising aging population, and a growing awareness of the benefits of non-pharmacological pain management and rehabilitation strategies. The market is projected to witness a Compound Annual Growth Rate (CAGR) of approximately xx% during the forecast period. Technological disruptions are playing a pivotal role, with the integration of smart equipment offering real-time performance tracking and personalized therapy programs. Consumer preferences are shifting towards evidence-based therapeutic approaches that offer faster recovery times and reduced risk of re-injury, making aquatic therapy a highly sought-after intervention. The competitive dynamics are characterized by a blend of established manufacturers and emerging innovators, all vying for market penetration through product differentiation, strategic partnerships with healthcare providers, and expanding distribution networks. The market penetration of aquatic therapy is steadily increasing across diverse healthcare settings, including hospitals, rehabilitation centers, and specialized clinics. The increasing demand for advanced rehabilitation solutions for conditions such as arthritis, fibromyalgia, stroke, and sports-related injuries further fuels market expansion. Furthermore, the growing adoption of telehealth and remote monitoring technologies is beginning to influence aquatic therapy, with potential for remote guidance and progress tracking. Investment in research and development is crucial for maintaining a competitive edge, focusing on enhancing the efficacy and accessibility of aquatic therapy interventions. The market's resilience is further underscored by its adaptability to evolving healthcare policies and reimbursement structures. The increasing focus on preventative healthcare and wellness programs also contributes to the sustained demand for aquatic therapy services.
Dominant Regions & Segments in Aquatic Therapy
North America, particularly the United States, currently holds the dominant position in the global aquatic therapy market. This dominance is attributed to several key drivers including robust healthcare infrastructure, high disposable incomes, a strong emphasis on rehabilitation and preventative care, and supportive government initiatives promoting physical therapy. Economic policies favoring healthcare expenditure and advancements in medical research contribute significantly to this leadership.
Leading Region: North America (USA, Canada)
- Key Drivers: High healthcare spending, advanced rehabilitation facilities, strong reimbursement policies for physical therapy, and widespread adoption of therapeutic technologies.
- Dominance Analysis: The established network of specialized aquatic therapy centers, coupled with a high prevalence of conditions benefiting from hydrotherapy, solidifies North America's market leadership. The presence of major manufacturers and research institutions in this region fosters continuous innovation and market penetration.
Dominant Application Segment: Adults
- Key Drivers: Increasing prevalence of age-related musculoskeletal disorders, rising incidence of chronic pain conditions, and greater demand for post-operative rehabilitation among the adult population.
- Dominance Analysis: Adults represent the largest consumer base for aquatic therapy due to a wide spectrum of conditions requiring low-impact therapeutic interventions. This segment benefits from extensive research supporting the efficacy of aquatic therapy for ailments like arthritis, back pain, and neurological conditions.
Dominant Type Segment: Floatation Belts
- Key Drivers: Versatility, affordability, and ease of use in various therapeutic exercises.
- Dominance Analysis: Floatation belts are fundamental tools in aquatic therapy, enabling patients to achieve buoyancy and perform a wide range of movements with reduced stress on joints. Their widespread application across different therapeutic goals and patient populations makes them a cornerstone of aquatic therapy equipment.
Aquatic Therapy Product Innovations
Recent product innovations in aquatic therapy are centered on enhancing patient engagement and therapeutic outcomes. Advancements include the development of integrated resistance systems for pool bikes and elliptical water riders, offering precise control over exercise intensity. Smart buoyancy aids with embedded sensors are emerging, providing real-time data on patient movement and progress for therapists. Wearable aquatic therapy devices are also gaining traction, offering personalized resistance and feedback. These innovations aim to improve rehabilitation efficiency, expand the range of treatable conditions, and offer a more data-driven approach to hydrotherapy, thereby enhancing competitive advantages in the market.
Report Scope & Segmentation Analysis
This report meticulously segments the global aquatic therapy market across key dimensions.
Application Segments:
- Teenagers: Focuses on pediatric rehabilitation, sports-related injuries, and developmental disorders. Projected market growth is significant, driven by increased awareness of early intervention.
- Adults: Encompasses rehabilitation for chronic conditions, post-operative recovery, and pain management. This segment is expected to maintain its dominance with steady growth.
Type Segments:
- Aqua Walker: Designed for gait training and lower limb rehabilitation, showing strong growth due to its therapeutic efficacy.
- Elliptical Water Rider: Offers a low-impact cardiovascular workout and benefits for joint mobility.
- Pool Bike: Ideal for improving cardiovascular health and lower body strength with minimal joint stress.
- Floatation Belts: Essential for buoyancy support, demonstrating consistent demand and market penetration.
- Ankle Cuffs: Used for resistance training and rehabilitation exercises.
- Swim Bar: Aids in stability and upper body exercises.
- Head Float: Supports the head and neck for specialized therapeutic needs.
- Others: Includes a range of specialized equipment and accessories catering to niche therapeutic requirements.
Each segment's growth projections, current market sizes (in billions), and competitive dynamics are thoroughly analyzed within this report.
Key Drivers of Aquatic Therapy Growth
The expansion of the aquatic therapy market is propelled by several interconnected factors. A primary driver is the escalating global burden of chronic diseases and musculoskeletal disorders, which necessitates effective, low-impact rehabilitation solutions. The aging demographic worldwide further amplifies this demand, as elderly individuals often require gentle therapeutic interventions to maintain mobility and manage pain. Technological advancements in aquatic therapy equipment, such as smart resistance systems and interactive platforms, are enhancing treatment efficacy and patient engagement, driving market adoption. Favorable reimbursement policies for physical therapy services in many developed economies also significantly contribute to market growth by increasing accessibility.
Challenges in the Aquatic Therapy Sector
Despite its promising growth, the aquatic therapy sector faces several significant challenges. High initial setup costs for specialized aquatic therapy facilities, including the construction and maintenance of therapeutic pools, can act as a barrier to entry for smaller healthcare providers. Limited awareness and understanding of the specific benefits of aquatic therapy among some healthcare professionals and the general public can hinder widespread adoption. Regulatory hurdles, particularly concerning accessibility standards and equipment certifications in certain regions, can also slow down market expansion. Furthermore, the availability of skilled aquatic therapy professionals and the ongoing need for continuous training present a human resource challenge.
Emerging Opportunities in Aquatic Therapy
The aquatic therapy market is ripe with emerging opportunities driven by evolving healthcare trends and technological innovation. The growing emphasis on preventative healthcare and wellness programs presents a significant opportunity for expanding the use of aquatic therapy beyond traditional rehabilitation settings. The development of portable and more affordable aquatic therapy equipment can broaden its accessibility to home-care settings and underserved regions. Furthermore, the integration of virtual reality (VR) and augmented reality (AR) technologies with aquatic therapy could revolutionize patient engagement and provide immersive therapeutic experiences. The expansion of telehealth services also opens avenues for remote aquatic therapy guidance and monitoring.
Leading Players in the Aquatic Therapy Market
- Sprint Aquatics
- NZ Manufacturing
- Danmar Products Inc
- Aqua Creek Products
- Fabrication Enterprises
- The Hygenic
Key Developments in Aquatic Therapy Industry
- 2023: Launch of new smart resistance pool bikes by Sprint Aquatics, enhancing personalized workout tracking.
- 2023: Fabrication Enterprises introduces an upgraded line of ergonomic buoyancy aids designed for enhanced patient comfort and support.
- 2022: Aqua Creek Products expands its range of accessible pool lifts, improving entry and exit for individuals with mobility impairments.
- 2022: NZ Manufacturing develops a new multi-functional aquatic treadmill with integrated pressure mapping capabilities.
- 2021: Danmar Products Inc. partners with a leading research institution to study the efficacy of aquatic therapy for post-COVID-19 rehabilitation.
- 2021: The Hygenic releases a new line of antimicrobial aquatic therapy accessories to promote enhanced hygiene in pool environments.
Future Outlook for Aquatic Therapy Market
The future outlook for the aquatic therapy market is exceptionally promising, driven by an increasing global demand for effective and low-impact rehabilitation solutions. The growing aging population, coupled with a rising incidence of chronic diseases, will continue to fuel the need for hydrotherapy. Innovations in smart aquatic therapy equipment, including AI-powered personalized therapy programs and advanced monitoring systems, are expected to enhance treatment outcomes and patient satisfaction. The expanding scope of applications for aquatic therapy, encompassing not just physical rehabilitation but also mental wellness and preventative health, will unlock new market segments. Strategic collaborations between equipment manufacturers, healthcare providers, and research institutions will be crucial for driving further growth and innovation. The market is poised for sustained expansion, with significant opportunities for companies that can offer advanced, accessible, and evidence-based aquatic therapy solutions, valued in the billions globally.
Aquatic Therapy Segmentation
-
1. Application
- 1.1. Teenagers
- 1.2. Adults
-
2. Types
- 2.1. Aqua Walker
- 2.2. Elliptical Water Rider
- 2.3. Pool Bike
- 2.4. Floatation Belts
- 2.5. Ankle Cuffs
- 2.6. Swim Bar
- 2.7. Head Float
- 2.8. Others
Aquatic Therapy Segmentation By Geography
-
1. North America
- 1.1. United States
- 1.2. Canada
- 1.3. Mexico
-
2. South America
- 2.1. Brazil
- 2.2. Argentina
- 2.3. Rest of South America
-
3. Europe
- 3.1. United Kingdom
- 3.2. Germany
- 3.3. France
- 3.4. Italy
- 3.5. Spain
- 3.6. Russia
- 3.7. Benelux
- 3.8. Nordics
- 3.9. Rest of Europe
-
4. Middle East & Africa
- 4.1. Turkey
- 4.2. Israel
- 4.3. GCC
- 4.4. North Africa
- 4.5. South Africa
- 4.6. Rest of Middle East & Africa
-
5. Asia Pacific
- 5.1. China
- 5.2. India
- 5.3. Japan
- 5.4. South Korea
- 5.5. ASEAN
- 5.6. Oceania
- 5.7. Rest of Asia Pacific

Aquatic Therapy Regional Market Share
Geographic Coverage of Aquatic Therapy
Aquatic Therapy REPORT HIGHLIGHTS
| Aspects | Details |
|---|---|
| Study Period | 2020-2034 |
| Base Year | 2025 |
| Estimated Year | 2026 |
| Forecast Period | 2026-2034 |
| Historical Period | 2020-2025 |
| Growth Rate | CAGR of 14.93% from 2020-2034 |
| Segmentation |
|
Table of Contents
- 1. Introduction
- 1.1. Research Scope
- 1.2. Market Segmentation
- 1.3. Research Methodology
- 1.4. Definitions and Assumptions
- 2. Executive Summary
- 2.1. Introduction
- 3. Market Dynamics
- 3.1. Introduction
- 3.2. Market Drivers
- 3.3. Market Restrains
- 3.4. Market Trends
- 4. Market Factor Analysis
- 4.1. Porters Five Forces
- 4.2. Supply/Value Chain
- 4.3. PESTEL analysis
- 4.4. Market Entropy
- 4.5. Patent/Trademark Analysis
- 5. Global Aquatic Therapy Analysis, Insights and Forecast, 2020-2032
- 5.1. Market Analysis, Insights and Forecast - by Application
- 5.1.1. Teenagers
- 5.1.2. Adults
- 5.2. Market Analysis, Insights and Forecast - by Types
- 5.2.1. Aqua Walker
- 5.2.2. Elliptical Water Rider
- 5.2.3. Pool Bike
- 5.2.4. Floatation Belts
- 5.2.5. Ankle Cuffs
- 5.2.6. Swim Bar
- 5.2.7. Head Float
- 5.2.8. Others
- 5.3. Market Analysis, Insights and Forecast - by Region
- 5.3.1. North America
- 5.3.2. South America
- 5.3.3. Europe
- 5.3.4. Middle East & Africa
- 5.3.5. Asia Pacific
- 5.1. Market Analysis, Insights and Forecast - by Application
- 6. North America Aquatic Therapy Analysis, Insights and Forecast, 2020-2032
- 6.1. Market Analysis, Insights and Forecast - by Application
- 6.1.1. Teenagers
- 6.1.2. Adults
- 6.2. Market Analysis, Insights and Forecast - by Types
- 6.2.1. Aqua Walker
- 6.2.2. Elliptical Water Rider
- 6.2.3. Pool Bike
- 6.2.4. Floatation Belts
- 6.2.5. Ankle Cuffs
- 6.2.6. Swim Bar
- 6.2.7. Head Float
- 6.2.8. Others
- 6.1. Market Analysis, Insights and Forecast - by Application
- 7. South America Aquatic Therapy Analysis, Insights and Forecast, 2020-2032
- 7.1. Market Analysis, Insights and Forecast - by Application
- 7.1.1. Teenagers
- 7.1.2. Adults
- 7.2. Market Analysis, Insights and Forecast - by Types
- 7.2.1. Aqua Walker
- 7.2.2. Elliptical Water Rider
- 7.2.3. Pool Bike
- 7.2.4. Floatation Belts
- 7.2.5. Ankle Cuffs
- 7.2.6. Swim Bar
- 7.2.7. Head Float
- 7.2.8. Others
- 7.1. Market Analysis, Insights and Forecast - by Application
- 8. Europe Aquatic Therapy Analysis, Insights and Forecast, 2020-2032
- 8.1. Market Analysis, Insights and Forecast - by Application
- 8.1.1. Teenagers
- 8.1.2. Adults
- 8.2. Market Analysis, Insights and Forecast - by Types
- 8.2.1. Aqua Walker
- 8.2.2. Elliptical Water Rider
- 8.2.3. Pool Bike
- 8.2.4. Floatation Belts
- 8.2.5. Ankle Cuffs
- 8.2.6. Swim Bar
- 8.2.7. Head Float
- 8.2.8. Others
- 8.1. Market Analysis, Insights and Forecast - by Application
- 9. Middle East & Africa Aquatic Therapy Analysis, Insights and Forecast, 2020-2032
- 9.1. Market Analysis, Insights and Forecast - by Application
- 9.1.1. Teenagers
- 9.1.2. Adults
- 9.2. Market Analysis, Insights and Forecast - by Types
- 9.2.1. Aqua Walker
- 9.2.2. Elliptical Water Rider
- 9.2.3. Pool Bike
- 9.2.4. Floatation Belts
- 9.2.5. Ankle Cuffs
- 9.2.6. Swim Bar
- 9.2.7. Head Float
- 9.2.8. Others
- 9.1. Market Analysis, Insights and Forecast - by Application
- 10. Asia Pacific Aquatic Therapy Analysis, Insights and Forecast, 2020-2032
- 10.1. Market Analysis, Insights and Forecast - by Application
- 10.1.1. Teenagers
- 10.1.2. Adults
- 10.2. Market Analysis, Insights and Forecast - by Types
- 10.2.1. Aqua Walker
- 10.2.2. Elliptical Water Rider
- 10.2.3. Pool Bike
- 10.2.4. Floatation Belts
- 10.2.5. Ankle Cuffs
- 10.2.6. Swim Bar
- 10.2.7. Head Float
- 10.2.8. Others
- 10.1. Market Analysis, Insights and Forecast - by Application
- 11. Competitive Analysis
- 11.1. Global Market Share Analysis 2025
- 11.2. Company Profiles
- 11.2.1 Sprint Aquatics
- 11.2.1.1. Overview
- 11.2.1.2. Products
- 11.2.1.3. SWOT Analysis
- 11.2.1.4. Recent Developments
- 11.2.1.5. Financials (Based on Availability)
- 11.2.2 NZ Manufacturing
- 11.2.2.1. Overview
- 11.2.2.2. Products
- 11.2.2.3. SWOT Analysis
- 11.2.2.4. Recent Developments
- 11.2.2.5. Financials (Based on Availability)
- 11.2.3 Danmar Products Inc
- 11.2.3.1. Overview
- 11.2.3.2. Products
- 11.2.3.3. SWOT Analysis
- 11.2.3.4. Recent Developments
- 11.2.3.5. Financials (Based on Availability)
- 11.2.4 Aqua Creek Products
- 11.2.4.1. Overview
- 11.2.4.2. Products
- 11.2.4.3. SWOT Analysis
- 11.2.4.4. Recent Developments
- 11.2.4.5. Financials (Based on Availability)
- 11.2.5 Fabrication Enterprises
- 11.2.5.1. Overview
- 11.2.5.2. Products
- 11.2.5.3. SWOT Analysis
- 11.2.5.4. Recent Developments
- 11.2.5.5. Financials (Based on Availability)
- 11.2.6 The Hygenic
- 11.2.6.1. Overview
- 11.2.6.2. Products
- 11.2.6.3. SWOT Analysis
- 11.2.6.4. Recent Developments
- 11.2.6.5. Financials (Based on Availability)
- 11.2.1 Sprint Aquatics
List of Figures
- Figure 1: Global Aquatic Therapy Revenue Breakdown (billion, %) by Region 2025 & 2033
- Figure 2: North America Aquatic Therapy Revenue (billion), by Application 2025 & 2033
- Figure 3: North America Aquatic Therapy Revenue Share (%), by Application 2025 & 2033
- Figure 4: North America Aquatic Therapy Revenue (billion), by Types 2025 & 2033
- Figure 5: North America Aquatic Therapy Revenue Share (%), by Types 2025 & 2033
- Figure 6: North America Aquatic Therapy Revenue (billion), by Country 2025 & 2033
- Figure 7: North America Aquatic Therapy Revenue Share (%), by Country 2025 & 2033
- Figure 8: South America Aquatic Therapy Revenue (billion), by Application 2025 & 2033
- Figure 9: South America Aquatic Therapy Revenue Share (%), by Application 2025 & 2033
- Figure 10: South America Aquatic Therapy Revenue (billion), by Types 2025 & 2033
- Figure 11: South America Aquatic Therapy Revenue Share (%), by Types 2025 & 2033
- Figure 12: South America Aquatic Therapy Revenue (billion), by Country 2025 & 2033
- Figure 13: South America Aquatic Therapy Revenue Share (%), by Country 2025 & 2033
- Figure 14: Europe Aquatic Therapy Revenue (billion), by Application 2025 & 2033
- Figure 15: Europe Aquatic Therapy Revenue Share (%), by Application 2025 & 2033
- Figure 16: Europe Aquatic Therapy Revenue (billion), by Types 2025 & 2033
- Figure 17: Europe Aquatic Therapy Revenue Share (%), by Types 2025 & 2033
- Figure 18: Europe Aquatic Therapy Revenue (billion), by Country 2025 & 2033
- Figure 19: Europe Aquatic Therapy Revenue Share (%), by Country 2025 & 2033
- Figure 20: Middle East & Africa Aquatic Therapy Revenue (billion), by Application 2025 & 2033
- Figure 21: Middle East & Africa Aquatic Therapy Revenue Share (%), by Application 2025 & 2033
- Figure 22: Middle East & Africa Aquatic Therapy Revenue (billion), by Types 2025 & 2033
- Figure 23: Middle East & Africa Aquatic Therapy Revenue Share (%), by Types 2025 & 2033
- Figure 24: Middle East & Africa Aquatic Therapy Revenue (billion), by Country 2025 & 2033
- Figure 25: Middle East & Africa Aquatic Therapy Revenue Share (%), by Country 2025 & 2033
- Figure 26: Asia Pacific Aquatic Therapy Revenue (billion), by Application 2025 & 2033
- Figure 27: Asia Pacific Aquatic Therapy Revenue Share (%), by Application 2025 & 2033
- Figure 28: Asia Pacific Aquatic Therapy Revenue (billion), by Types 2025 & 2033
- Figure 29: Asia Pacific Aquatic Therapy Revenue Share (%), by Types 2025 & 2033
- Figure 30: Asia Pacific Aquatic Therapy Revenue (billion), by Country 2025 & 2033
- Figure 31: Asia Pacific Aquatic Therapy Revenue Share (%), by Country 2025 & 2033
List of Tables
- Table 1: Global Aquatic Therapy Revenue billion Forecast, by Application 2020 & 2033
- Table 2: Global Aquatic Therapy Revenue billion Forecast, by Types 2020 & 2033
- Table 3: Global Aquatic Therapy Revenue billion Forecast, by Region 2020 & 2033
- Table 4: Global Aquatic Therapy Revenue billion Forecast, by Application 2020 & 2033
- Table 5: Global Aquatic Therapy Revenue billion Forecast, by Types 2020 & 2033
- Table 6: Global Aquatic Therapy Revenue billion Forecast, by Country 2020 & 2033
- Table 7: United States Aquatic Therapy Revenue (billion) Forecast, by Application 2020 & 2033
- Table 8: Canada Aquatic Therapy Revenue (billion) Forecast, by Application 2020 & 2033
- Table 9: Mexico Aquatic Therapy Revenue (billion) Forecast, by Application 2020 & 2033
- Table 10: Global Aquatic Therapy Revenue billion Forecast, by Application 2020 & 2033
- Table 11: Global Aquatic Therapy Revenue billion Forecast, by Types 2020 & 2033
- Table 12: Global Aquatic Therapy Revenue billion Forecast, by Country 2020 & 2033
- Table 13: Brazil Aquatic Therapy Revenue (billion) Forecast, by Application 2020 & 2033
- Table 14: Argentina Aquatic Therapy Revenue (billion) Forecast, by Application 2020 & 2033
- Table 15: Rest of South America Aquatic Therapy Revenue (billion) Forecast, by Application 2020 & 2033
- Table 16: Global Aquatic Therapy Revenue billion Forecast, by Application 2020 & 2033
- Table 17: Global Aquatic Therapy Revenue billion Forecast, by Types 2020 & 2033
- Table 18: Global Aquatic Therapy Revenue billion Forecast, by Country 2020 & 2033
- Table 19: United Kingdom Aquatic Therapy Revenue (billion) Forecast, by Application 2020 & 2033
- Table 20: Germany Aquatic Therapy Revenue (billion) Forecast, by Application 2020 & 2033
- Table 21: France Aquatic Therapy Revenue (billion) Forecast, by Application 2020 & 2033
- Table 22: Italy Aquatic Therapy Revenue (billion) Forecast, by Application 2020 & 2033
- Table 23: Spain Aquatic Therapy Revenue (billion) Forecast, by Application 2020 & 2033
- Table 24: Russia Aquatic Therapy Revenue (billion) Forecast, by Application 2020 & 2033
- Table 25: Benelux Aquatic Therapy Revenue (billion) Forecast, by Application 2020 & 2033
- Table 26: Nordics Aquatic Therapy Revenue (billion) Forecast, by Application 2020 & 2033
- Table 27: Rest of Europe Aquatic Therapy Revenue (billion) Forecast, by Application 2020 & 2033
- Table 28: Global Aquatic Therapy Revenue billion Forecast, by Application 2020 & 2033
- Table 29: Global Aquatic Therapy Revenue billion Forecast, by Types 2020 & 2033
- Table 30: Global Aquatic Therapy Revenue billion Forecast, by Country 2020 & 2033
- Table 31: Turkey Aquatic Therapy Revenue (billion) Forecast, by Application 2020 & 2033
- Table 32: Israel Aquatic Therapy Revenue (billion) Forecast, by Application 2020 & 2033
- Table 33: GCC Aquatic Therapy Revenue (billion) Forecast, by Application 2020 & 2033
- Table 34: North Africa Aquatic Therapy Revenue (billion) Forecast, by Application 2020 & 2033
- Table 35: South Africa Aquatic Therapy Revenue (billion) Forecast, by Application 2020 & 2033
- Table 36: Rest of Middle East & Africa Aquatic Therapy Revenue (billion) Forecast, by Application 2020 & 2033
- Table 37: Global Aquatic Therapy Revenue billion Forecast, by Application 2020 & 2033
- Table 38: Global Aquatic Therapy Revenue billion Forecast, by Types 2020 & 2033
- Table 39: Global Aquatic Therapy Revenue billion Forecast, by Country 2020 & 2033
- Table 40: China Aquatic Therapy Revenue (billion) Forecast, by Application 2020 & 2033
- Table 41: India Aquatic Therapy Revenue (billion) Forecast, by Application 2020 & 2033
- Table 42: Japan Aquatic Therapy Revenue (billion) Forecast, by Application 2020 & 2033
- Table 43: South Korea Aquatic Therapy Revenue (billion) Forecast, by Application 2020 & 2033
- Table 44: ASEAN Aquatic Therapy Revenue (billion) Forecast, by Application 2020 & 2033
- Table 45: Oceania Aquatic Therapy Revenue (billion) Forecast, by Application 2020 & 2033
- Table 46: Rest of Asia Pacific Aquatic Therapy Revenue (billion) Forecast, by Application 2020 & 2033
Frequently Asked Questions
1. What is the projected Compound Annual Growth Rate (CAGR) of the Aquatic Therapy?
The projected CAGR is approximately 14.93%.
2. Which companies are prominent players in the Aquatic Therapy?
Key companies in the market include Sprint Aquatics, NZ Manufacturing, Danmar Products Inc, Aqua Creek Products, Fabrication Enterprises, The Hygenic.
3. What are the main segments of the Aquatic Therapy?
The market segments include Application, Types.
4. Can you provide details about the market size?
The market size is estimated to be USD 9.44 billion as of 2022.
5. What are some drivers contributing to market growth?
N/A
6. What are the notable trends driving market growth?
N/A
7. Are there any restraints impacting market growth?
N/A
8. Can you provide examples of recent developments in the market?
N/A
9. What pricing options are available for accessing the report?
Pricing options include single-user, multi-user, and enterprise licenses priced at USD 4900.00, USD 7350.00, and USD 9800.00 respectively.
10. Is the market size provided in terms of value or volume?
The market size is provided in terms of value, measured in billion.
11. Are there any specific market keywords associated with the report?
Yes, the market keyword associated with the report is "Aquatic Therapy," which aids in identifying and referencing the specific market segment covered.
12. How do I determine which pricing option suits my needs best?
The pricing options vary based on user requirements and access needs. Individual users may opt for single-user licenses, while businesses requiring broader access may choose multi-user or enterprise licenses for cost-effective access to the report.
13. Are there any additional resources or data provided in the Aquatic Therapy report?
While the report offers comprehensive insights, it's advisable to review the specific contents or supplementary materials provided to ascertain if additional resources or data are available.
14. How can I stay updated on further developments or reports in the Aquatic Therapy?
To stay informed about further developments, trends, and reports in the Aquatic Therapy, consider subscribing to industry newsletters, following relevant companies and organizations, or regularly checking reputable industry news sources and publications.
Methodology
Step 1 - Identification of Relevant Samples Size from Population Database


Step 2 - Approaches for Defining Global Market Size (Value, Volume* & Price*)

Note*: In applicable scenarios
Step 3 - Data Sources
Primary Research
- Web Analytics
- Survey Reports
- Research Institute
- Latest Research Reports
- Opinion Leaders
Secondary Research
- Annual Reports
- White Paper
- Latest Press Release
- Industry Association
- Paid Database
- Investor Presentations

Step 4 - Data Triangulation
Involves using different sources of information in order to increase the validity of a study
These sources are likely to be stakeholders in a program - participants, other researchers, program staff, other community members, and so on.
Then we put all data in single framework & apply various statistical tools to find out the dynamic on the market.
During the analysis stage, feedback from the stakeholder groups would be compared to determine areas of agreement as well as areas of divergence